Scott-Macon Aerospace, Defense and Government Services (May 2017)
Infrastructure 2015 March
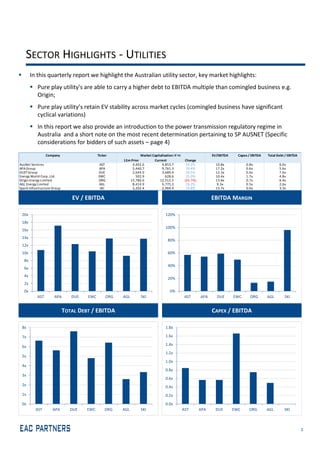
1. In this quarterly report we highlight the Australian utility sector, key market highlights:
Pure play utility's are able to carry a higher debt to EBITDA multiple than comingled business e.g.
Origin;
Pure play utility’s retain EV stability across market cycles (comingled business have significant
cyclical variations)
In this report we also provide an introduction to the power transmission regulatory regime in
Australia and a short note on the most recent determination pertaining to SP AUSNET (Specific
considerations for bidders of such assets – page 4)
1
SECTOR HIGHLIGHTS ‐ UTILITIES
TOTAL DEBT / EBITDA CAPEX / EBITDA
EBITDA MARGINEV / EBITDA
Company Ticker Market Capitalisation ( $'m) EV/EBITDA Capex / EBITDA Total Debt / EBITDA
12m Prior Current Change
AusNet Services AST 4,402.6 4,853.7 10.2% 10.8x 0.8x 6.6x
APA Group APA 5,440.7 9,761.3 79.4% 17.2x 0.6x 5.6x
DUET Group DUE 2,644.9 3,689.4 39.5% 12.3x 0.6x 7.6x
Energy World Corp. Ltd. EWC 502.9 628.6 25.0% 10.4x 1.7x 4.8x
Origin Energy Limited ORG 15,780.6 12,512.5 (20.7%) 13.8x 0.7x 6.4x
AGL Energy Limited AGL 8,414.9 9,775.2 16.2% 9.3x 0.5x 2.6x
Spark Infrastructure Group SKI 2,202.4 2,969.4 34.8% 13.7x 0.0x 3.3x
0x
2x
4x
6x
8x
10x
12x
14x
16x
18x
20x
AST APA DUE EWC ORG AGL SKI
0%
20%
40%
60%
80%
100%
120%
AST APA DUE EWC ORG AGL SKI
0x
1x
2x
3x
4x
5x
6x
7x
8x
AST APA DUE EWC ORG AGL SKI
0.0x
0.2x
0.4x
0.6x
0.8x
1.0x
1.2x
1.4x
1.6x
1.8x
AST APA DUE EWC ORG AGL SKI
2. NEM
2
INSTITUTIONAL STRUCTURE‐NATIONAL ELECTRICITY MARKET
Council of Australian
Governments
Australian
Government
AEMC Establishment
Act
Standing Council for
Energy and
Resources
Trade Practices Act
National Electricity
Law
Australian Energy
Market Commission
Australian Energy
Regulator
National Electricity
Rules
Australia Energy
Market Operator
Market participants
and customers
State and Territory
Governments
Competition
regulator
establishment acts
Merit reviews – the
Australian
Competition
Tribunal
State‐specific
competition
regulators
Rule change requests & policy
Reviews & Rules
Rule change
requests
Licensing standards,
environmental
regulations
Regulation of retail
market / standards
Economic
regulation &
enforcement
System & market
operator
Rule
change
requests
3. The most recent Transmission Determination for Sp AusNet for the period 2014 ‐2017 issued by the
Australian Energy Regulator was released in January 2014. This follows the previous Determination which
covered the period 2008‐2014.
Highlights
The Australian Energy Regulator has determined that SP AusNet will recover $1600 million ($nominal) in
the 2014–17 regulatory period.
This should result in transmission charges falling by around 5 per cent per annum in real terms, from 2013–
14.
An average Victorian household or Victorian business, may see electricity bills decline by about $4 or $16
per annum, respectively.
TRANSMISSION DETERMINATION FOR SP AUSNET – 2014 ‐ 2017
Source: www.aer.gov.au 3
TRANSMISSION ‐ REGULATORY HIGHLIGHTS SP AUSNET
Total revenue requirements over the 2014‐17 regulatory period
Return on regulatory asset base (RAB) $701.4 m, WACC 7.87%
Depreciation on RAB $242.7 m
Forecast operating expense $591.1 m
Cost increments or decrements as a result of the efficiency benefit sharing
scheme (EBSS)
$39.4 m
Estimated cost of corporate tax $28.6 m
WACC components
Nominal risk free rate 4.31%
Equity beta 0.8
Market risk premium 6.5%
Debt risk premium 2.48%
Gearing level 60%
Inflation forecast 2.45%
Gamma 0.65
Nominal post‐tax cost of equity 9.51%
Nominal pre‐tax cost of debt 6.79%
4. KEY DISCREPANCIES BETWEEN SP AUSNET PROPOSAL AND AER FINAL DETERMINATION
Source: www.aer.gov.au
4
REGULATORY HIGHLIGHTS – SP AUSNET
Capex:
Prudency adjustment which reflects the Regulators expectation of continuous improvement in capex
delivery ($19.6 m reduction in capex)
Lower estimate of real cost escalators ($9 m reduction in capex)
Opex:
Overestimate of controllable opex of $37.4 m due to
Step changes proposed by SP AusNet already included in base opex in previous period
Method of estimate used to forecast ‘Asset Works’ opex.
SP AusNet’s proposed forecasts in $2013‐
2014
AER determined requirement
Forecast capex $542 m $513 m
Forecast opex $600 m $560 m
Regulatory outcomes have significant impact on:
1. Financial structure adopted by the participants;
2. Structuring on long term debt & equity investments;
3. Capital expenditure programs ( efficiently incurred); and
4. Management of regulatory asset base.
Long term cost of capital assumptions especially focussed on refinance assumptions and bidding of
refinance benefits to provide competitive advantage in bidding outcomes;
Management & protection of regulatory asset base especially pertaining to capex efficiently incurred
and appropriate understanding of regulatory imperatives of AER;
Appropriate use of debt structures that allow maximum flexibility and hedge to regulatory outcomes
thus lowering WACC for the bidders; and
Use of sophisticated debt profile & structures can provide outperformance for the bidders and thus a
benefit that can be used at the time of bidding or as excess return for equity.
SUMMARY IMPACTS
BIDDER CONSIDERATIONS – FOR REGULATED ASSETS IN NEM
5. 5
INFRASTRUCTURE – MARKET SNAPSHOT
TOTAL DEBT / EBITDA CAPEX / EBITDA
EBITDA MARGINEV / EBITDA
Company Ticker Market Capitalisation ( $'m) EV/EBITDA Capex / EBITDA Total Debt / EBITDA
12m Prior Current Change
AusNet Services AST 4,402.6 4,853.7 10.2% 10.8x 0.8x 6.6x
APA Group APA 5,440.7 9,761.3 79.4% 17.2x 0.6x 5.6x
DUET Group DUE 2,644.9 3,689.4 39.5% 12.3x 0.6x 7.6x
Asciano Limited AIO 5,284.0 6,182.5 17.0% 9.6x 0.6x 3.7x
Qube Holdings Limited QUB 1,970.9 3,015.5 53.0% 14.7x 0.7x 2.0x
Aurizon Holdings Limited AZJ 10,942.9 10,344.5 (5.5%) 9.9x 0.7x 2.3x
Sydney Airport Limited SYD 9,042.2 11,435.6 26.5% 19.6x 0.3x 7.9x
Transurban Group TCL 10,771.2 17,421.6 61.7% 31.5x 0.1x 12.2x
China Merchants Holdings (International) Company Limited SEHK:144 9,317.7 12,083.9 29.7% 31.1x 0.9x 7.0x
DP World Limited DIFX:DPW 16,532.9 21,746.8 31.5% 17.4x 0.6x 4.2x
Public Joint Stock Company Novorossiysk Commercial Sea Port MICEX:NMTP 1,048.1 600.9 (42.7%) 2.9x 0.2x 3.4x
Shanghai International Port (Group) Co.,Ltd. SHSE:600018 17,419.8 32,434.8 86.2% 15.9x 0.0x 1.9x
Energy World Corp. Ltd. EWC 502.9 628.6 25.0% 10.4x 1.7x 4.8x
Origin Energy Limited ORG 15,780.6 12,512.5 13.8x 0.7x 6.4x
AGL Energy Limited AGL 8,414.9 9,775.2 16.2% 9.3x 0.5x 2.6x
Spark Infrastructure Group SKI 2,202.4 2,969.4 34.8% 13.7x 0.0x 3.3x
Matrix Composites & Engineering Limited MCE 114.4 70.9 (38.0%) 2.2x 0.3x 0.4x
UGL Limited UGL 1,058.9 249.7 (76.4%)
WorleyParsons Limited WOR 3,790.8 2,438.2 (35.7%) 6.7x 0.1x 2.5x
RCR Tomlinson Limited RCR 410.8 307.7 (25.1%) 4.9x 0.2x 1.4x
Downer EDI Limited DOW 2,091.1 1,873.5 (10.4%) 4.0x 0.5x 1.1x
0x
5x
10x
15x
20x
25x
30x
35x
AST
APA
DUE
AIO
QUB
AZJ
SYD
TCL
SEHK:144
DIFX:DPW
MICEX:NMTP
SHSE:600018
EWC
ORG
AGL
SKI
MCE
UGL
WOR
RCR
DOW
0%
10%
20%
30%
40%
50%
60%
70%
80%
90%
100%
AST
APA
DUE
AIO
QUB
AZJ
SYD
TCL
SEHK:144
DIFX:DPW
MICEX:NMTP
SHSE:600018
EWC
ORG
AGL
SKI
MCE
UGL
WOR
RCR
DOW
0x
2x
4x
6x
8x
10x
12x
14x
AST
APA
DUE
AIO
QUB
AZJ
SYD
TCL
SEHK:144
DIFX:DPW
MICEX:NMTP
SHSE:600018
EWC
ORG
AGL
SKI
MCE
UGL
WOR
RCR
DOW
0.0x
0.2x
0.4x
0.6x
0.8x
1.0x
1.2x
1.4x
1.6x
1.8x
AST
APA
DUE
AIO
QUB
AZJ
SYD
TCL
SEHK:144
DIFX:DPW
MICEX:NMTP
SHSE:600018
EWC
ORG
AGL
SKI
MCE
UGL
WOR
RCR
DOW
6. EAC Partners is an independent corporate advisory firm based in Sydney. Our services include Mergers and Acquisitions,
Divestments, Corporate Finance and Capital Raisings. Below is a brief snapshot of our recent experience:
6
EAC PARTNERS
RECENT TRANSACTION
Robbie Singh – Director
+61 2 9210 9995
robbie.singh@eacpartners.com.au
Greg Green – Associate
+61 2 9210 9998
greg,green@eacpartners.com.au
EAC Partners Pty Limited
Level 8, 56 Pitt St
Sydney NSW 2000
Australia
www.eacpartners.com.au
info@eacpartners.com.au
ABN:28 133 170 733
AFSL:341 332
Adani Abbot
Point Terminal
Advised on the AUD1.25Bn
refinance of AAPT
Advised on its USD150m maiden
USPP issue
Advised on its AUD100m 6 year
AMTN issue
Mundra Port
(Adani Group Entity)
Advised Mundra Port Pty Ltd on
its AUD 225 million 5 year
holding company senior secured
debt issue
Advised on an IPP transaction Advised on the acquisition of an
industrial minerals producer
Strategic review of two non‐core
assets
Advised on the divestment of
44% of the shares to Adexum
Capital
EAC Awards
EAC Partners received the 2014
award for “Best Boutique Advisory
Firm – Australia”
EAC Partners received the 2014
Award for “Divestment Advisory
Firm of the Year – Australia”