Health and medicine forum martire
•
1 j'aime•359 vues

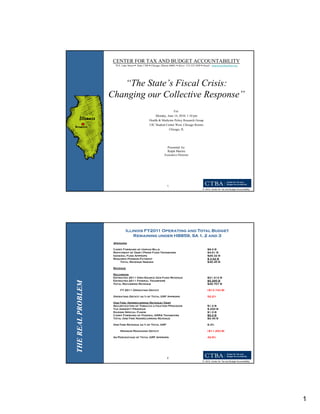
The document summarizes Illinois' fiscal crisis and budget challenges. It notes that Illinois faces a $13.7 billion operating deficit for FY2011, equal to 52.2% of its general revenue fund appropriations. To address this, Illinois relies heavily on one-time revenues like debt issuance, fund sweeps, and federal stimulus funds. Over the long term, Illinois has seen the loss of high-paying manufacturing jobs replaced with lower paying service jobs without benefits. This has contributed to economic problems and budget deficits that Illinois has struggled to adequately address through recurring revenues and spending priorities.

Recommandé
Recommandé
Contenu connexe
Tendances
Tendances (13)
En vedette
En vedette (7)
Similaire à Health and medicine forum martire
Similaire à Health and medicine forum martire (20)
Plus de Health & Medicine Policy Research Group
Plus de Health & Medicine Policy Research Group (19)
Dernier
Dernier (20)
Health and medicine forum martire
- 1. CENTER FOR TAX AND BUDGET ACCOUNTABILITY 70 E. Lake Street Suite 1700 Chicago, Illinois 60601 direct: 312.332.1049 Email: rmartire@ctbaonline.org “The State’s Fiscal Crisis: Changing our Collective Response” g g p For: Monday, June 14, 2010; 1:10 pm Health & Medicine Policy Research Group UIC Student Center West, Chicago Rooms Chicago, IL Presented by: Ralph Martire Executive Director 1 © 2010, Center for Tax and Budget Accountability Illinois FY2011 Operating and Total Budget Remaining under HB859, SA 1, 2 and 3 Spending Carry Forward of Unpaid Bills $6.0 B Repayment of Debt/Prior Fund Transfers $4.61 B General Fund Approps $26.32 B Required Pension Payment $ 3.52 B Total Revenue Needed $40.45 B Revenue Recurring Estimated 2011 Own Source Gen Fund Revenue $21.412 B Estimated 2011 Federal Transfers $5.295 B THE REAL PROBLEM Total Recurring Revenue $26.707 B FY 2011 Operating Deficit (-$13.743 B) Operating Deficit as % of Total GRF Approps 52.2% One-Time, Nonrecurring Revenue/Debt Securitization of Tobacco Litigation Proceeds $1.2 B Tax Amnesty Program $.250 B Raiding Special Funds $1.0 B Carry Forward of Federal ARRA Transfers $0.0 B Total One-Time Nonrecurring Revenue $2.45 B One-Time Revenue as % of Total GRF 9.3% Minimum Remaining Deficit (-$11.293 B) As Percentage of Total GRF Approps 42.9% 2 © 2010, Center for Tax and Budget Accountability 1
- 2. The Context: BIG ‘N RICH • In 2008, Illinois ranked fifth nationally with a Gross State Product in excess of $633 billion ILLINOIS’ ECONOMY (BEA). • That would be the 27th RGE largest economy of any nation in the world- IS LAR E greater than Egypt, Saudi E S Arabia, Colombia, Belgium, Sweden, Greece, Ireland, Portugal, Norway and Nigeria, to name a few. 3 © 2010, Center for Tax and Budget Accountability Illinois GDP Growth Lags But, IL Gross State Product Grew Less than U.S. or Midwest States, 1990-2007 THE ILLINOI ECONOMY 71.7% 80.0% 70.0% 60.0% 49.4% 48.1% 50.0% 40.0% IS 30.0% 20.0% 10.0% 0.0% US Midwest States Illinois Source: Bureau of Economic Analysis, US Dept. of Commerce 4 © 2010, Center for Tax and Budget Accountability 2
- 3. For over two decades now: Loss of high paying/good benefit jobs All job growth in Illinois came in the service sector. LOW-END SERVICE JOBS GROW For the most part, service sector jobs part G that pay less than manufacturing On average, most of these service jobs LOW- pay 29% less than the manufacturing jobs they replace 5 © 2010, Center for Tax and Budget Accountability Employer-provided health insurance benefits have been steadily declining in Illinois since 1980. ED By 2008, over 43% of OYER-PROVIDE the workforce didn’t have employer provided insurance BENEFITS Hispanics especially hard hit–over 57% do OYER- not have employer- provided insurance B EMPLO B 2009 30% of the By 2009, Illinois population is either on Medicaid or uninsured 6 © 2010, Center for Tax and Budget Accountability 3
- 4. Why the Economic and ongoing Deficit Problems—Not Wasteful Spending ATE? Category FY 2000 FY2000 FY2010 Difference FY2000 - Difference Actual Adjusted Enacted FY2000 - FY2010 FY2000 - IS ILLINO PROFLIGA to t FY2010 FY2010 ECI & FY2010 for CPI & CPI & Population ECI & Population Population Population General $21.294 B $29.551 Fund -Pension (- $1.230 B) (- $3.587) OIS General $20.064 B $26.608 $ 25.964 (-$644 M) $ 28.085 B (- $ 2.089 B) Fund/ Current Services 7 © 2010, Center for Tax and Budget Accountability Over $9 out of $10 of G.F. are spent on: • Education (k-12, (k-12 plus Higher Ed) 35% • Healthcare 30% • Human Services 21% • Public Safety 5% 91% 8 © 2010, Center for Tax and Budget Accountability 4
- 5. THE REAL IMPACT: $4.4 BILLION LOST Amount by Which Illinois General Fund State Spending on Human Service Programs Falls Short of Keeping Pace with Inflationary Costs and Population Growth From FY2002 to FY2010 $0 FY03 FY04 FY05 FY06 FY07 FY08 FY09 FY2010 ($168) ($100) ($393) ($384) ($377) ($200) ($413) ($454) ($434) ($457) ($300) ($270) (millions) ($400) ($33) ($68) ($105) ($500) By failing to account for annual inflationary costs, Illinois cut human service funding in real terms by ($145) ($310) a cummulative $3.1 B from FY2003 to FY2010. By ($186) ($235) failing to account for population growth, Illnois ($600) further shorted human service funding by approximately $1.4 B from FY2003 to FY2010. In total, state funding of human services over this period was approximately $4.4 B less than what ($700) was needed to maintain FY2002 service levels, adjusting for inflation and population growth. ($800) Note: Commission on Government Forecasting and Accountabiity, Budget Summaries for FY2002 to FY2010. Final General Revenue appropriations for the Illinois Departments of Aging, Children & Family Services, and Human Services. Appropriations shortfalls necessary to maintain real value of FY2002 appropriation based on Mid-West CPI (MWCPI). MWCPI for FY2010 is assumed to be 0%, in all likelihood understateng the shortfall. Population growth estimate from Illinois Department of Commerce and Economic Opportunity. Key: Red Bar - MWCPI Shortfall; Blue Bar - Population Adjustment Shortfall 9 © 2010, Center for Tax and Budget Accountability AS FOR HEALTHCARE, WELL……. Medicaid Spending by Funding Source (Federal, State and Local) $16 $13.9B $14 $12.5B $12 5B $12 $11.4B $10.5B $11B $6.6 $10 $9.6B $6.0 (billions) $5.5 $8 $5.5 $5.5 $4.5 $6 $2.9 $2.3 $2.1 $1.5 $1.7 $2.4 $4 $2 $3.8 $4.2 $4.4 $3.6 $3.3 $3.1 $0 FY2003 FY2004 FY2005 FY2006 FY2007 FY2008 State General Funds Other State and Local Contribution Federal Funds Data Source: National Association of State Budget Officers, Annual State Expenditure Reports. P.S. After inflation and population, own source revenue spending increased by just $42 M to $154 M over this five-year period. 10 © 2010, Center for Tax and Budget Accountability 5
- 6. • Why the Economic Problems? – NOT TAX BURDEN • Illinois’ total state AND local tax burden, ILLINO IS LOW TAX X as a percentage of personal income ranks only 46th in the nation (through 2007). OVERALL • This is the lowest comprehensive tax burden in the Midwest. OIS O • Illi i also ranks only 45th i state Illinois l k l in spending as a percentage of GDP among the states (BEA data). 11 © 2010, Center for Tax and Budget Accountability Education now matters more than ever to economic prosperity: TION EXHIBIT “A” IS EDUCAT Generally: unemployment rates are highest for those with the least education. “ The Change is Wages! 12 © 2010, Center for Tax and Budget Accountability 6
- 7. Wages for Minorities lag Whites Real wages for Whites increased modestly between 1980 and 2007, but : FERENCES The White-Hispanic wage gap is larger in amount, but increased by a smaller percentage, growing from $3.82 in 1980 to $5.34 in 2007, an increase of 39.7% over 1980 Real wages for African-Americans declined. The hourly wage gap between Whites and African- African WAGE DIFF Americans grew from $1.52 in 1980 to $3.44 in 2007, an increase of 126.3% over 1980 13 © 2010, Center for Tax and Budget Accountability Percentage of African-American Students in High and Low Poverty Schools RS RACE MATTER 60.0% 55.04% 50.0% 40.0% 30.0% 20.0% Highest Poverty districts Low est Poverty Districts 10.0% 1.28% R 0.0% 14 © 2010, Center for Tax and Budget Accountability 7
- 8. A SNAPSHOT OF WHAT IS ANCE Illinois State & Local Revenue • In 2007 (the most recent national comparison available), state and local PROPERTY TAX RELIA revenue came from the following sources: PROPERTY TAX 37.18% SALES TAX 16.6% EXCISE and Utilities TAXES 17.2% INDIVIDUAL INCOME TAX 17.1% OTHER 6.7% CORPORATE INCOME TAX 5.3% SOURCE: Federal Tax Administrators Data 15 © 2010, Center for Tax and Budget Accountability WHY – EDUCATION ANCE • Illinois ranks 49th out of 50 states in the portion of education funding PROPERTY TAX RELIA covered by state – versus local – revenuejust 28% of the cost. • Illinois is the most reliant state on property taxes to fund schools in the nation. (National Education Association Data) 16 © 2010, Center for Tax and Budget Accountability 8
- 9. Illinois Property Tax Revenue Growth vs. State Median Income Growth UGH” 60.0% 53.71% Property Tax Revenue Grow th 50.0% URDEN IS TOU State Median Income Grow th 40.0% 30.0% 23.21% 20.0% 10.0% 4.92% 0.0% “THE BU -10.0% -5.33% 1990-2007 2000-2007 17 © 2010, Center for Tax and Budget Accountability The Priorities Under HB859, SA 1, 2 and 3 1 Education $9.35 B $ 35% (K-12 $7.15B, 27%) (Higher Ed $2.18 B, 8%) PRIORITIES 2 Health Care (DPH & HFS) $7.068 B 27% 3 Human Services (DHS, Aging & DCFS) $3.436 B 13% 4 Public Safety $1.147 B 4% PR 5 Governor’s Discretionary Allocations $3.466 B 13% 18 © 2010, Center for Tax and Budget Accountability 9
- 10. Consider the Story for Education Category FY2000 FY2000 Adj FY2011 DIFF FY2000 Adj DIFF Actual to FY2011 Enacted to FY2011 CPI and ECI and Population Population K-12 Ed $5.542 B $6.347 B $7.150 B* $803 M $7.253 B (- $103 M) $6.550 B $203 M (-$703 M) Higher Ed $2.379 B $2.819 B $2.180 B (- $639 M) $3.322 B (-$1.042 B) -32% Human $4.599 B $6.025 B $3.436 B (- $2.589 B) $ 6.885 B (-$ 3.449B) Services -50.1% *Note, K-12 funding will be subject to a $600 M ‘hold back” in FY2011, that will result in a cut if the state does not pass new revenue. This increases the K-12 funding cut in FY2011 from 1.4% to 10%. 19 © 2010, Center for Tax and Budget Accountability OPENING ARGUMENT: OOK BAD IN 20 . . . Illinois' State FY2010 Budget Breakdown 010. APPROPRIATIONS $26.08 B* ONE-TIME, NONRECURRING REVENUES Debt Proceeds from issuance of five- $3.466 B year Pension Notes Federal Stimulus $1.966 B Fund Sweeps $ .352 B Debt Restructuring $ .475 B TOTAL NONRECURRING REVENUE $6.259 B** * Note: The FY2010 budget figure does NOT include at least $ $4.0 B in past due, unpaid bills carried forward from FY2009. The p , p THINGS LO Appropriation figure also does not include the $3.466 B in Pension Note proceeds used to fund state pensions though pension payments have historically been included in General Fund appropriations. **Note: That means over 21% of the $29.55 B FY2010 budget ($26.08 B plus $3.466 B in Pension Fund payments) is covered with one-time, nonrecurring revenues not available in FY2011. 20 © 2010, Center for Tax and Budget Accountability 10
- 11. Illinois FY2011 Operating and Total Budget Remaining under HB859, SA 1, 2 and 3 Spending Carry Forward of Unpaid Bills $6.0 B Repayment of Debt/Prior Fund Transfers $4.61 B General Fund Approps $26.32 B Required Pension Payment $ 3.52 B Total Revenue Needed $40.45 B Revenue Recurring Estimated 2011 Own Source Gen Fund Revenue $21.412 B Estimated 2011 Federal Transfers $5.295 B THE REAL PROBLEM Total Recurring Revenue $26.707 B FY 2011 Operating Deficit (-$13.743 B) Operating Deficit as % of Total GRF Approps 52.2% One-Time, Nonrecurring Revenue/Debt Securitization of Tobacco Litigation Proceeds $1.2 B Tax Amnesty Program $.250 B Raiding Special Funds $1.0 B Carry Forward of Federal ARRA Transfers $0.0 B Total One-Time Nonrecurring Revenue $2.45 B One-Time Revenue as % of Total GRF 9.3% Minimum Remaining Deficit (-$11.293 B) As Percentage of Total GRF Approps 42.9% 21 © 2010, Center for Tax and Budget Accountability WHAT SHOULD BE: ELEMENTS OF A SOUND AND FAIR FISCAL SYSTEM M FAIR PROGRESSIVE OG SS V D RESPONSIVE TO MODERN ECONOMY STABLE DURING POOR ECONOMIES EFFICIENT DOESN T DOESN’T DISTORT TS F PRIVATE MARKETS BUT ISN’T 22 © 2010, Center for Tax and Budget Accountability 11
- 12. WHICH CREATES: The Illinois Structural Deficit (How Revenue Growth Will Not Keep Pace With The Cost of Current Services) $49 Billion Revenue Expenditures CIT $44 Billion TURAL DEFICI $39 Billion $34 Billion $29 Billion STRUCT $24 Billion *Adjusts solely for historic rates of inflation and population growth, and assumes normal economic growth. 23 © 2010, Center for Tax and Budget Accountability Fair? Responsive? Income Growth in the United States 1979-1999 (Real 1999 Dollars) *Source U.S. Census Data TY INCOM INEQUALIT Percent Change e 100% 93.4% 80% 60% 50.20% 33.20 40% % ME 20% 5% 0% -20% -6% Next Top Top Top Bottom 60% 20% 20% 15% 1% 24 © 2010, Center for Tax and Budget Accountability 12
- 13. Illinois Tax Burden 2007 Income Lowest Second Middle Fourth Top 20% Group 20% 20% 20% 20% Next 15% Next 4% TOP 1% MORE REGRESSIVE E Income Less than $18,000 – $36,000 – $58,000 – $95,000 – $196,000 – $500,000 Range $18,000 $36,000 $58,000 $95,000 $196,000 $500,000 or more Average Income in Group $10,100 $26,600 $47,000 $74,700 $128,900 $300,700 $2,084,700 Sales & Excise Taxes 6.9% 5.5% 4.4% 3.6% 2.7% 1.7% 0.8% General Sales—Individuals 3.5% 3.0% 2.5% 2.2% 1.7% 1.1% 0.5% Other Sales & Excise—Ind. 1.7% 1.0% 0.7% 0.6% 0.4% 0.2% 0.1% Sales & Excise on Business 1.7% 1.4% 1.1% 0.9% 0.6% 0.4% 0.2% Property Taxes 4.8% 3.6% 3.7% 3.7% 3.9% 3.1% 1.5% Property Taxes on Families 4.7% 3.4% 3.6% 3.5% 3.7% 2.7% 0.6% Other Property Taxes 0.1% 0.2% 0.2% 0.2% 0.3% 0.3% 0.8% Income Taxes 1.2% 1.9% 2.3% 2.4% 2.4% 2.4% 2.6% E Personal Income Tax Ta 1.2% 1 2% 1.9% 1 9% 2.2% 2 2% 2.3% 2 3% 2.3% 2 3% 2.3% 2 3% 2.2% 2 2% Corporate Income Tax 0.0% 0.0% 0.0% 0.0% 0.1% 0.1% 0.4% TOTAL TAXES 13.0% 11.0% 10.4% 9.7% 9.0% 7.2% 4.9% Federal Deduction Offset –0.0% –0.1% –0.3% –0.5% –0.8% –0.7% –0.8% TOTAL AFTER OFFSET 13.0% 10.9% 10.1% 9.2% 8.2% 6.5% 4.1% Note: Table shows 2007 tax law updated to reflect permanent changes in law enacted through October 2009. 25 © 2010, Center for Tax and Budget Accountability INCOME TAX INCREASE 3% 5% SB750/HB174 4 3% 2% = 5% 2/3 = 67% *Note, corporate rate goes up from 4.8% to 8%, but―overall corporate tax burden goes down! 26 © 2010, Center for Tax and Budget Accountability 13
- 14. Revenues of Goods and Services as a Percent of Gross State Product: Illinois SE (SIC: 1965 - 1996, NAICS: 2007) 70% SALES TAX BAS 60% 60% 59% 50% 53% Services as a 40% 41% percent of GSP 36% Goods as a 30% percent of GSP 20% 32% 26% 20% 18% SA 10% 13% 0% 1965 1975 1985 1996 2007 Year 27 © 2010, Center for Tax and Budget Accountability For More Information: ation Center for Tax and Budget Accountability www.ctbaonline.org Further Informa Ralph M. Martire Executive Director (312) 332-1049 rmartire@ctbaonline.org Ron Baiman, Ph.D. Director of Budget and Policy Analysis (312) 332-1480 rbaiman@ctbaonline.org F Yerik Kaslow Research Associate (312) 332-2151 ykaslow@ctbaonline.org 28 © 2010, Center for Tax and Budget Accountability 14