Scaling API-first – The story of a global engineering organization
Gul
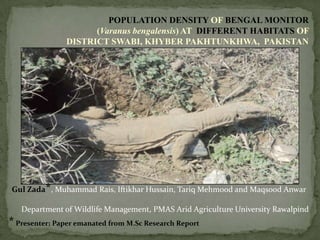
1. POPULATION DENSITY OF BENGAL MONITOR
(Varanus bengalensis) AT DIFFERENT HABITATS OF
DISTRICT SWABI, KHYBER PAKHTUNKHWA, PAKISTAN
Gul Zada*, Muhammad Rais, Iftikhar Hussain, Tariq Mehmood and Maqsood Anwar
Department of Wildlife Management, PMAS Arid Agriculture University Rawalpind
*Presenter; Paper emanated from M.Sc Research Report
2. INTRODUCTION
Bengal Lizard (Order: Squamata; Family: Varanidae; Genus:
VARANUS; Species: BENGALENSIS) is a well-known large-sized
lizard species in Pakistan.
73 species of Genus Varanus in Africa, Australia and Asia; Nine in
Asia; Four in South Asia (reptile-database.org).
The Genus Varanus is represented by three species in Pakistan
(Khan 2006).
Conservation Status: Least Concern ( as per IUCN redlist.org
accessed 18/04/2011).
Listed in Schedule III (Protected Animals) of KPK Wildlife Act
(1975) and KPK Wildlife Rule (1977) (Shafique, 2005).
3. Easily identifiable: Juveniles colorful with a series of yellow spots and
dark transverse bars on dorsal side. Adults have light brown or grey color
with dark spots.
Males have flaps near the vent that is formed by clusters of scales.
(Auffenberg, 1994 and Khan, 2006).
Lives in burrows/ crevices; Diurnal
Feeds on invertebrates such as, arthropods; also prey upon small
birds and their eggs, rats, frogs, fish and rotten flesh (Smith, 1930;
Murthy, 1978; Auffenberg, 1979 and Tikader, 1983).
Widely distributed in Pakistan in various habitats, but more
abundant in agricultural areas (Auffenberg et al. 1991 and Khan,
2006).
Hunted for pelt used in various products such as shoes and bags etc; eaten,
4. OBJECTIVE
To estimate density (number of individuals and burrows) of
Bengal Lizard at various habitat types viz. agriculture lands,
stream banks and muddy houses near human habitations.
OUTCOMES
Quantitative data on population will be gathered that could be
used to assess conservation status of lizards of Pakistan in
general and varanids in particular.
Baseline data will help design detailed ecological studies.
5. Study Area
Gangodher Village, Tehsil and District Swabi (34 7' 12" Latitude North,
72 28' 20" Longitude East), Khyber Pakhtunkhwa Province, Pakistan
Three sampling units were selected:
1. Zahir Shah Aratt,
2. PalosiKhwar and
3. Gangodher Kaly
An area of 20 square kilometer were surveyed within each sampling units.
Each sampling unit represented three distinct habitats viz. agricultural fields
(Wheat, Maize, Tobacco and Vegetables) , stream banks and muddy houses
(human habitations).
Population and Burrow Density was calculated by dividing number of
individuals/ burrows with the area.
Study Period: Eight months; March to November 2010.
Study Parameters: Population density and
Burrow Density
MATERIALS AND METHODS
7. Population Density: Fixed-width Line Transect
Number of individuals of Bengal Lizard were recorded along a line of
predetermined length and width viz. 400 meters and 25 meters (on either
side), respectively (Sutherland, 1996).
Area of Transect= Length X 2 Width
= 400 X 2 (25)= 20000 meter square
= 20 square kilometer
Burrow Count
Number of active and passive burrows were counted along the transects.
To differentiate passive from active burrows, openings of burrows were
covered with dry vegetation in the evening and were checked in the
subsequent morning.
Presence of foot prints, tail trails and removed vegetation indicated the
burrow was active.
SURVEY TECHNIQUE
8.
9. Agriculture Fields Stream Banks Muddy House
(Human Habitations)
Total
Number Population
Density
Number Population
Density
Number Population
Density
Number Population
Density
March 1 0.05 2 0.1 1 0.05 1.33 0.06
April 2 0.1 4 0.2 1 0.05 2.33 0.116
May 2 0.1 5 0.25 2 0.1 3 0.15
June 2 0.1 4 0.2 3 0.15 3 0.15
July 5 0.25 8 0.4 4 0.2 5.66 0.28
August 0 0 1 0.05 2 0.1 1 0.05
September 4 0.2 3 0.15 4 0.2 3.66 0.18
October 3 0.15 3 0.15 4 0.2 3.33 0.167
November 3 0.15 3 0.15 4 0.2 3.33 0.167
Total 2.4 0.122 3.37 0.183 2.78 0.139 2.96 0.149
Table 1: Number and Population Density of Bengal Lizard recorded from different
habitats during March, 2010 and November, 2010 from Zahir Shah Aratt , District Swabi
10. Agriculture Fields Stream Banks Muddy House
(Human Habitations)
Total
Number Population
Density
Number Population
Density
Number Population
Density
Number Population
Density
March 2 0.1 3 0.15 1 0.05 2 0.1
April 3 0.15 2 0.1 2 0.1 2.33 0.116
May 3 0.15 3 0.15 2 0.1 2.66 0.134
June 5 0.25 2 0.1 3 0.15 3.33 0.167
July 4 0.2 5 0.25 0 0.0 3 0.15
August 3 0.15 3 0.15 0 0.0 2 0.1
September 3 0.15 1 0.05 3 0.15 2.33 0.116
October 1 0.05 4 0.2 1 0.05 2 0.1
November 1 0.05 3 0.15 1 0.05 1.66 0.083
Total 2.78 0.138 2.89 0.144 1.45 0.072 2.37 0.119
Table 2: Number and Population Density of Bengal Lizard recorded from different
habitats during March, 2010 and November, 2010 from PalosiKhwar, Disttrict Swabi
11. Agriculture Fields Stream Banks Muddy House
(Human
Habitations)
Total
Number Population
Density
Number Population
Density
Number Population
Density
Number Population
Density
March 2 0.1 2 0.1 0 0.0 1.33 0.06
April 3 0.15 2 0.1 0 0.0 1.66 0.083
May 3 0.15 2 0.1 0 0.0 1.66 0.083
June 3 0.15 2 0.1 1 0.05 2 0.1
July 8 0.4 2 0.1 3 0.15 4.33 0.21
August 2 0.1 2 0.1 0 0.0 1.33 0.06
September 2 0.1 3 0.15 4 0.2 3 0.15
October 3 0.15 2 0.1 2 0.1 2.33 0.12
November 3 0.15 2 0.1 2 0.1 2.33 0.12
Total 3.22 0.16 2.11 0.105 1.33 0.06 2.22 0.11
Table 3: Number and Population Density of Bengal Lizard recorded from different
habitats during March,2010 and November, 2010 from Gangodher Kaly, Disttrict Swabi
12. Agriculture Fields Stream Banks Total
Active Passive Active Passive Active Passive
March 3 (0.15) 3 (0.15) 6 (0.3) 4 (0.2) 4.5 (0.22) 3.5 (0.17)
April 4 (0.2) 3 (0;15) 4 (0.2) 5 (0.25) 4 (0.2) 4 (0.2)
May 4 (0.2) 4 (0.2) 7 (0.35) 5 (0.25) 5.5 (0.27) 4.5 (0.22)
June 8 (0.4) 4 (0.2) 13 (0.65) 5 (0.25) 10.5 (0.52) 4.5 (0.22)
July 8 (0.4) 2 (0.1) 15 (0.75) 6 (0.3) 11.5 (0.57) 4 (0.2)
August 4 (0.2) 6 (0.3) 5 (0.25) 8 (0.4) 4.5 (0.22) 7 (0.35)
September 5 (0.25) 4 (0.2) 6 (0.3) 8 (0.4) 5.5 (0.27) 6 (0.3)
October 6 (0.3) 5 (0.25) 5 (0.25) 7 (0.35) 5.5 (0.27) 6 (0.3)
November 5 (0.25) 6 (0.3) 4 (0.2) 8 (0.4) 4.5 (0.22) 7 (0.35)
Total 5.22 (0.26) 4.11 (0.20) 7.22 (0.36) 6.22 (0.31) 6.22 (0.31) 5.1 (0.26)
Table 4: Burrow Number and Density of Bengal Lizard recorded from different habitats
during March, 2010 and November, 2010 from Zahir Shah Aratt, District Swabi
13. Agriculture Fields Stream Banks Total
Active Passive Active Passive Active Passive
March 4 (0.2) 4 (0.2) 7 (0.35) 6 (0.3) 5.5 (0.22) 5 (0.22)
April 7 (0.35) 5 (0.25) 8 (0.4) 10 (0.5) 7.5 (0.37) 7.5 (0.37)
May 7 (0.35) 4 (0.2) 7 (0.35) 2 (0.2) 7 (0.35) 7 (0.32)
June 8 (0.4) 4 (0.2) 15 (0.75) 5 (0.25) 11.5 (0.52) 4.5 (0.22)
July 9 (0.4) 3 (0.15) 14 (0.7) 5 (0.25) 11.5 (0.52) 4 (0.2)
August 4 (0.2) 6 (0.3) 5 (0.25) 5 (0.45) 4.5 (0.22) 5.5 (0.27)
September 4 (0.2) 4 (0.2) 6 (0.3) 7 (0.35) 5 (0.25) 5.5 (0.27)
October 4 (0.2) 5 (0.25) 4 (0.2) 7 (0.35) 4 (0.2) 6 (0.3)
November 3 (0.15) 5 (0.25) 5 (0.25) 7 (0.35) 4 (0.2) 6 (0.3)
Total 5.5 (0.27) 4.4 (0.22) 7.8 (0.39) 6 (0.3) 6.72 (0.33) 5.6 (0.28)
Table 5: Burrow Number and Density of Bengal Lizard recorded from different habitats
during March, 2010 and November, 2010 from PalosiKhwar, District Swabi
14. Agriculture Fields Stream Banks Total
Active Passive Active Passive Active Passive
March 3 (0.15) 5 (0.25) 3 (0.15) 7 (0.35) 3 (0.15) 6 (0.3)
April 7 (0.35) 7 (0.35) 7 (0.35) 5 (0.25) 7 (0.35) 6 (0.3)
May 8 (0.4) 6 (0.3) 8 (0.4) 4 (0.2) 8 (0.4) 5 (0.22)
June 7 (0.35) 4 (0.2) 6 (0.3) 4 (0.2) 7.5 (0.37) 4 (0.2)
July 7 (0.35) 3 (0.15) 8 (0.4) 4 (0.2) 7.5 (0.37) 3.5 (0.17)
August 2 (0.1) 6 (0.3) 1 (0.15) 11 (0.5.5) 1.5 (0.075) 8.5 (0.42)
September 4 (0.2) 7 (0.35) 5 (0.25) 10 (0.5) 4.5 (0.22) 8.5 (0.42)
October 4 (0.2) 7 (035) 5 (0.25) 10 (0.5) 4.5 (0.22) 8.5 (0.42)
November 4 (0.2) 6 (0.3) 5 (0.25) 11 (0.5.5) 4.5 (0.22) 8.5 (0.42)
Total 5.11 (0.25) 5.6 (0.28) 5.33 (0.26) 7.33 (0.36) 6.22 (0.31) 6.5 (0.32)
Table 6: Burrow Number and Density of Bengal Lizard recorded from different habitats
during March, 2010 and November, 2010 from Gangodher Kaly, District Swabi
15. Muddy Houses Agriculture Fields Stream
Banks
Total
Zahir Shah Aratt 0.38* 0.12* 0.18 0.14
Palosi Khwar 0.07* 0.13* 0.14 0.119
Gangodher Kaly 0.06* 0.16* 0.1 0.11
District Swabi 0.50±0.43 0.13±0.01 0.14±0.02 0.123±0.008
Table 7: Population Density (Mean ± SE) of Bengal Lizard recorded from different habitats
of the selected sampling units of District Swabi from March, 2010 to November, 2010.
Agriculture Fields Stream Banks
Total
Active Passive Active Passive Active Passive
Zahir Shah Aratt 5.22 4.11* 7.22 6.22* 6.22 5.16
Palosi Khwar 5.55* 4.44 7.8* 6 6.72 5.6
Gangodher Kaly 5.11 5.66 5.33 7.33 5.22 6.49
District Swabi 3.62± 0.13 3.63± 0.47 4.80±0.74 4.68± 0.41 4.23± 0.44 4.25± 0.39
Table 8: Burrow Densities (Mean ± SE) of Bengal Lizard recorded from different habitats of
the selected sampling units of District Swabi from March, 2010 to November, 2010.
Pair of values marked with * in a row shows significant difference i.e. P<0.05
Population Density= Number of individuals per square kilometer
16. DISCUSSION
•No previous study on population status of the species in Pakistan.
•Large lizards account for over 50% of all lizards considered threatened
(IUCN, 1990).
•Bengal lizard (Varanusbengalensis) is quite predominant and occurs
throughout the Indian subcontinent (Smith, 1935; Murthy, 1978 and 1985;
Tikader, 1983;Auffenberg, 1986)
•Many populations of monitor lizards are threatened due to habitat
destruction and fragmentation (Pianka, 1969; Auffenberg, 1988; Branch,
1991).
•Members of genus Varanus, the monitor lizards are considered particularly
Vulnerable with all 37 species categorized as threatened or endangered by the
US Fish and Wildlife Service.
17. CONCLUSION
•Bengal Monitor (Varanus bengalensis) is a widespread and well
known large-sized lizard species in Pakistan.
•Using Fixed-width Line Transect Method density (number of
individuals and burrows) of Bengal Monitor at different habitats
viz. agriculture fields, bank streams and muddy houses near
human habitations in District Swabi, Khyber PakhtunKhwa were
recorded from March, 2010 to November, 2010.
•Average population densities (per square kilometer) recorded
from agriculture fields, bank streams and muddy houses were
0.13±0.01, 0.14±0.01 and 0.50±0.43 respectively.
18. •Densities of active burrows (per square kilometer) were
3.62 0.13 and 4.80 0.79 in agriculture fields and bank streams
respectively.
•Densities of passive burrows were 3.63 0.47 and 4.68 0.32 in
agriculture fields and bank streams respectively.
•Higher density of lizard and burrows along bank streams and
muddy houses reflected lizard’s habitat preference.
•Trapping of lizards and persecution by locals were recorded as
main threats to the species in the area.