Health Datapalooza 2013: HDC Affiliates Apps Demos - Involution Studios hGraph
•
0 likes•762 views

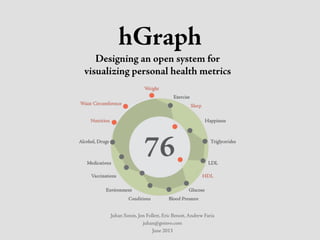
Health Datapalooza IV: June 3rd-4th, 2013 HEALTH DATA CONSORTIUM AFFILIATES APP DEMOS Monday June 3, 2013 • 4:30pm - 5:30pm Location: Regency Ballroom Moderator: Sunnie Southern, Founder and Chief Executive Officer, Viable Synergy, LLC; Ohio Health Data Affiliate hGraph is an open source information visualization which provides a complete overview of an individual’s health from an aggregated, high-level “how am I doing” status to detailed, metriclevel results and analysis. This single picture method can have a profound effect on a person’s understanding of his/her total well-being, because it compiles multiple metrics and inputs into a unified graph that can be viewed at a glance.

Recommended
Recommended
More Related Content
What's hot
What's hot (20)
Viewers also liked
Viewers also liked (18)
Similar to Health Datapalooza 2013: HDC Affiliates Apps Demos - Involution Studios hGraph
Similar to Health Datapalooza 2013: HDC Affiliates Apps Demos - Involution Studios hGraph (20)
More from Health Data Consortium
More from Health Data Consortium (20)
Recently uploaded
Recently uploaded (20)
Health Datapalooza 2013: HDC Affiliates Apps Demos - Involution Studios hGraph
- 1. hGraph Designing an open system for visualizing personal health metrics Juhan Sonin, Jon Follett, Eric Benoit, Andrew Faria juhan@goinvo.com June 2013
- 3. Cholesterol Check in 2006 I didn’t have a pulse on my health, let alone the data. How did I get into the Design of Health?
- 4. Cheese and salami was coursing through my blood stream (based on a meal the night before the cholesterol test…) 370 Total Cholesterol in 2006
- 5. I had no clue what my health metrics were. I had a better pulse on the health of my car.
- 6. and the Problem is… Increasingly complex systems – Tool and Methodology gap Decision makers are swamped with conflicting data – Our work is increasingly multi-dimensional (not a flat-decision space) Artifacts driving decisions need to be coordinated, presented Minimal transparency into key health metrics
- 7. How do I (as a patient, nurse, doctor, proxy) make quicker, more accurate decisions?
- 8. How do I become an informed and empowered patient?
- 9. HealthCard was born Prototyped with doctors, nurses, emergency responders… and oh yea, with patients.
- 10. System view of my family’s health
- 11. Outcomes Explore + test new concepts – Clinical R&D Project Laika, hData – Designing a beautiful + clinically relevant experience without beautiful data = recipe for disaster – e data standards game w/CCHIT + HL7 Strengthened collaboration – Federal agencies (HHS) – Non-profit orgs (CCHIT, HIMSS) – On-campus Clinics
- 12. Clinical and Patient Software Compelling, standardized visual representations of a patient’s health status…on the celltop Designed to increase awareness of the individual’s factors that can affect one’s health Open source healthcare application Created for mobile devices, starting with the iPhone and iPad Your health in one picture Users provide, view, share, and understand a holistic view of their health Based on an individual’s health data, identifies where an individual’s health numbers are, and where they should be Patient focused, with professional clinical relevance hScore Single aggregated number ranging from 1-100 that represents best knowledge status of an individual’s health Experimental measure correlated with statistical data from open sources
- 22. hGraph Target Ranges Guidance for the individual health measures are based on citations from trusted healthcare experts
- 25. Primary care on corporate campuses Doctor as Life Coach philosophy Founders = open source and design nuts
- 27. Upcoming Tasks hScore Mixer (OSS) Seed health scoring data by trusted experts 29.Aug.13, v1“trusted” hScore by Clinicians, Experts++ hGraph v.02 (OSS) 6.Jun.13, view data, explore, 2 zoom levels hGraph in the field Productionized hGraph on Facebook campus by Fall 2013 225k person pilot for retail pharmacy chain in Aug.13
- 28. Flirt, Date, Commit 300 seconds to contribute a CSS cleanup ...commit code 1800 seconds and clean up js ...commit code 3600 seconds and clean up one, small aspect of visual design ...commit graphics and code http://www.hGraph.org
- 29. hGraph Juhan Sonin, Jon Follett, Eric Benoit, Andrew Faria juhan@goinvo.com June 2013 Designing an open system for visualizing personal health metrics Special thanks to: Ben Salinas, Harry Sleeper, Josh Rumbut, Matthew Madonna, Sarah Kaiser, Dhaval Karwa, Kimberly Chang, Robert Audroue, Dirk Knemeyer, Rob McCready