Application of Taguchi Parametric Technique for the Decrease in Productivity Loss (In Percentage) In an Industry

Now a day, working in industry is not as comfortable as in earlier times. The man power is decreasing day by day and new recruitment is not in same ratio as the persons leaving industries. This is turn increase the work load on employees which causes physical problems to employees and also decreases the productivity of worker. The purpose is to determine the optimum combination of three parameters like Worker weight, component weight and worker age for achieving minimum loss (in percentage) in productivity of worker. In order to meet the purpose in terms of productivity study will utilize Taguchi parameter optimization methodology. The study includes selection of parameters utilizing an orthogonal array, conducting experimental runs, data analysis, determining the optimum combination, verification finally the modeling of input parameters (worker weight, component weight and worker age), for a particular job work, for particular machine to minimize fatigue of worker and loss (in percentage) of productivity in industry.

Recommandé
Recommandé
Contenu connexe
Tendances
Tendances (20)
En vedette
En vedette (20)
Similaire à Application of Taguchi Parametric Technique for the Decrease in Productivity Loss (In Percentage) In an Industry
Similaire à Application of Taguchi Parametric Technique for the Decrease in Productivity Loss (In Percentage) In an Industry (20)
Plus de IJMER
Plus de IJMER (20)
Dernier
Dernier (20)
Application of Taguchi Parametric Technique for the Decrease in Productivity Loss (In Percentage) In an Industry
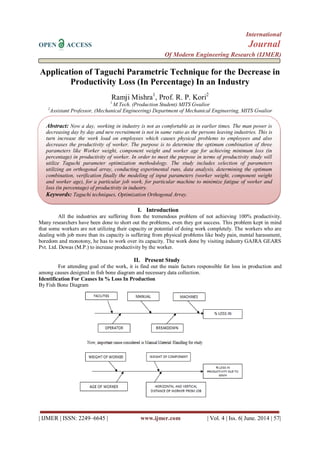
- 1. International OPEN ACCESS Journal Of Modern Engineering Research (IJMER) | IJMER | ISSN: 2249–6645 | www.ijmer.com | Vol. 4 | Iss. 6| June. 2014 | 57| Application of Taguchi Parametric Technique for the Decrease in Productivity Loss (In Percentage) In an Industry Ramji Mishra1 , Prof. R. P. Kori2 1 M.Tech. (Production Student) MITS Gwalior 2 Assistant Professor, (Mechanical Engineering) Department of Mechanical Engineering, MITS Gwalior I. Introduction All the industries are suffering from the tremendous problem of not achieving 100% productivity. Many researchers have been done to short out the problems, even they got success. This problem kept in mind that some workers are not utilizing their capacity or potential of doing work completely. The workers who are dealing with job more than its capacity is suffering from physical problems like body pain, mental harassment, boredom and monotony, he has to work over its capacity. The work done by visiting industry GAJRA GEARS Pvt. Ltd. Dewas (M.P.) to increase productivity by the worker. II. Present Study For attending goal of the work, it is find out the main factors responsible for loss in production and among causes designed in fish bone diagram and necessary data collection. Identification For Causes In % Loss In Production By Fish Bone Diagram Abstract: Now a day, working in industry is not as comfortable as in earlier times. The man power is decreasing day by day and new recruitment is not in same ratio as the persons leaving industries. This is turn increase the work load on employees which causes physical problems to employees and also decreases the productivity of worker. The purpose is to determine the optimum combination of three parameters like Worker weight, component weight and worker age for achieving minimum loss (in percentage) in productivity of worker. In order to meet the purpose in terms of productivity study will utilize Taguchi parameter optimization methodology. The study includes selection of parameters utilizing an orthogonal array, conducting experimental runs, data analysis, determining the optimum combination, verification finally the modeling of input parameters (worker weight, component weight and worker age), for a particular job work, for particular machine to minimize fatigue of worker and loss (in percentage) of productivity in industry. Keywords: Taguchi techniques, Optimization Orthogonal Array.
- 2. Application Of Taguchi Parametric Technique For The Decrease In Productivity Loss (In | IJMER | ISSN: 2249–6645 | www.ijmer.com | Vol. 4 | Iss. 6| June. 2014 | 58| Material handling includes following activities lifting, holding, pulling, carrying or moving of load. Manual material handling includes pushing, pulling, carrying, lifting and lowering. It includes lifting boxes at packaging lines. Negative Health Effects of Manual Material Handling Cuts, brushes, fractures due to sudden, unexpected events such as accident. Damage to musculoskeletal system of body as a consequence of gradual and cumulative wear and tear through repetitive manual handling. Advantages Of Well Designed MMHS – (1)Improve efficiency of production by ensuring right quantity of materials at right place at right time. (2)Cut down indirect labor cost. (3)Reduce damage of materials during storage and movement. (4)Improve customer service for a manner convenient for handling. Contribution of Organization Study of process in turning department in GAJRA GEAR. Identification of Taguchi methodology, for method refer to parameter design, design of experiments using orthogonal array and to evaluate measuring system. Implementation of procedure and steps of Taguchi parameter design. Analyzing the results and determining the combination of selected parameters. III. Research Methodology Taguchi Technique “The Father of Quality Engineering” introduced the concept of offline quality control techniques known as Taguchi parameter design. It is reported that thousand of engineers have performed tens of thousands of experiment based on teaching Taguchi method is statistical tool, adopted experimentally to investigate influence of product such as weight of worker, weight of component and age. Thus it helps to determine right person on right machine by optimizing the available factors. Thus Taguchi design is used to optimize design for performance quality and cost. Taguchi method is efficient method for designing process that operates and over a variety of conditions. Taguchi approach is easy to adopt and may be applied with limited knowledge of statistics, the engineering and scientific community. Taguchi Philosophy – (a) Achieving high system quality levels requires quality to be designed to the product. (b) Quality losses defined as deviation from target not conformance to arbitrary specification. (c) Quality is best achieved by minimizing deviation from a target. Signal to Noise Ratios (S/N Ratios) Taguchi recommends the use of the criterion he calls, “Signal to noise ratio” as performance statistic. The change in quality characteristic of a product under investigations in response to factor induced in the experimental design is the signal of the desired effect. The effect of external affairs (Uncontrollable factors) on the outcome of the quality characteristic under test is termed the noise. The signal to noise ratio measures the sensitivity of the quality characteristic being investigated in controlled manner, to those external influencing factors not under control. The S/N ratio is basically a transformed figure of merit, created from the loss function. To use the loss function as figure of merit an appropriate loss function with its constant value must first be established which is not always cost effective and easy. Taguchi recognizes that dilemma early in the development of his methodologies and created the transform of the loss function, which is named S/N ratio. From the quality point of view, there are three possible categories of quality characteristic. They are: 1. Smaller the better. 2. Nominal is the best. 3. Larger is better.
- 3. Application Of Taguchi Parametric Technique For The Decrease In Productivity Loss (In | IJMER | ISSN: 2249–6645 | www.ijmer.com | Vol. 4 | Iss. 6| June. 2014 | 59| The S/N ratio is computed from the mean sqaure deviation (MSD) by the equations: S/N=-10log10 (MSD) -------- (i) For the S/N ratio to be large, MSD must have a value that is small. If smaller is the best quality characteristic; MSD=-[(Y1 2 +Y2 2 + ------------- +Yn 2 )]/N -------- (ii) Where, Y1, Y2 --------------- Yn are the quality characteristic. If nominal is the best quality characteristic; MSD=-[(Y1-Y0)2 +(Y2 -Y0 )2 ------- (Yn-Y0)2 ]/N ------(iii) Where, Y0= Target or nominal value If larger is the best quality characteristic; MSD=-[(1/Y1 2 +1/Y2 2 +------- +1/Yn 2 )]/N ------(iv) The S/N ratio analysis is designed to measure quality characteristic. This is Taguchi‟s solution to Robust Product or Process Design. Taguchi Design And Analysis As to process design stage, the analysis of processing sequences, the selections of production equipment, tentative process parameter values, etc. are involved. Since system design is an initial functional design, it may be far from optimization in term of quality and cost. Following on from system design is parameter design. The objective of parameter design is to optimize the setting of the process parameter value for improving quality characteristics and to indentify the product parameter values under the optimal process parameter values. In addition, it is expected that the optimal process parameter values obtained from parameter design are insensitive to variation in the environmental conditions and other noise factors. Finally, tolerance design is used to determine and analyze tolerance around the optimal settings recommended by the parameter design. Steps of Taguchi Parameter Design Step-1: Selection of the quality characteristic There are three types of quality characteristic in the Taguchi methodology, such as smaller-the-better, larger the-better, and nominal-the-best. Step-2: Selection of noise factors and control factors In this step, the controllable factors are Weight of worker (A), Weight of component (B) and age (C), which were selected because they can potentially affect the productivity. Since these factors are controllable in the production process, they are considered as controllable factors in the study. Step-3: Selection of Orthogonal Array There are 9 basic types of standard Orthogonal Arrays (OA) in the Taguchi parameter design (Genichi Taguchi And Yu-in Wu, 1979). An L9 Orthogonal Array is selected from Appendix B, 2nd edition, 2005, Taguchi Techniques for quality Engineering, Philip J Ross 20 , Tata McGraw-Hill Publishing Company limited, for this study. Step-4: Conducting the experiments After the data were collected and recorded, signal-to-noise ratios of each experimental run were calculated based on the following equation, which are listed below S/N RATIO (Hi) = - 10 Log10 [MSD] ------------- (v) Where, MSD=[Y1 2 +Y2 2 + -----------------Yn 2 ]; n=3 The average response values were also calculated and recorded Step-5: Analyzing the results and determining the optimum cutting conditions (a) Analysis of Raw Data and S/N Ratios (b) Determination of the Optimum Factor-Level Combination Step-6: Predicting Optimum Performance Using the aforementioned data, one could predict the optimum combination of Worker weight, component weight, and age using the different worker, component, age combination. With this prediction, one could conclude that which combination will creates the minimum loss in target achievement within the range of specified combinations of the variables.
- 4. Application Of Taguchi Parametric Technique For The Decrease In Productivity Loss (In | IJMER | ISSN: 2249–6645 | www.ijmer.com | Vol. 4 | Iss. 6| June. 2014 | 60| Step-7: Establishing the design by using a confirmation experiment The confirmation experiment is very important in parameter design, particularly when screening or small fractional factorial experiments are utilized. The purpose of the confirmation experiment in this study was to validate the optimum welding conditions. Advantages (i) Consistency in experimental design and analysis. (ii) Measurement of quality in terms of deviation from the target (loss functions). (iii) Up-front improvement of quality by design and process development. (iv) Reduction of time and cost of experiments. Limitations (i) The technique can only be effective when applied early in the design of the product/process. (ii) The technique needs knowledge and training. Most severe limitations of the technique are the need for timing with respect to product/process development. IV. Experimental Setup Selection of Ranges & Levels of Process Variables The experimental setup is constructed for the various factors and their levels are chosen, which are dependent on Weight of Worker Weight of job/component Age of the workers. Weight of the worker Different persons have different weight. So they can be arranged in intervals. Selection of Ranges for Weight is as follows: L = (40-55) Kg M = (55-70) Kg H = (70-85) Kg Weight of Components The second parameter is Weight of Components and it has three levels. The three levels are low, medium and high. L = Lower Level = (2-6) Kg M = Medium Level = (6-10) Kg H = High Level = (10-15) Kg Age of Workers Different persons have different ages but we use here three levels called three age parameters such as L, M and H. L type of person are lower age persons and having high strength. M type of person is of middle age and middle strength category and the other belongs to higher age person and having lower strength. L = Lower Age = (30-40) M = Middle Age = (40-50) H = Higher Age = (50-onwards) V. Conclusion And Future Scope By the application of Taguchi Methodology and Mathematical Regression Modeling the researcher has find out a formula in order to find out that for a fixed percentage loss in productivity, which operator has to assign in which machine so that the maximum utilization of an operator could be possible. Summary of the Work The researcher has first visited to the company i.e., GAJRA GEAR, DEWAS, M.P., there in the company the researcher found that a critical phase is there that an appropriate worker is not appoint to the proper machine, due to which the operator has to suffer from many physical problems such as low back pain, monotony etc.,
- 5. Application Of Taguchi Parametric Technique For The Decrease In Productivity Loss (In | IJMER | ISSN: 2249–6645 | www.ijmer.com | Vol. 4 | Iss. 6| June. 2014 | 61| This gives the researcher a motivation to compute a formula so, that an operator can be appointed to a proper machine where the person gives maximum efficiency and low productivity loss. The Mathematical Regression Modeling has been implemented to find out the formula for the percentage loss of an operator if all his physical attributes and component weight are known. So, that it is concluded whether the operator is assigned to a proposed machine or not. The formula obtained is Here, Y= the percentage loss in productivity Ww= Weight of Worker, Wc = Weight of component. VI. Contribution After finding out the problem of % loss in productivity. The researcher go through the optimization technique of Taguchi Method of optimizing parameters in order to overcome the problem of % loss in productivity. A mathematical regression modeling has been done to obtain a formula by which it can be suggested that which operator should appoint to which machine so, as to get maximum productivity by minimizing the losses. VII. Future Scope Presently the researcher has applied the technique of Taguchi in a single Department i.e., Turning Deptt. In the company. In future the work can be extended for all over the company. REFERENCES [1.] U.S. Department of Labor, Bureau of Labor Standards, “Safety in Industry, Mechanical and Physical Hazards Series: Teach Them to Lift,” Bulletin 110, Revised 1965. [2.] National Safety council, “Lifting, Carrying, Lowering Inanimate Objects,” Safety Education Data Sheet No.7 (Rev.), 1964 [3.] International Labor Office, “Maximum Permissible Weight to be carried by one worker,” Geneva, 1964. [4.] ASTM International, F-1166-88 (and rev. 2007), Standard Practice for Human Engineering for Marine Systems, Equipments and Facilities. [5.] Snook , Stover H., and Vincent M. Ciriello, “The Design of Manual Handling Tasks: Revised Tables of Maximum Acceptable Weights and Forces,” Ergonomics, Volume 34, No. 9, 1991. [6.] Kackar N. Raghu, (1985), “Off-line Quality Control Parameter Design & Taguchi Method” Journal of Quality Technology, Vol. 17, No. 4, pp. 176-188. [7.] Mitchell. J.P., (June 1987), “Reliability of Isolated Clearance Defects on Printed Circuit Boards.” Proceedings of Printed Circuit World Convention IV, Tokyo, Japan, pp. 50.1-50.16 [8.] Phillip J Ross, (2005), „Taguchi Techniques for Quality Engineering” Tata Mc Graw Hill 2nd edition. [9.] Sathiya, P & Abdul Jaleel, May (2010), “Grey based Taguchi method for optimization Bead geometry in Laser Bead-on-Plate Welding”, Advances in Production Engineering & Management, 5(2010) 4 4,225-234, ISSN 1854- 6250. [10.] Dr. Saurav Datta, Prof. Siba Sankar Mahapatra & Prof. Asish Bandyopadhyay. (2010), “Elimination Joining Processes: Challenges for Quality, Design and Development, March 5-6, 2010 National Institute of Technology, Agartala, Tripura. Y=(Ww)C 1*(Wc)C 2* (Strength)C 3