Genetic differentiation of Ethiopian and Nigerian village chicken
•
0 j'aime•429 vues

1. The study examined genetic differentiation between village chicken populations in Ethiopia and Nigeria using genome-wide genotyping data from 52 samples across 14 populations. 2. Principal component and genetic relationship analyses separated Ethiopian and Nigerian chickens, with Ethiopian chickens showing more genetic variation. Some individuals occupied an intermediate position. 3. Incomplete genetic differentiation was observed between countries despite large geographical distances, possibly reflecting a common ancestry or recent commercial introgression. Higher variation within Ethiopian populations supports observed differentiation within countries.
Recommandé

Recommandé
Contenu connexe
Tendances
Tendances (18)
En vedette
En vedette (19)
Similaire à Genetic differentiation of Ethiopian and Nigerian village chicken
Similaire à Genetic differentiation of Ethiopian and Nigerian village chicken (20)
Plus de ILRI
Plus de ILRI (20)
Dernier
Dernier (20)
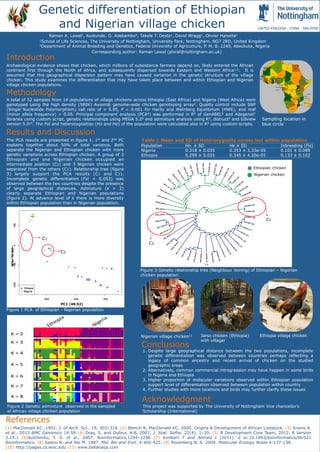
Genetic differentiation of Ethiopian and Nigerian village chicken
- 1. 1School of Life Sciences, The University of Nottingham, University Park, Nottingham. NG7 2RD, United Kingdom 2Department of Animal Breeding and Genetics, Federal University of Agriculture, P. M. B. 2240, Abeokuta, Nigeria Raman A. Lawal1, Ayotunde. O. Adebambo2, Takele T. Desta1, David Wragg1, Olivier Hanotte1 Introduction Archaeological evidence shows that chicken, which millions of subsistence farmers depend on, likely entered the African continent first through the North of Africa, and subsequently dispersed towards Eastern and Western Africa1,2. It is assumed that this geographical dispersion pattern may have caused variation in the genetic structure of the village chicken. This study examines the differentiation that may have taken place between and within Ethiopian and Nigerian village chicken populations. Methodology A total of 52 samples from 14 populations of village chickens across Ethiopia (East Africa) and Nigeria (West Africa) were genotyped using the high density (580K) Axiom® genome-wide chicken genotyping array3. Quality control include SNP (Single Nucleotide Polymorphism) call rate of > 0.95, P < 0.001 for Hardy and Weinberg Equilibrium (HWE), and maf (minor allele frequency) > 0.05. Principal component analysis (PCA4) was performed in R5 of GenABEL6 and Adegenet7 libraries using custom script, genetic relationships using MEGA 5.28 and admixture analysis using R5, distruct9 and GSview version 5.010. The Fst and heterozygosities (Ho and He) of the population were calculated also in R5 using custom scripts. Results and Discussion Figure 1 PCA of Ethiopian - Nigerian population Sampling area The PCA results are presented in figure 1. 1st and 2nd PC explains together about 50% of total variance. Both separate the Nigerian and Ethiopian chicken with more genetic variations across Ethiopian chicken. A group of 3 Ethiopian and one Nigerian chicken occupied an intermediate position (C2) and 3 Nigerian chicken were separated from the others (C1). Relationship tree (figure 3) largely support the PCA results (C1 and C2). Incomplete genetic differentiation (Fst = 0.053) was observed between the two countries despite the presence of large geographical distances. Admixture (k = 2) clearly separate Ethiopian and Nigerian populations (figure 2). At advance level of k there is more diversity within Ethiopian population than in Nigerian population. Nigerian village chicken11 Figure 3 Genetic relationship tree (Neighbour Joining) of Ethiopian – Nigerian chicken population Ethiopia village chicken (1) MacDonald KC .1992. J. of Arch. Sci., 19, 303–318. (2) Blench R, MacDonald KC. 2000. Origins & Development of African Livestock. (3) Kranis A. et al., 2013 BMC Genomics 14:59 (4) Dray, S. and Dufour, A.B. 2007. J. Stat. Softw. 22(4), 1–20. (5) R Development Core Team, 2012. R Version 2.15.1 (6)Aulchenko, Y. S. et al., 2007. Bioinformatics,1294–1296 (7) Jombart T and Ahmed I (2011). d oi:10.1093/bioinformatics/btr521 Bioinformatics. (8) Saitou N. and Nei M. 1987. Mol. Bio and Evol. 4:406-425. (9) Rosenberg N. A. 2004. Molecular Ecology Notes 4:137-138. (10) http://pages.cs.wisc.edu (11) www.bellanaija.com References Acknowledgment This project was supported by The University of Nottingham Vice chancellor’s Scholarship (International) Sampling location in blue circle Population Ho ± SD He ± SD Inbreeding (Fis) Nigeria 0.318 ± 0.035 0.353 ± 3.33e-05 0.101 ± 0.099 Ethiopia 0.299 ± 0.035 0.345 ± 4.20e-05 0.133 ± 0.102 Table 1 Mean and SD of Heterozygosity across loci within population K = 2 K = 3 K = 4 K = 5 K = 6 K = 7 K = 8 Figure 2 Genetic admixture observed in the sampled of African village chicken population Conclusions 1. Despite large geographical distance between the two populations, incomplete genetic differentiation was observed between countries perhaps reflecting a legacy of common ancestry and recent arrival of chicken on the studied geographic areas 2. Alternatively, common commercial introgression may have happen in some birds in Nigeria and Ethiopia 3. Higher proportion of molecular variations observed within Ethiopian population support level of differentiation observed between population within country 4. Further studies with more locations and birds may further clarify these issues Jarso chicken (Ethiopia) with villager Genetic differentiation of Ethiopian and Nigerian village chicken Corresponding author: Raman Lawal (plxral@nottingham.ac.uk) C1 C2 PC1 (49.52) P C 2 ( 5 .6 5 ) C1 C2 Ethiopian chicken Nigerian chicken 2.0