The role of risk management in pastoral policy evaluation and poverty reduction
•Télécharger en tant que PPT, PDF•
1 j'aime•927 vues

Presented by Leseeto Saidimu, ILRI, Nairobi, 16 August 2011
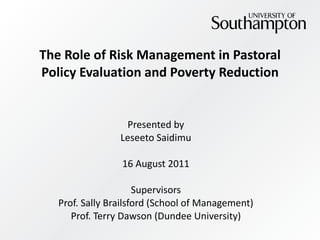
![The Role of Pastoral Economy 24% of national milk production . Over 90% Livelihood source for 1/3 for national population. Red meat comprise of 80% meat consumption out of which 67% produced in ASAL Supports tourism sector which contributes 11% of the GDP Role of Pastoral Rangelands Agriculture forms 21% of GDP in Kenya and supports 75% of national population. Livestock contributes 50% to Agriculture Indigenous livestock comprise of 75% Over 80% Of indigenous are Located in ASAL National Economy Arid and Semi-Arid Land (ASAL) accounts for 80% of Kenyan land mass. ,[object Object],[object Object],[object Object],[object Object],ASAL is exposed to high frequency , high impact climate variability Poverty Trap ASAL Primary Pastoral Economy The Role of Risk Management](data:image/gif;base64,R0lGODlhAQABAIAAAAAAAP///yH5BAEAAAAALAAAAAABAAEAAAIBRAA7)
Recommandé
Recommandé
Contenu connexe
Similaire à The role of risk management in pastoral policy evaluation and poverty reduction
Similaire à The role of risk management in pastoral policy evaluation and poverty reduction (20)
Plus de ILRI
Plus de ILRI (20)
Dernier
Dernier (20)
The role of risk management in pastoral policy evaluation and poverty reduction
- 1. The Role of Risk Management in Pastoral Policy Evaluation and Poverty Reduction Presented by Leseeto Saidimu 16 August 2011 Supervisors Prof. Sally Brailsford (School of Management) Prof. Terry Dawson (Dundee University)
- 3. Vulnerability Framework Vulnerability Measurements
- 4. Drought as Asset driver in Pastoral System Year Impact Inter-drought duration Livestock mortality & Area of Study Source 1979-1980 Severe 4 (1974/6) 50-70%,Turkana district 63% Cattle, 45% camels & 55% sheep and goats Ellis and Swift (1988) McCabe (1978;2004) 1984 Severe 4 years 50% in Baringo district 56%, Ethiopia (East African Country 69% Kenya Homewood & Lewis (1987); Angassa & Oba (2007); Oba (2001). 1987-1988 Mild 4 Years None established 1991-1992 Severe 4 years 50-60%,Garissa,Northern Kenya 86% Northern Kenya Angassa & Oba (2007); De Waal (1997); Oba(2001). 1997/8 Mild 5 years 40% Samburu, ILRI data, 2009. 1999-2000 Severe 2 years 50% cattle & 20% goats, Samburu district 53%, Ethiopia (E.A Country) Angassa & Oba (2007); McPeak & Little (2005).
- 9. Comparison of wellbeing risk indicators between normal and drought conditions. Observation: There is 10-50% change on the indicators from normal condition during droughts. Vulnerability Risk Indicators Wellbeing Measure Comparable Target Non-Drought Year Averages Drought Year Averages Financial Capital (Total Livestock Unit) ASAL TLU 10-16 TLU=9.52<Min TLU=8.04<Min Human Capital (Malnutrition rate) WHO 16.5% MUAC=16.9%>Max MUAC=24%>Max Physical Capital (Meat-Cereal Price Ratio) Equilibrium 100% MCPR=128%>E.C MCPR=88.9%<E.C Natural Capital (Rainfall mm) Equilibrium 33 pm Rain=38.8mm>E.C Rain=19.3mm<E.C Social Capital (Poverty Percentage) National Level 50% Poor=67.9%>Nat. Avg. Poor=73%>Nat. Avg.
- 10. Model Estimation Where Represents dependent variable for regions i , and time t . Is observed variables (independent variables) unobserved error term Is the subject specific residual and represents unmeasured individual factors which affects y (unknown intercept for each entity. NB: “If unobserved variable does not change over time, then any changes in the dependent variable must be due to influences other than these fixed characteristics” (Stock and Watson, 2003, p.289-290). Is the coefficient for the independent variables (slopes) Intercept (Model constant)
- 11. Pastoral Risks Decomposition Forms of Pastoral Capitals Financial (H2) Human (H3) Physical (H4) Social (H1) Natural Dependent Variables Total Livestock Units (TLU) Malnutrition (MUAC %age) Market Volatility (MCP Ratio) Poor Households (POOR) Pasture Condition (NDVI) Birth Rates-Cattle 0.004 (+) 0.267***(-) 0.869*** (+) Small Stock 0.142***(+) 0.136 (-) 0.551 (+) Mortality Rates- Cattle 0.062* (-) 0.297***(+) 2.057*** (-) Small Stock 0.010 (-) Camels 0.433 (-) Sales Rates-Cattle 0.323 (-) 2.375*** (+) 12.035*** (-) Small Stock 0.477***(-) 1.327*** (-) 2.919 (-) Pasture Condition-NDVI Lag 0 5.265* (-) 36.678***(-) 133.561***(+) 9.349 (+) NDVI-Lag 3 4.598 (+) 43.446***(-) 164.248***(+) 7.802 (-) NDVI-Lag 6 9.262***(+) 18.470** (-) 115.326***(+) 35.677*** (-) Livestock Asset Ownership-TLU 1.454***(-) 2.972** (+) 2.233*** (-) Market Condition-MCP Ratio 0.108***(+) 0.014 (+) Food Insecurity-MUAC %age 2.141*** (+) 0.194* (+) Mitigation Strategies-Relief Supply 0.053***(+) 0.295*** (-) Rainfall Variability- Rain Lag 0 0.0005*** (+) Rain Lag 1 0.0007*** (+) Rain Lag 2 0.0002** (+) Rain Lag 3 0.0001 (-) Constant 7.898 (+) 56.452 (+) 52.639 (-) 96.644 (+) 0.301 (+) R-Squared 0.671 0.785 0.821 0.712 0.645
- 12. Modelling and Management Mindset ALRMP Data Analysis System Dynamics Modelling Impact Status Change Climate Wellbeing Forms of Pastoral Capital Financial Human Physical Natural Social Indicator Variables Integrated Impact Response strategies by private and public sectors
- 13. Baseline Simulation Results Percentage of children at risk of malnutrition Test for data representation The actual data Versus simulation runs Possible Mitigation Strategies Scenario Wellbeing Livestock mortalities Financial-TLU Stable market prices Physical-MCP Destocking/Restocking Financial-TLU Food supplements Human-MUAC Education Human/Financial Reclamations/irrigation Natural-Rangeland Disease control Financial-TLU
Notes de l'éditeur
- Motivation for Fixed effects are OLS models consistently population average while correlation may exist within the period Fixed effects allows analysis of unbalanced data and missing periods, not dropped as OLS does Allows nesting between regions, months and years The objective is to generalise and trend the coefficient using SD Provides a better analytical and robust result for highly correlated data