Firstcall recommends Shilp Gravures for the mid- to long-term
•
1 j'aime•221 vues

Firstcall: Shilp Gravures is recommended for the mid- to long-term for a target of Rs57

Recommandé
Recommandé
Contenu connexe
Tendances
Tendances (20)
Similaire à Firstcall recommends Shilp Gravures for the mid- to long-term
Similaire à Firstcall recommends Shilp Gravures for the mid- to long-term (20)
Plus de IndiaNotes.com
Plus de IndiaNotes.com (20)
Dernier
Dernier (20)
Firstcall recommends Shilp Gravures for the mid- to long-term
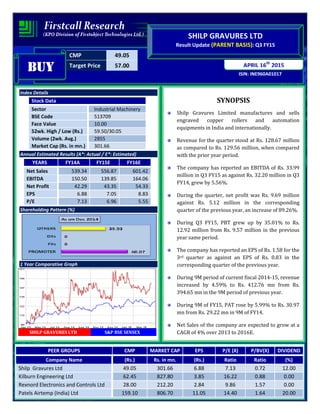
- 1. CMP 49.05 Target Price 57.00 ISIN: INE960A01017 APRIL 16th 2015 SHILP GRAVURES LTD Result Update (PARENT BASIS): Q3 FY15 BUYBUYBUYBUY Index Details Stock Data Sector Industrial Machinery BSE Code 513709 Face Value 10.00 52wk. High / Low (Rs.) 59.50/30.05 Volume (2wk. Avg.) 2855 Market Cap (Rs. in mn.) 301.66 Annual Estimated Results (A*: Actual / E*: Estimated) YEARS FY14A FY15E FY16E Net Sales 539.34 556.87 601.42 EBITDA 150.50 139.85 164.06 Net Profit 42.29 43.35 54.33 EPS 6.88 7.05 8.83 P/E 7.13 6.96 5.55 Shareholding Pattern (%) 1 Year Comparative Graph SHILP GRAVURES LTD S&P BSE SENSEX SYNOPSIS Shilp Gravures Limited manufactures and sells engraved copper rollers and automation equipments in India and internationally. Revenue for the quarter stood at Rs. 128.67 million as compared to Rs. 129.56 million, when compared with the prior year period. The company has reported an EBITDA of Rs. 33.99 million in Q3 FY15 as against Rs. 32.20 million in Q3 FY14, grew by 5.56%. During the quarter, net profit was Rs. 9.69 million against Rs. 5.12 million in the corresponding quarter of the previous year, an increase of 89.26%. During Q3 FY15, PBT grew up by 35.01% to Rs. 12.92 million from Rs. 9.57 million in the previous year same period. The company has reported an EPS of Rs. 1.58 for the 3rd quarter as against an EPS of Rs. 0.83 in the corresponding quarter of the previous year. During 9M period of current fiscal 2014-15, revenue increased by 4.59% to Rs. 412.76 mn from Rs. 394.65 mn in the 9M period of previous year. During 9M of FY15, PAT rose by 5.99% to Rs. 30.97 mn from Rs. 29.22 mn in 9M of FY14. Net Sales of the company are expected to grow at a CAGR of 4% over 2013 to 2016E. PEER GROUPS CMP MARKET CAP EPS P/E (X) P/BV(X) DIVIDEND Company Name (Rs.) Rs. in mn. (Rs.) Ratio Ratio (%) Shilp Gravures Ltd 49.05 301.66 6.88 7.13 0.72 12.00 Kilburn Engineering Ltd 62.45 827.80 3.85 16.22 0.88 0.00 Rexnord Electronics and Controls Ltd 28.00 212.20 2.84 9.86 1.57 0.00 Patels Airtemp (India) Ltd 159.10 806.70 11.05 14.40 1.64 20.00
- 2. QUARTERLY HIGHLIGHTS (PARENT BASIS) Results updates- Q3 FY15, Months Dec-14 Dec-13 % Change Net Sales 128.67 129.56 (0.69) PAT 9.69 5.12 89.26 EPS 1.58 0.83 89.26 EBITDA 33.99 32.20 5.56 Revenue for the quarter stood at Rs. 128.67 million as compared to Rs. 129.56 million, when compared with the prior year period. The company has reported an EBITDA of Rs. 33.99 million in Q3 FY15 as against Rs. 32.20 million in Q3 FY14. In the same period, net profit was Rs. 9.69 million against Rs. 5.12 million in the corresponding quarter of the previous year, an increase of 89.26%. The company has reported an EPS of Rs. 1.58 for the 3rd quarter as against an EPS of Rs. 0.83 in the corresponding quarter of the previous year. Break up of Expenditure Particulars Rs. Million Q3 FY15 Q3 FY14 % Change Cost of Material Consumed 32.27 34.33 -6% Employee Benefit Expense 35.64 33.78 6% Depreciation & Amortization Expense 15.67 16.44 -5% Cost of Spares consumed 7.81 9.25 -16% Other Expenditure 19.79 20.9 -5%
- 3. Segment Revenue COMPANY PROFILE Shilp Gravures Limited was founded in 1989 and is based in Ahmedabad, India. Shilp Gravures is India's pioneer and undisputed leader in Electro-Mechanical Engraving, with a substantial market share of the flexible packaging industry. Electro-Mechanical Engraving is a precision technology, and Shilp Gravures has assimilated the world's best equipment and infrastructure available in the field at its plant. The company has focused all its activities and quality pursuits around that core knowledge that at the end of it all, it is part of a marketing / branding exercise. Shilp Gravures Limited manufactures and sells engraved copper rollers and automation equipments in India and internationally. It offers gravure cylinders, such as electro-mechanically and mechanically engraved rollers, chemically etched rollers, and laser technology; flexo plate processing, base shell, pre-press, and embossing products; rubber sleeves and mandrills; solventless adhesives; and doctor blades for gravure printing. The company provides its products for use in various segments of gravure industry, such as flexible packaging, PVC flooring, artificial leather, specialty coatings, anilox rollers, decorative laminates, gift wrappers, fine text, labels, ceramic anilox rollers, embossing, and engraved screens. Plants Locations Pramukh Industrial Estate, Village Rakanpur, Taluka Kalol, Dist. Gandhinagar. Engineering Division: Raghuvir Industrial Estate, Nr. Kothari Cross Road, Village: Santej, Tal. Kalol, Dist. Gandhinagar. Plant of Subsidiary Raghuvir Industrial Estate, Nr. Kothari Cross Road, Village: Santej, Tal. Kalol, Dist. Gandhinagar.
- 4. FINANCIAL HIGHLIGHT (PARENT BASIS) (A*- Actual, E* -Estimations & Rs. In Millions) Balance sheet as at March 31, 2013A-2016E FY13A FY14A FY15E FY16E EQUITY AND LIABILITIES: Shareholders’ Funds: a) Share Capital 61.50 61.50 61.50 61.50 b) Reserves and Surplus 321.70 355.40 398.74 453.08 1) Sub Total Net worth 383.20 416.90 460.24 514.58 Non-Current Liabilities: a) Long-term borrowings 76.50 92.40 69.30 60.98 b) Deferred Tax Liabilities [Net] 51.90 56.60 58.30 60.63 c) Long Term Provisions 9.90 9.40 8.93 9.38 2) Sub Total - Non-Current Liabilities 138.30 158.40 136.53 130.99 Current Liabilities: a) Short-term borrowings 74.90 65.36 92.81 102.09 b) Trade Payables 49.00 44.30 57.59 65.65 c) Other Current Liabilities 32.30 40.71 44.78 48.36 d) Short Term Provisions 11.60 9.51 4.66 4.94 3) Sub Total - Current Liabilities 167.80 159.88 199.84 221.05 Total Liabilities (1+2+3) 689.30 735.18 796.61 866.61 ASSETS: Non-Current Assets: Fixed Assets i. Tangible Assets 406.33 489.90 504.60 534.87 ii. Intangible Assets 9.75 0.70 0.00 0.00 iii. Capital work-in-progress 1.23 3.20 2.56 2.82 a) Sub Total Fixed Assets 417.31 493.80 507.16 537.69 b) Non Current Investments 12.92 27.89 34.03 39.47 c) Long Term Loans and Advances 65.53 15.54 22.69 26.77 d) Other non-current assets 0.17 0.00 0.00 0.00 4) Non-Current Assets 495.93 537.23 563.87 603.93 Current Assets: a) Current Investments 0.18 0.18 0.20 0.22 b) Inventories 42.74 44.71 57.23 66.46 c) Trade Receivables 124.18 124.85 142.57 159.68 d) Cash and Bank Balances 10.57 10.21 13.48 15.90 e) Short Term Loans and Advances 15.70 18.00 19.26 20.42 5) Current Assets 193.37 197.95 232.74 262.68 Total Assets (4+5) 689.30 735.18 796.61 866.61
- 5. Annual Profit & Loss Statement for the period of 2013 to 2016E Value(Rs. mn) FY13A FY14A FY15E FY16E Description 12m 12m 12m 12m Net Sales 545.36 539.34 556.87 601.42 Other Income 2.91 4.55 7.32 7.69 Total Income 548.27 543.89 564.20 609.11 Expenditure -391.17 -393.39 -424.34 -445.05 Operating Profit 157.10 150.50 139.85 164.06 Interest -18.68 -22.47 -21.62 -22.92 Gross profit 138.42 128.03 118.24 141.15 Depreciation -62.21 -64.63 -62.95 -66.10 Profit Before Tax 76.21 63.40 55.29 75.05 Tax -21.29 -21.11 -11.93 -20.71 Net Profit 54.92 42.29 43.35 54.33 Equity capital 61.50 61.50 61.50 61.50 Reserves 321.73 355.39 398.74 453.08 Face value 10.00 10.00 10.00 10.00 EPS 8.93 6.88 7.05 8.83 Quarterly Profit & Loss Statement for the period of 30th June, 2014 to 31st Mar, 2015E Value(Rs. mn) 30-Jun-14 30-Sep-14 31-Dec-14 31-Mar-15E Description 3m 3m 3m 3m Net Sales 140.20 143.89 128.67 144.11 Other income 1.01 0.83 3.89 1.59 Total Income 141.21 144.72 132.56 145.71 Expenditure -101.59 -115.81 -98.57 -108.37 Operating profit 39.62 28.91 33.99 37.33 Interest -5.73 -5.25 -5.40 -5.24 Gross profit 33.89 23.66 28.59 32.10 Depreciation -15.75 -15.39 -15.67 -16.14 Profit Before Tax 18.14 8.27 12.92 15.96 Tax -4.41 -0.72 -3.23 -3.57 Net Profit 13.73 7.55 9.69 12.38 Equity capital 61.50 61.50 61.50 61.50 Face value 10.00 10.00 10.00 10.00 EPS 2.23 1.23 1.58 2.01
- 6. Ratio Analysis Particulars FY13A FY14A FY15E FY16E EPS (Rs.) 8.93 6.88 7.05 8.83 EBITDA Margin (%) 28.81% 27.90% 25.11% 27.28% PBT Margin (%) 13.97% 11.76% 9.93% 12.48% PAT Margin (%) 10.07% 7.84% 7.78% 9.03% P/E Ratio (x) 5.49 7.13 6.96 5.55 ROE (%) 14.33% 10.14% 9.42% 10.56% ROCE (%) 41.02% 37.44% 32.59% 33.96% Debt Equity Ratio 0.40 0.38 0.35 0.32 EV/EBITDA (x) 2.82 2.98 3.22 2.73 Book Value (Rs.) 62.31 67.79 74.84 83.67 P/BV 0.79 0.72 0.66 0.59 Charts
- 7. OUTLOOK AND CONCLUSION At the current market price of Rs.49.05, the stock P/E ratio is at 6.96 x FY15E and 5.55 x FY16E respectively. Earnings per share (EPS) of the company for the earnings for FY15E and FY16E are seen at Rs. 7.05 and Rs. 8.83 respectively. Net Sales of the company are expected to grow at a CAGR of 4% over 2013 to 2016E. On the basis of EV/EBITDA, the stock trades at 3.22 x for FY15E and 2.73 x for FY16E. Price to Book Value of the stock is expected to be at 0.66 x and 0.59 x respectively for FY15E and FY16E. We expect that the company surplus scenario is likely to continue for the next three years, will keep its growth story in the coming quarters also. We recommend ‘BUY’ in this particular scrip with a target price of Rs. 57.00 for Medium to Long term investment.
- 8. INDUSTRY OVERVIEW Capital goods and engineering turnover in India is expected to reach US$ 125.4 billion by 2017 from US$ 57.6 billion in 2012, while the electrical equipment market size is forecasted to touch US$ 105 billion by 2022 from US$ 24.2 billion in 2011. Also, the Indian telecom equipment market is expected to grow over two times by 2020. The Indian engineering sector is divided into two major segments - heavy engineering and light engineering. Indian engineering exports stood at US$ 62.3 billion in FY14 while it registered a compound annual growth rate (CAGR) of 10.8 per cent over FY08-14. Transport equipment is the leading contributor to engineering exports accounting for 32.5 per cent of the total engineering exports in FY13, followed by machinery and instruments with a share of 26.8 per cent. The Government of India has de-licensed the engineering industry and 100 per cent foreign direct investment (FDI) has been permitted in the sector. The government has also eliminated tariff protection on capital goods and reduced custom duties on a range of engineering equipment. It launched the National Manufacturing Policy with the aim of enhancing the sector's share in gross domestic product (GDP) to 25 per cent within a decade and creating 100 million jobs by 2022. With increasing demand for engineering goods in a number of sectors such as defence, civil nuclear and automobiles, the engineering industry in India have plenty of scope for growth in the years to come. Disclaimer: This document is prepared by our research analysts and it does not constitute an offer or solicitation for the purchase or sale of any financial instrument or as an official confirmation of any transaction. The information contained herein is from publicly available data or other sources believed to be reliable but we do not represent that it is accurate or complete and it should not be relied on as such. Firstcall Research or any of its affiliates shall not be in any way responsible for any loss or damage that may arise to any person from any inadvertent error in the information contained in this report. Firstcall Research and/ or its affiliates and/or employees will not be liable for the recipients’ investment decision based on this document.
- 9. Firstcall India Equity Research: Email – info@firstobjectindia.com C.V.S.L.Kameswari Pharma & Diversified U. Janaki Rao Capital Goods B. Anil Kumar Auto, IT & FMCG M. Vinayak Rao Diversified G. Amarender Diversified Firstcall Research Provides Industry Research on all the Sectors and Equity Research on Major Companies forming part of Listed and Unlisted Segments For Further Details Contact: Tel.: 022-2527 2510/2527 6077 / 25276089 Telefax: 022-25276089 040-20000235 /20000233 E-mail: info@firstobjectindia.com www.firstcallresearch.com