Sun Pharma Q2FY15: Buy on dips to 840-873
•
1 j'aime•249 vues

SPIL recently reported Q2FY15 results which were in line with expectations. Sales grew 13.3% to Rs. 4,750 crore led by 21% growth in Indian formulations and 15% growth in US sales. Net profit increased 15.4% to Rs. 1,572 crore due to improved operations and lower taxes. The company maintained its guidance of 13-15% revenue growth for FY15 and expects the Ranbaxy acquisition to be completed by December 2014, though some delays are possible. Investors are advised to buy on dips to Rs. 840-873 per share for a target of Rs. 924 over the next quarter.

Recommandé
Recommandé
Contenu connexe
Tendances
Tendances (14)
En vedette
Similaire à Sun Pharma Q2FY15: Buy on dips to 840-873
Similaire à Sun Pharma Q2FY15: Buy on dips to 840-873 (20)
Plus de IndiaNotes.com
Plus de IndiaNotes.com (20)
Dernier
Dernier (20)
Sun Pharma Q2FY15: Buy on dips to 840-873
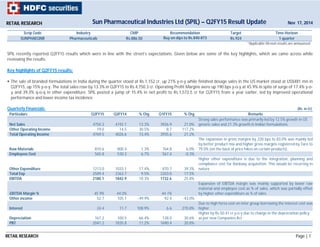
- 1. RETAIL RESEARCH Rs Sun Pharmaceutical Industries Ltd (SPIL) – Q2FY15 Result Update Nov 17, 2014 Scrip Code Industry CMP Recommendation Target Time Horizon SUNPHAEQNR Pharmaceuticals Rs.886.50 Buy on dips to Rs.840-873 band Rs.924 1 quarter *Applicable till next results are announced SPIL recently reported Q2FY15 results which were in line with the street’s expectations. Given below are some of the key highlights, which we came across while reviewing the results. Key highlights of Q2FY15 results: The sale of branded formulations in India during the quarter stood at Rs.1,152 cr, up 21% y-o-y while finished dosage sales in the US market stood at US$481 mn in Q2FY15, up 15% y-o-y. The total sales rose by 13.3% in Q2FY15 to Rs.4,750.3 cr. Operating Profit Margins were up 190 bps y-o-y at 45.9% in spite of surge of 17.4% y-o-y and 39.3% q-o-q in other expenditure. SPIL posted a jump of 15.4% in net profit to Rs.1,572.5 cr for Q2FY15 from a year earlier, led by improved operational performance and lower income tax incidence. Quarterly Financials: (Rs. in Cr) Particulars Q2FY15 Q2FY14 % Chg Q1FY15 % Chg Remarks Strong sales performance was primarily led by 12.5% growth in US Net Sales 4750.3 4192.1 13.3% 3926.9 21.0% generic sales and 21.3% growth in Indian formulations Other Operating Income 19.0 14.5 30.5% 8.7 117.2% Total Operating Income 4769.5 4026.6 13.4% 3935.6 21.2% Raw Materials 810.6 800.4 1.3% 764.8 6.0% The expansion in gross margins by 220 bps to 83.0% was mainly led by better product mix and higher gross margins registered by Taro to 79.0% (on the back of price hikes on certain products). Employees Cost 565.8 530.3 6.7% 567.4 -0.3% Other Expenditure 1213.0 1033.1 17.4% 870.7 39.3% Higher other expenditure is due to the integration, planning and compliance cost for Ranbaxy acquisition. This would be recurring in nature Total Exp 2589.4 2363.7 9.5% 2203.0 17.5% EBITDA 2180.1 1842.9 18.3% 1732.6 25.8% EBITDA Margin % 45.9% 44.0% 44.1% Expansion of EBITDA margin was mainly supported by lower raw material and employee cost as % of sales, which was partially offset by higher other expenditure as % of sales Other income 52.7 105.1 -49.9% 92.4 -43.0% Interest 24.4 11.7 108.9% 6.6 270.8% Due to high forex cost on inter group borrowing the interest cost was higher Depreciation 167.2 100.5 66.4% 128.0 30.6% Higher by Rs.50.41 cr y-o-y due to change in the depreciation policy as per new Companies Act PBT 2041.2 1835.8 11.2% 1690.4 20.8% RETAIL RESEARCH Page | 1
- 2. PBTM % 43.0% 43.8% 43.0% Tax 194.2 276.0 -29.6% 211.9 -8.3% Tax rate would be similar to FY14 Effective Tax Rate % 9.5% 15.0% 12.5% PAT 1847.0 1559.8 18.4% 1478.5 24.9% Minority Interest 274.5 197.5 39.0% 88.0 212.0% Minority interest rose in the quarter as Taro profitability improved Net Profit 1572.5 1362.3 15.4% 1390.5 13.1% Net Profit Margin % 33.1% 32.5% 35.4% Equity 207.1 207.1 0.0% 207.1 0.0% EPS 7.6 6.6 15.4% 6.7 13.1% (Source: Company, HDFC sec) Some observations on Q2FY15 results: Geographical Breakup of Consolidated Segmental Revenues: Particulars Q2FY15 Q2FY14 % Chg Q1FY15 % Chg Remarks India Formulations 1151.8 949.5 21.3% 992.3 16.1% As per AIOCD-AWACS report, the average industry growth was approximately 11% for Q2FY15. Six products were launched in the Indian market during Q2FY15. US Formulations 2911.8 2588.0 12.5% 2323.4 25.3% US formulations revenues continue the trajectory driven by Taro’s robust performance over shadowing the increased competition in Sun’s products ROW Formulations 536.2 492.4 8.9% 491.3 9.1% Total Formulations 4599.7 4029.8 14.1% 3807.1 20.8% Bulk 210.1 211.7 -0.7% 174.4 20.5% The flat sale was due to higher internal consumption. Others 6.2 -2.0 3.3 88.7% Total Sales 4816.0 4239.5 13.6% 3984.8 20.9% R&D Expenditure as % of Sales 6.5% 5.3% 6.5% Total R&D Expenditure 312.1 223.1 39.9% 257.2 21.3% Capital 20.2 12.3 63.8% 13.6 49.2% Revenue 291.9 210.8 38.5% 243.7 19.8% (Source: Company, HDFC sec) Other Highlights: SPIL is ranked 2nd and holds 5.4% market share in the highly competitive Indian Branded Generics market, as per latest AIOCD report. Overall, the company is ranked no. 1 based on share of prescriptions with 7 classes of specialists: psychiatrists, neurologists, cardiologists, ophthalmologists, orthopedicians, nephrologists and gastroenterologists. Branded generic sales in India at Rs.1152 cr, was up by 21% over Q2FY14. Taro sales in Q2FY15 were reported at US$251 mn, up 22% y-o-y. For H1FY15, sales were US$ 381 million, up by 6% over first half last year. The growth is driven by a hike in prices of key products, though sales volume has declined in the quarter. Net Profit stood at US$143 mn, up 49% y-o-y. Net profit for H1FY15 was at US$190 million, up by 22% over H1FY14. RETAIL RESEARCH Page | 2
- 3. Sales in the US were US$481 mn for Q2FY15, up by 15%, accounting for 61% of total sales. For the first half, sales were US$ 870 million recording a growth of 11%. The growth was led by Taro. Excluding Taro’s performance, the US business was muted. The moderate growth is mainly attributed to the high base effects caused by the launch of generic Prandin under exclusivity and better competitive positioning in doxycyline (generic Doxil). The quarter-on-quarter (Q-o-Q) performance during the quarter was affected due to the competition in genetic Cymbalta. Taro’s EBITDA was at USD 160mn (the highest-ever on a quarterly basis), with margin at 64%. Taro further benefitted from forex gains of USD 6mn, which helped PAT to grow by 49% to USD 143mn. Formulation sales in rest of the world (ROW) markets outside of India and US accounted for US$89 mn in Q2FY15, registering a growth of 12% (in US$ terms). ROW sales for the first half were US$ 171 million, growing at 7% (in US$ terms). Excluding ex-US Taro sales, underlying sales growth in US$ terms for Sun Pharma business in these markets was 18% for Q2FY15 and 10% for H1FY15. The API business has strategic importance for vertical integration on key products. A cumulative of 264 DMF / CEP applications have been made, with 177 approved so far. External sales of API reached Rs. 210 crores in Q2FY15, flat on y-o-y basis. For H1FY15, API sales reduced by 5% to Rs. 384 crores. The lower growth is mainly on account of increased captive consumption. SPIL reported Operating margins at 45.9% higher by 193 bps on y-o-y basis and by 177 bps q-o-q. Operating profit was up 18.3% y-o-y. The company filed 1 ANDA during the quarter and received the US FDA nod for four. SPIL has filed a comprehensive product offering in the US market with approved ANDAs for 354 products while filings for 130 products await US FDA approval, including 11 tentative approvals. In the H1FY15, ANDAs for 15 products were filed and 10 approvals were received. The total number of patent applications submitted now stands at 576 with 346 patents granted so far. Consolidated R&D expense for Q2FY15 was Rs.312 cr, or 6.6% of sales. For H1FY15, R&D spend was Rs.569 cr at 6.6% of sales. During the quarter, Sun Pharma entered into the worldwide licensing agreement for Merck’s novel monoclonal antibody candidate Tildrakizumab, MK-3222. The drug is currently in Phase III registration trials for the treatment of chronic plaque psoriasis, a skin ailment. Merck will receive the upfront payment of USD 80mn, followed by milestone payments and royalty income. Merck will continue to run the clinical development and regulatory activities, cost for which will be borne by Sun Pharma. SPIL has indicated at incurring an additional US$250mn on the molecule over a period of five years. The Psoriasis market in US is currently valued ~US$6-7bn. Management has also highlighted that the acquired molecule has a competitive advantage over other similar products currently in trials. The company received Form 483 observations, owing to non-compliance of cGMP, following a US FDA inspection. Management has responded to concerns raised by the US FDA and has implemented corrective action plan. The management continues to undertake remedial actions in light of adverse observation by the USFDA on its Halol facility (form-483s) and import alert on Karkhadi facility. However, no timeline could be given to get the resolution complete. Ranbaxy Acquisition - In April-2014, Sun Pharma proposed the acquisition of Ranbaxy Laboratories Ltd in an all-stock deal valued at an Enterprise Value of about US$ 4 billion. The swap ratio has been fixed at 0.8:1. The integration process of Ranbaxy is broadly as per schedule (expected to get complete by Dec 2014), but a minor RETAIL RESEARCH Page | 3
- 4. delay is not ruled out. The company has got clearances of stock exchanges, approvals of shareholders, clearances of competition commissions of various countries except India and USA. As the merger requires CCI and court’s sanction, a minor delay is not ruled out. Guidance: The management has guided for consolidated FY15 revenue growth of 13-15%, R&D spending at 6-8% of revenues, 25 ANDA filings targeted in US and capex of Rs.900 cr. The guidance takes in to account the higher base of FY14 as well the risks associated with increase in competition for some products. Guidance is at constant exchange rate and excludes the impact of the proposed acquisition of Ranbaxy pending the deal closure. The NPPA imposing pricing beyond the NLEM list will not impact SPIL significantly. Concerns Any product approval delays, unfavorable litigation outcomes, delay in Ranbaxy merger and potential future adverse inspections from USFDA could be key risks to SPIL’s growth. SPIL is impacted by forex fluctuations, as it exports more than 60% of its sales and has presence abroad through subsidiaries/other infrastructure. Growing portfolio of price increase-led/ shortages led earnings stream in US. Conclusion & Recommendation SPIL’s quarterly sales have risen by 13.3% to Rs.4,750.5 cr. SPIL’s revenue growth (ex Taro) slowed down, with Q2FY15 revenue growth slipping to 8.6%, the lowest in the past 18 quarters Domestic sales growth remained healthy, up by 21% y-o-y. Formulation sales in the US rose by 12.5% y-o-y and 25.3% q-o-q. Slower sales growth in its “Rest of the world” cluster also pulled down overall sales growth. The focus is now on the completion of the proposed merger with Ranbaxy Laboratories Ltd and how soon the merger’s intended benefits could reflect in earnings growth. The drugmaker, however, faces an uphill task in turning around Ranbaxy's business and fixing manufacturing quality issues that have resulted in several Ranbaxy plants being barred from exporting to the United States. While Doxil, SPIL's largest selling cancer drug in the US, continues to do well and has maintained its market share, sales could come under pressure, as rival Johnson & Johnson would come back in action. We expect Sun’s US revenues to pick up led by new launches which will also aid margins. The US base business remains in a high growth trajectory, thanks to the robust ANDA pipeline and continuing quest for niche and limited competition launches. SPIL is trading at a significant premium to its peers on a fairly consistent basis. This is due to the successful integration of productive acquisitions, product launches at the right time keeping in mind margins and return ratios, robust profitability margins and healthy return ratios despite higher cash component. RETAIL RESEARCH Page | 4
- 5. However the growth in PAT from hereon is not likely to be as exceptional as the CAGR of 47% between FY11 and FY14. However prospects of consolidating Ranbaxy’s business and potential turnaround could provide some positive surprises a few quarters down the line. At the same time any unforeseen delay in realising this could result in de-rating of the stock as it is priced to perfection. From H2FY15, R&D costs could rise further pressurizing the margins with MK-3222 development. In our Q1FY15 result update dated August 18, 2014, we had stated that investors can buy on dips to Rs.739-773 band (22-23x FY16E EPS) for a target of Rs 857 (25.5x of FY16E EPS) over the next 1 quarter. The stock made a low of Rs.748.15 on Sept 26, 2014 (thus entering our entry band) and made a high of Rs.932 on Nov 10, 2014, thus meeting our target price. We have maintained our FY15 and FY16 estimates following the price increase taken by Taro, robust US pipeline of new launches and sustained strong performance from the Indian formulations. Also as per the management, the supply side issue in the RoW would not be reflected in the coming quarters which give us confidence. Investors can buy the stock on dips to Rs.840-873 band (25.0- 26xFY16E EPS) for a target of Rs.924 (27.5xFY16E EPS) over the next one quarter. Financial Estimates: Particulars (Rs in Crs) FY11 FY12 FY13 FY14 FY15E FY16E Operating income 5729.1 8019.8 11238.9 16004.4 18613.7 20476.9 PBIDT 1958.1 3264.8 4967.3 7195.6 8495.4 9375.2 PBIDTM (%) 34.2% 40.7% 44.2% 45.0% 45.6% 45.8% Reported Profit after Tax 1816.1 2587.2 3008.1 3204.4 6414.9 6968.5 PATM (%) 31.7% 32.3% 26.8% 20.0% 34.5% 34.0% Adjusted Profit after Tax 1816.1 2587.2 3828.6 5721.8 6414.9 6968.5 PATM (%) 31.7% 32.3% 34.1% 35.8% 34.5% 34.0% Reported EPS 8.8 25.0 14.5 15.5 31.0 33.6 Adj EPS 8.8 25.0 18.5 27.6 31.0 33.6 *E-Estimates (Source: Annual Report, HDFC sec Estimates) Analyst: Zececa Mehta Email ID: zececa.mehta@hdfcsec.com RETAIL RESEARCH Tel: (022) 3075 3400 Fax: (022) 2496 5066 Corporate Office HDFC securities Limited, I Think Techno Campus, Building - B, "Alpha", Office Floor 8, Near Kanjurmarg Station, Opp. Crompton Greaves, Kanjurmarg (East), Mumbai 400 042 Phone: (022) 3075 3400 Fax: (022) 2496 5066 Website: www.hdfcsec.com Email: hdfcsecretailresearch@hdfcsec.com Disclaimer: This document has been prepared by HDFC Securities Limited and is meant for sole use by the recipient and not for circulation. This document is not to be reported or copied or made available to others. It should not be considered to be taken as an offer to sell or a solicitation to buy any security. The information contained herein is from sources believed reliable. We do not represent that it is accurate or complete and it should not be relied upon as such. We may have from time to time positions or options on, and buy and sell securities referred to herein. We may from time to time solicit from, or perform investment banking, or other services for, any company mentioned in this document. This report is intended for non-Institutional Clients This report has been prepared by the Retail Research team of HDFC Securities Ltd. The views, opinions, estimates, ratings, target price, entry prices and/or other parameters mentioned in this document may or may not match or may be contrary with those of the other Research teams (Institutional, PCG) of HDFC Securities Ltd. RETAIL RESEARCH Page | 5