Biofuels and other approaches for decreasing fossil fuel emissions
•
1 like•750 views


Recommended
Recommended
More Related Content
What's hot
What's hot (20)
Viewers also liked
Viewers also liked (7)
Similar to Biofuels and other approaches for decreasing fossil fuel emissions
Similar to Biofuels and other approaches for decreasing fossil fuel emissions (20)
More from Ivan Vera Montenegro
More from Ivan Vera Montenegro (17)
Biofuels and other approaches for decreasing fossil fuel emissions
- 1. Annals of Applied Biology (2005), 146:193–201 *Corresponding Author Email: david.powlson@bbsrc.ac.uk © 2005 Association of Applied Biologists 193 Biofuels and other approaches for decreasing fossil fuel emissions from agriculture D S POWLSON1 *, A B RICHE2 and I SHIELD2 1 Agriculture and Environment Division, 2 Plant and Invertebrate Ecology Division, Rothamsted Research, Harpenden, Herts AL5 2JQ, UK Summary Biofuels offer one method for decreasing emissions of carbon dioxide (CO2 ) from fossil fuels, thus helping to meet UK and EU targets for mitigating climate change. They also provide a rational option for land use within the EU that could be economically viable, provided that an appropriate financial and policy environment is developed. If 80% of current set-aside land in the UK were used for production of biomass crops for electricity generation, about 3% of current UK electricity demand could be met from this source. Considering possibilities for increasing yields and land area devoted to such crops over the coming decades, this could possibly rise to 12%. These estimates exclude consideration of developments in electricity generation which should increase the efficiency of conversion. Also, the use of combined heat and power units at local level (e.g. on farms or in rural communities) gives additional energy saving. Dedicated biomass crops such as willow, poplar, miscanthus, switchgrass or reed canary grass are perennials: in comparison with annual arable crops they would be expected to deliver additional environmental benefits. The elimination of annual cultivation should give a more stable environment, beneficial for farmland biodiversity. Some increase in soil organic matter content is likely, leading to some sequestration of carbon in soil and long-term improvements in soil quality. The impact on water quality may be positive as nitrate losses are small and a similar trend is expected for phosphate and pesticides. However, these crops may well use more water than arable crops so their impact on water resources could be negative – an issue for further research. Agricultural land can also be used to produce liquid fuels for use in transport. At present biodiesel can be produced from oilseed rape and ethanol from either sucrose in sugar beet or cellulose from virtually any plant material. In the short-term, liquid biofuels are an easy option as they require little change to either agriculture or transport infrastructure. However, their benefits for CO2 emissions are much less than for biomass used for generating electricity. It is therefore necessary to debate the priorities for land use in this context. Key words: Biofuels, emissions, miscanthus, switchgrass, reed canary grass, willow, poplar Introduction The Third Assessment Report of the Intergovernmental Panel on Climate Change (IPCC) concluded that there is now a discernable human influence on climate caused mainly by increasing emissions of greenhouse gases (IPCC, 2001). The UK Royal Commission on Environmental Pollution (RCEP) recommended cuts in greenhouse gas emissions of 60% of 1990 levels by 2050 (RCEP, 2000) and the UK government has set targets broadly in line with this. If challenging cuts in emissions, especially of carbon dioxide (CO2 ), are to be achieved all aspects of human activity, including agriculture, have to be assessed. Agriculture could contribute to emissions cuts in several ways including: 1. Decrease the use of fossil fuel or inputs having a large fossil fuel emission during their manufacture – includes fertilisers, agrochemicals and machinery; 2. Use some agricultural land to produce bioenergy crops to partially replace fossil fuels for electricity production, heating or transport; 3. Use existing agricultural crops as energy sources instead of their current use; 4. Utilise agricultural wastes for energy production; 5. Adopt management practices that cause sequestration of carbon (C) in soil or long- lived plants in order to remove it from the atmosphere; 6. Adopt management practices that decrease net emissions of trace greenhouse gases (mainly nitrous oxide and methane). This article concentrates on the opportunities for greater production of crops specifically grown as sources of renewable energy, particularly perennial grasses and short rotation coppice (SRC) of tree species. CO2 emissions associated with agricultural inputs are considered briefly. Possibilities for C sequestration and associated impacts on trace gases have been considered previously (Smith et al., 2001).
- 2. D S POWLSON ET AL.194 Types of Biofuel Crops Table 1 summarises information on the main biomass crops currently being considered as sources of material for electricity generation. In addition, oilseed rape can be grown specifically for production of biodiesel and ethanol can be produced from many different plant sources; these are considered later. Converting agricultural land to the production of tree crops (SRC of willow or poplar) or miscanthus represents a long-term commitment by the farmer or landowner. Establishment costs are high and it will be several years before the crops yield at their full potential. At present SRC is established by planting stem cuttings and miscanthus is established by the planting of rhizomes, both of which techniques are labour intensive and hence costly. However recent research has indicated the possibility of establishing miscanthus from seed (Christian et al., 2005). If this is possible in practice it would greatly decrease the cost of establishment. By contrast to SRC or miscanthus, the other perennial grasses have a low establishment cost as they are propagated from seed. With the tree crops, conversion of land back to conventional cropping will require significant effort due to the presence of stools and roots. Although miscanthus produces large rhizomes, experience in experimental plots indicates that their destruction by ploughing is not particularly difficult. At present yields of 12 t dry matter ha–1 of miscanthus are routinely achieved in the UK and there is scope for further improvement as discussed later. The relatively little research so far conducted with switchgrass and reed canary grass under UK conditions shows rather smaller yields than for miscanthus (Table 1) but this may be acceptable in view of the relative ease of establishment. Also, these grasses could be suitable for growing for shorter periods (e.g. 5 years) within more traditional rotations as opposed to the longer-term conversion required for the other crops. Yields of switchgrass in the USA have been in the range 0.9 to 34.6 t DM ha–1 (Pfeifer et al., 1990). It is estimated that willow SRC yields currently achieved in practice average about 7 t dry matter ha–1 . In part this is a result of the varieties being grown – yields of 12–14 t ha–1 are now being recorded in field experiments with the latest varieties. But it also reflects the fact that, in general, the poorest soils are used for willows. This is likely to be the trend for all energy crops under current economic conditions and is a point that should be borne in mind when making estimates of the quantities likely to be available. With the perennial grasses very few pest or disease problems have been encountered under UK conditions, though most experience so far has been on relatively small experimental plots. The possibility of greater problems if they were grown more widely cannot be excluded. The only serious pest encountered was double lobed moth (Apamea ophiogramma) on reed canary grass. With willow two serious problems have been identified: rust (Melampsora epitea) and willow beetle (Phratora vulgatissima and P. vitellinae). Much current research is directed towards identifying and utilising wider genetic sources of resistance to rust. Recent work at Rothamsted has led to the breeding of the first varieties with potential resistance to willow beetles and other invertebrates. The latest rust resistant varieties are frequently established in stands comprising a mixture of varieties so that the spread of the different pathotypes of the rust fungus is limited and, potentially, the breakdown in rust resistance will be delayed (McCracken & Dawson 2001). This is important as the stands are planted with the intention of maintaining production for 20 years or more. In general pesticide use is low with all biomass crops, except for herbicides to control weeds in the establishment years. Knowledge of the nutrient Table 1. Summary of information currently available on biomass crops in use or being researched in the UK Crop SRC Poplar (Populus spp.) SRC Willow (Salix spp.) Miscanthus (Miscanthus giganteus) Switchgrass (Panicum virgatum) Reed canary grass (Phalaris arundinacea) Current typical yield, t dry matter ha–1 7a 7a 12 10 8 Establishment time 3 years + 3 years + 3 years + 2–3 years + 1–2 years Pesticide requirements Low Low Low Low Very low Fertiliser requirements Low/medium Low/medium Low Very low Medium Agronomic knowledge Good Good Reasonable Low Low Establishment costs High High Very high Very low Very low Pest/disease problems ? Beetle Rust None serious None serious Possible insect pest problems Plantation longevity 20 years + 20 years + 20 years + ? 20 years + ?? 10 years + ?? Other issues Resistant to lodging Resistant to lodging Resistant to lodging a SRC Poplar and willow yields are estimates from farmers’ willow fields and represent the fact that many crops are grown on low grade land. Plot yields are greater (c. 10 t DM ha–1 )
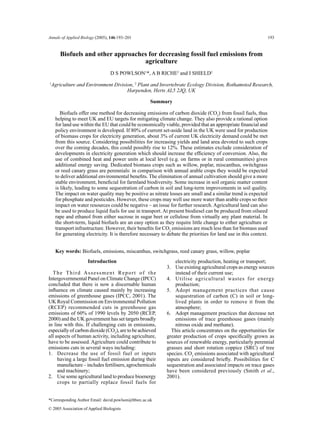
- 3. 195Approaches for decreasing fossil fuel emissions from agriculture requirements of all biomass crops is still limited but current research suggests that the requirement for fertilisers is low compared to most arable crops. Sustainability of Biomass Crop Yields Particularly for SRC or miscanthus, where establishment is costly and yields may be sub- optimal for the early years, it is essential that high yields of biomass continue for a prolonged period. At Rothamsted, miscanthus and switchgrass have both been grown continuously for at least 10 years with no indication of yields declining (Fig. 1).Yields of switchgrass varied considerably from year to year probably due to weather conditions, especially rainfall. The yields shown in Fig. 1 are for crops receiving no nitrogen (N) fertiliser. Other treatments did receive N (60 kg ha–1 for switchgrass, 60 and 120 kg ha–1 for miscanthus) but there was no yield response (Christian et al., 2002). These crops were established on land that had a long history of grass which was ploughed up 5 years earlier, so the soil was presumably mineralising more N than would be the case in old arable soil. It seems likely that at some point in the future N fertiliser will be required. In the USAabout 112 kg N ha–1 is normally recommended for switchgrass (http://www.extension.iastate.edu/ Publications/PM1866.pdf). For switchgrass and reed canary grass offtakes of P and K were about 5 and 20 kg ha–1 year–1 , respectively, in experiments at Rothamsted. These values are lower than for most arable crops; typical annual offtakes in winter wheat grain are 20–30 kg P ha–1 and 30–40 kg K ha–1 . Very little data has been published on the fertiliser requirements of SRC. Johnson (1999) reviewed the available data and drew up the guidelines adopted in the Defra Growers Guide (Defra, 2002). This recommends a minimum of 40 kg N ha–1 in the first year after cutback rising to 100 kg N ha–1 in the third year. However it is virtually impossible to apply fertiliser in the pre harvest year because the tree canopy fills the space between rows, hampering the entry of machinery. It is common practice to apply sewage sludge to the land following cutback or harvest. It is beneficial to apply sewage sludge to non-food crops grown in long rotations because, as opposed to crops entering the food chain, it is consistent with UK sludge disposal legislation and water company guidelines. Sewage sludge is a relatively slow release fertiliser that supplies N and also P and K to the crop over much of the harvest cycle. Hilton (2001) recommended applying sludge shortly after harvest at the maximum rate permitted for Good Agricultural Practice at the site (Defra, 1998; usually based on N inputs in view of nitrate leaching risk). This is because it is generally possible to apply sludge only once during a rotation, immediately after harvesting, when the land is clear of the tree canopy. How Much of UK Energy Requirement could be Met from Biofuel Crops? A recent estimate by the UK Department of Trade and Industry (DTI) was that a combination of willow and miscanthus could potentially supply 11.8% of UK electricity by 2020 (http://www. supergen-bioenergy.net/docs/03%20Shanahan%20- %20supergen%20conference%20010404.pdf). This assumed that 1 Mha of land would be devoted to these crops. If other biomass sources such as straw and wood wastes were included the figure rose to 16.6%. However, DTI recognised that constraints on the rate of construction of generating capacity could decrease this to 9% and if a smaller area of land was available (350 000 ha) to 6%. Table 2 shows our estimates of the amount of electricity that could be generated in the UK using biomass crops, based on a range of scenarios for crop availability. As about 600 000 ha of arable land in the UK is currently in set-aside annually, this area is potentially available for energy production and is the starting point for our scenarios. However, as other non-food crops may increasingly be grown, we have assumed that only 80% of the set-aside area is actually available. Table 2 shows that if this area alone were used for biomass crops it would provide sufficient plant material to produce electricity equivalent to 2.7% of current demand. Clearly this is not large but, if taken together with other renewables such as wind (likely to be the major source in the next few decades), wave and photovoltaics, biomass crops could make a significant contribution to partial replacement of fossil fuels. There are three main ways in which the contribution from biomass crops could be increased: 1. Increase yields of dry matter per ha; 0.0 0.2 0.4 0.6 0.8 0.01 0.21 0.41 0.61 0.81 2002100200029991899179916991599149913991 raeY Yield(tha-1 DM) Fig. 1. The yield of switchgrass (cv. Cave in rock) and Miscanthus giganteus over 10 years at Rothamsted. Both experiments received no nitrogen fertiliser. (Christian et al., 2002 with later data added). N, switchgrass; I, miscanthus.
- 4. D S POWLSON ET AL.196 2. Increase the area used for energy crops; 3. Increase efficiency of conversion of biomass into energy. These are considered in turn. Increase yields of dry matter per ha For the calculations in Table 1 we assumed a dry matter yield of 12 t ha–1 for all biomass crops. For miscanthus this is conservative as yields of up to 20 t ha–1 and above have been achieved in various European experiments (Lewandowski et al., 2000). It is likely that there is scope for significant increase as so little research has yet been conducted on the grasses. Experience from willows is promising as yields have increased greatly as a result of research on genetics and breeding. For example, willow varieties yielding up to 14 t dry matter ha–1 are now available compared to only 5–7 t ha–1 before this research was conducted. We consider that it is not unreasonable to expect miscanthus yields of about 25 t ha–1 during the next 20 years. Similar increases may be possible with switchgrass and reed canary grass. If so, the contribution to UK electricity generation could increase to about 5%, even with no increase in the area devoted to biomass crops. Increase the area used for energy crops In Table 2 we indicate some possibilities. For example,inviewofCAPreformthereissomeconcern that sugar beet may no longer be economically viable within the EU. In this situation the area currently used for this crop could potentially be available for biofuels (scenario 2 in Table 2). Another possibility would be to replace cereals currently grown in environments that are sub-optimal for yield or those grown on soils where erosion is a major risk such as the South Downs. Conversion from an annual arable crop to a perennial would greatly decrease erosion risk. In the UK a large area of land is currently used for grass (over 6 Mha; Table 2). Some of this is becoming uneconomic and some conversion to biomass crops could be economically beneficial. Climate change during the 21st century is likely to result in hotter drier summers in many parts of the UK, probably decreasing the area well suited for grass production. C4 crops such as miscanthus and switchgrass are well suited to drier conditions and could therefore replace some current grassland (scenario 5; Table 2). However this change would need to be made with great care; if old grassland were ploughed this would cause a large release of CO2 to the atmosphere and nitrate to water (Smith et al., 1996). It would be necessary to establish the biomass crops with minimum physical disturbance to the soil, for example by direct drilling. Other areas of land not suitable for normal agriculture such as landfill sites or former industrial sites could be available for biomass crops. The total area is likely to be small so the contribution to national electricity generation will be small, but there could an economic benefit locally and could help to stabilise and restore land through the input of root material. Increase efficiency of conversion of biomass into energy Adiscussion of the technology is beyond the scope of this paper but there appear to be considerable possibilities through furnace design or use of biomass for gasification. Large efficiency benefits are possible through the use of combined heat and power (CHP) systems such that heat produced during burning for electricity generation is utilised in district heating systems. To maximise the use of CHPsmall scale generating plants are required as heat must be used close to its source. Small scale generation is the preferred use for biomass crops as this decreases the need for transporting bulky materials, thus cutting costs and energy use. Table 2. Potential for biomass crops to supply UK electricity requirements (in 2002) based on various scenarios for biomass availability. See footnotes and text for assumptions Scenario no. Scenario details Percentage of UK electricity provided (%)g 1 80% of current set-aside areaa converted to biomass cropsb 2.7 2 50% of current sugar beetc area converted to biomass crops 0.5 3 50% of wood and forestry wastesd 1.6 4 50% of wheat strawe 3.7 5 10% of current grassland areaf converted to biomass crops 3.7 Total all scenarios 12.2 a 611 000 ha in 2002 (http://statistics.defra.gov.uk/esg/) b Yield assumed to be 12 t ha–1 c 169 000 ha in 2002 (http://statistics.defra.gov.uk/esg/) d Includes forestry wastes, sawdust from sawmills and prunings from municipal authorities: http://www.woodfuelresource.org.uk/ e Assuming 16 Mt produced annually (8 t straw ha–1 from 2 Mha) f 6.65 Mha in 2002 of which 1.23 Mha under 5 years old and 5.42 Mha over 5 years old (http://statistics.defra.gov.uk/esg/) g Assumes 1.6 MWhe t–1 biomass. UK electricity demand (2002) 343.8 TWh (http://www.dti.gov.uk/energy/inform/energy_in_ brief/)
- 5. 197Approaches for decreasing fossil fuel emissions from agriculture Renewable Transport Fuels For transport purposes liquid fuels are required; the two usually considered from plant sources are ethanol and rapeseed methyl ester (RME or biodiesel). RME is produced from oilseed rape and ethanol can be produced from virtually any plant material containing cellulose or from sucrose obtained from sugar beet or sugar cane. There is an EU target for renewable transport fuels of 2% by 2007 and 5.75% by 2010. Currently all car engines are designed to run on at least 5% ethanol or RME blends. Table 3 shows some possible scenarios for the production of liquid fuels. These indicate that it should be possible to meet the EU 2007 target for renewable transport fuels by using current set-aside land. However, it should be noted that this would be at the expense of using that area for biomass for electricity generation. Relative Efficiency of Different Bioenergy Options Table 4 presents a selection of energy ratios (energy available : energy expended) from recent literature for comparison with the authors own calculations. Table 3. Potential for wheat and oilseed rape to supply UK demand for road transport fuels Scenarioa Percentage of UK petrol requirement replaced by ethanolb (%) Percentage of UK diesel requirement replaced by RMEc (%) Convert 80% of current set-aside area to liquid biofuel production (wheat grain for ethanol or oilseed rape seeds for RME) 5.5 3.4 Convert sugar beet area to ethanol or RME production 1.8 1.2 a Areas as in Table 2 b Assumes 276 kg ethanol t–1 wheat grain, wheat yield of 8.0 t ha–1 . UK petrol demand (2002) 19.8 million t (http://www.dti.gov. uk/energy/inform/energy_in_brief/) c Assumes a rapeseed yield of 3.33 t ha–1 with a 37% oil yield. UK diesel demand (2002) 17.7 million t (www.dti.gov.uk/energy/ inform/energy_in_brief/) Table 4. Energy ratios for a selection of energy crop options. Energy ratio is defined as the ratio (energy available from product: energy expended in producing it). This is expressed as x:1, where a large value of x is desirable and a value less than 1 is undesirable, meaning that more energy is expended in producing the fuel than is obtainable from it. Table shows values of x Harvested crop Distributed fuel Generation of electricity2 Caliceti et al. (2001)3 Metcalfe & Bullard (2001) Authors’ own data Woods & Bauen (2003) Elsayed et al. (2003) Saynor et al. (2003) Elsayed et al. (2003) Solid fuels SRC Willow combustion 22.2 2.6 Miscanthus combustion 35.9 37.5 3.7 Wheat straw combustion 4 60.5 4 1.7 Switchgrass combustion 29.0 35.4 Reed canary grass combustion 20.4 18.0 Liquid fuels Compressed Natural Gas 0.86 Petrol 0.91 Diesel 0.94 Bio-ethanol from sugar beet 12.6 1.4 to 2.1 2.0 Bio-ethanol from wheat grain 7.2 0.7 to 2.7 2.2 Bio-ethanol from wheat straw 4 60.5 0.8 to 2.4 4 50.0 Biodiesel, oilseed rape 4.3 4.4 0.7 to 4.4 2.3 0.7 to 3.2 Biodiesel, sunflower 6.1 Fischer Tropsch reaction from SRC Willow1 22.2 18.1 to 62.4 13.9 to 44.6 Gas fuels Hydrogen from SRC Willow 22.2 18.0 to 54.0 1 50% kerosene, 25% diesel and 25% naptha 2 Electricity generation, no utilisation of heat. 20 MWe generating capacity, 25% efficient conversion process 3 Under Mediterranean conditions 4 Assumes all growing costs allocated to the grain crop, only baling, carting and stacking allocated to the straw crop. Takes no account of the value of incorporating the straw into the soil
- 6. D S POWLSON ET AL.198 Energy ratio is a means of comparing different fuel options based on partial life cycle analysis. It is defined as the ratio energy available from product: energy expended in producing it. Energy ratios are usually expressed in the form x:1, so a large value of x (well in excess of 1) is desirable meaning that the fuel option offers considerable efficiency. By contrast a value of x less than 1 means that more energy is expended in producing the fuel than is available from it when used – clearly an inefficient situation. The values in Table 4 in the column headed “authors’own data” were calculated using a combination of our assessment of typical crop yields and agronomic operations associated with each crop and the data of West & Marland (2002) on energy consumption in US agriculture, modified to UK conditions. The data are separated into three classifications dependent upon the extent of the life cycle analysis involved in the calculation. It can be seen that for each “harvested crop” assessed ‘on farm’, immediately after harvesting and without further transport or processing, the energy ratio values are all much greater than 1 (range: 4–60; Table 4), i.e. a much greater quantity of energy is potentially available from the material than was expended in growing and harvesting the crop. The dedicated energy crops (willow, miscanthus, switchgrass and reed canary grass) have large values (18–38; Table 4) due to their perennial and low input characters, i.e. amounts of fuel used for agricultural operation are small relative to annual arable crops and inputs of agrochemicals are small. There is good agreement between values calculated by the present authors and the values of Metcalfe & Bullard (2001). The annual crops (sugar beet, wheat, oilseed rape and sunflower) have lower values as they require annual cultivations and often greater agrochemical inputs (especially nitrogen fertiliser). Thus biodiesel and bioethanol, assessed at the “harvested crop stage” mostly have energy ratios in the range 4–12. Cereal straw is a special case as its energy ratio can be assessed in different ways. If straw is regarded as a by-product of grain, and effectively a waste product, it is reasonable to allocate the energy (and CO2 emissions) required for its growth entirely to grain. Doing this gives energy ratios for straw as high as 60 at the “harvested crop” stage (Table 4). Also, following this logic, Elsayed et al. (2003) obtained a value of 50 at the “distributed fuel” stage for wheat straw used as a feedstock for bioethanol production. The much lower value (0.8–2.4) calculated by Woods & Bauen (2003) reflects the case where energy inputs to the growing crop were allocated to both grain and straw. Transporting the crop to a site of utilisation ‘off farm’ (“Distributed fuel” in Table 4) can incur a significant energy cost, reducing the value of the energy ratio. Avoiding this energy expenditure is a primary reason behind the requirement for power stations etc. to source the fuel locally (often defined as a 40 km or occasionally 100 km radius).All three fossil fuels listed by Woods & Bauen (2003) show an energy ratio of less than 1. This selection of published work shows broad agreement in the calculation of the energy ratios between different authors where comparisons are possible. However it should be noted that many authors rely on the same, relatively small, set of baseline data. Expanding that baseline with independent research should be a priority. One anomaly in Table 4 is the value for processed willow by Saynor et al. (2003). Their upper value is far in excess of our calculated ‘on farm’value; the reason for this discrepancy is not known. The final classification in Table 4 highlights the energy losses when the crop is utilised to generate electricity. The energy ratios fall again, but remain greater than 1 so are still an improvement on fossil fuels. During the generation of electricity large quantities of energy are lost as heat. The same is true of the use of transport fuels but it is less well quantified. Table 5 shows how technology can improve on these inefficiencies. Utilising the heat through combined heat and power (CHP) installations greatly increases the energy ratio (Elsayed et al., 2003). This was also pointed out by the UK Royal Commission on Environmental Pollution (RCEP, 2004) who recommended the widespread adoption of CHP. Gasification and pyrolysis increase the efficiency of the electricity generating process, partly by utilising some of the heat given off to begin the process and partly because the end products are commonly utilised in an internal combustion engine rather than a steam turbine. A general conclusion from the data in Table 4 is that, at the point of use, electricity generation from dedicated biofuels gives a slight benefit in terms of energy ratios compared to liquid biofuels (bioethanol, biodiesel). However the difference is small and could easily be altered through changes in technology, as illustrated in Table 5. Although beyond the scope of this paper, it is appropriate to have a discussion on whether to prioritise land use for liquid transport Table 5. Effect of conversion process on energy ratios for electricity generation using SRC willow wood chips. Data from Elsayed et al (2003). Table shows values of x, expressing energy ratios as x:1 as described in Table 4 Electrical energy only Electrical plus heat energy (CHP) Heat only Direct combustion 2.62 15.10 10.90 Gasification 5.92 16.90 Pyrolysis 3.02 8.17
- 7. 199Approaches for decreasing fossil fuel emissions from agriculture fuels or for biomass for electricity production. In the short term it is relatively easy to start liquid fuel production, as ethanol or RME can be derived from traditional agricultural crops and can be utilised in vehicles immediately. Electricity generation from biomass requires more changes to both agriculture and the generating industry but may give the greatest saving of CO2 emissions at a national scale.Another option in the future will be the use of pyrolysis to convert solid biomass material to a liquid fuel, but the product would require significant changes to transport infrastructure. Environmental Impacts of Biomass Crops Water The overall impact of any of the biomass crops on water quality is likely to be positive. Water draining from soil growing these crops is likely have lower concentrations of nitrate, phosphate or pesticides than water from traditional arable crops or high- productivity grass in view of the lower inputs used. Christian & Riche (1998) measured nitrate leaching during the first three winters after establishment of miscanthus on a silty clay loam soil. During the first year, when plants were very small and N uptake negligible, nitrate loss was high: 150 kg N ha–1 . But in subsequent years it was less than 10 kg N ha–1 , much less than losses from arable crops that are commonly in the range 20–60 kg N ha–1 and sometimes higher (Goulding, 2000;Allingham et al., 2002).As the biomass crops are perennials, they take up water over a longer growing period than annual crops and their canopy can intercept rainfall during a large part of the year and thus decrease infiltration. It is possible that this could have a significant impact on water storage in drier regions if the crops were grown over large areas. This is an issue requiring further study. Soil organic matter content Two factors make it is very likely that, in the long term, growth of any biomass crop will increase soil organic C content compared to that in soil used continuously for annual arable crops. First, perennial crops in general tend to deposit more organic C in soil as roots and root exudates than annual crops; for example, this is well known for grasses. Observations on miscanthus suggest large inputs from roots and rhizomes (Riche & Christian, 2001). Second, the absence of tillage for perennial crops is likely to slow the decomposition of soil organic matter to some extent. A combination of these reasons leads to soils under pasture for long periods containing more organic C than an equivalent soil under arable crops. However, any changes caused by conversion to perennial biomass crops are likely to be slow as shown by Garten & Wullschleger (1999) who could not detect significant increases in soil C under switchgrass after 5 years in the USA. Similarly, Hansen et al. (2004) found only a slow increase in soil C under miscanthus in Denmark.After 16 years of miscanthus they found an increase in total soil C content of 15%, but no increase was detected after 9 years. However, changes in C isotope composition showed that 31% of the organic C in the topsoil was derived from miscanthus inputs after 16 years. Later studies at the same site (Foereid et al., 2004) indicated that the organic C derived from miscanthus was at least as stable as that derived from grass and that the turnover time of soil C increased with time under miscanthus. Assuming that there is a long-term increase in soil C under perennial biomass crops, they may be useful in restoring degraded land (e.g. landfills, brownfield sites). It is possible that switchgrass or reed canary grass could be used as part of a long crop rotation to increase the organic C content of soil that has been under arable crops for long periods. This could become an economically viable alternative to the traditional ley-arable system. Biodiversity It is currently difficult to assess the likely impact of biomass crops on the population sizes or diversity of insects, soil fauna, small mammals or birds as few large areas of the crops exist. Benefits compared to annual arable crops might be expected due to the elimination of annual cultivation and the more stable environment provided by perennial species. The limited studies conducted to date are consistent with this (Bullard et al., 1996; Santos, 2001). Managing biomass crops to enhance farmland biodiversity is an important topic for research. It is likely that the size of the areas planted, their spatial relationship to other crops or landscape features and the range of crop species planted will be important factors. Other Approaches to Decreasing CO2 Emissions from Agriculture CO2 emissions associated with arable crop production West & Marland (2002) calculated the CO2 emissions from the manufacture of agricultural inputs (fertilisers, agro-chemicals) and the fuel used for farm operations under US conditions. A significant conclusion from such studies is that the manufacture of nitrogen fertiliser often represents the largest emission of CO2 due to its high energy requirement. An emission of 0.86 kg CO2 -C kg–1 N is calculated. For winter wheat, even when grown under US conditions with smaller N applications than in Europe, N fertiliser represents about 60% of total CO2 emissions. This emphasises the importance of using N fertiliser efficiently and minimising
- 8. D S POWLSON ET AL.200 losses. Also, emissions are decreased if N can be supplied from legumes or from the recycling of organic manures. Although organic production systems eliminate fertiliser N,it does not necessarily follow that they are preferable from the emissions viewpoint. Crop yield is generally only 60–80% of the “conventional” yield and cereal crops cannot be grown every year as such systems usually rely on a rotation that includes several years of a grass/clover pasture, so the effective yield over a period of years is even lower. Thus the average C emission per unit of grain can be similar to that for a system using N fertiliser. In view of the high CO2 emission associated with N fertiliser, its use in the production of energy crops must be minimised otherwise the environmental benefit from these crops is severely decreased. This is one of the factors that decreases the energy ratio of bioethanol and RME compared to the low-input biomass crops. A possibility to be investigated is whether legumes can be intercropped with perennial biomass crops as a method of meeting their modest N requirements. An interesting proposal tested in an EU project is the establishment of belts of SRC willow between areas of traditional agricultural crops with the aim of producing energy equal to that used in agricultural production within the farm (see: http://www.agsci. kvl.dk/~bek/cfehtml.htm#energy). C sequestration in soil or vegetation Any C that can be transferred from atmospheric CO2 to a storage pool in the biosphere is beneficial in mitigating human-induced climate change. On a global basis soil organic matter contains more than twice the amount of C in atmospheric CO2 and additional C is stored in vegetation. Because these pools are so large, relatively small increases or decreases can be of global significance. There has been much discussion about the possible role of carbon sinks in mitigating climate change, both the opportunities they provide and their limitations; see for example Smith et al. (2001).ARoyal Society report (Royal Society, 2001) concluded that the reform of the EU Common Agricultural Policy provides opportunities for sequestration of C in agricultural soils. The organic C content of arable soils tends to be low so there is often scope for increase through changes in management practice or conversion to woodland or pasture. But it was also noted that any sequestration is finite – as the quantity of C held in soil organic matter or in the trees of a new forest accumulates, it tends towards a maximum and then increases no more.Also, C sequestration is reversible: if agricultural management or land use subsequently reverts to the original (e.g. pasture or woodland converted back to arable), the accumulated C will be released. Thus sequestration offers a useful means of CO2 mitigation in the medium term but is not an alternative to cuts in emissions. Smith et al. (2001) estimated that sequestration measures applied to European agricultural land had the potential to provide mitigation in the range of 1–4% of European CO2 emissions; mitigation was larger (5% or more) if the biofuels were grown on former arable land because of the continuing replacement of some fossil fuel. In addition, management practices leading to C sequestration in soil or trees almost invariably provide additional benefits to the wider environment or to soil quality. One option is to develop wider field margins that include trees; these increase habitats for a range of insects and fauna on farmland in addition to sequestering carbon (Falloon et al., 2004). References Allingham K D, Cartwright R, Donaghy D, Conway J S, Goulding K W T, Jarvis S C. 2002. Nitrate leaching losses and their control in a mixed farm system in the Cotswolds, England. Soil Use and Management 18:421–427. Bullard M J, Christian D G, Wilkins C. 1996. Quantifying biomass production in crops grown for energy. ETSU B CR/0038/00/00. Harwell, Didcot, Oxon: AEA Technology Environment, pp. 61–63. Caliceti M, Sanjuan Roca D, Venturi P. 2001. Analysis of energy balances for different technical paths concerning biodiesel production from oilseed rape and sunflower in Italy. Aspects of Applied Biology 65, Biomass and energy crops II, pp. 57–64. Christian D G, RicheAB. 1998. Nitrate leaching losses under Miscanthus grass planted on a silty clay loam soil. Soil Use and Management 14:131–135. Christian D G, Riche A B, Yates N E. 2002. The yield and composition of switchgrass and coastal panic grass grown as a biofuel in Southern England. Bioresource Technology 83:115–124. Christian D G, Yates N E, Riche A B. 2005. Establishing Miscanthus sinensis from seed using commercial sowing methods. Industrial Crops and Products 21:109-111. Defra. 1998. Codes of Good Agricultural Practice. http://www. defra.gov.uk/environ/cogap/cogap.htm Defra. 2002. Growing Short Rotation Coppice, Best Practice Guidelines. London: DEFRA Publications. 31 pp. http:// www.defra.gov.uk Elsayed M A, Mathews R, Mortimer N D. 2003. Carbon and energy balances from a range of biofuels options. Report No. 21/3 for the Energy Technology Support Unit, DTI. Falloon P, Powlson D S, Smith P. 2004. Managing field margins for biodiversity and carbon sequestration – a UK case study. Soil Use and Management 20:240–247. Foereid B, de Neergaard A, Høgh-Jensen H. 2004. Turnover of organic matter in a Miscanthus field: effect of time in Miscanthus cultivation and inorganic nitrogen supply. Soil Biology and Biochemistry 36:1075–1085. Garten C T, Wullschleger S D. 1999. Soil carbon inventories under a bioenergy crop (switchgrass): measurement limitations. Journal of Environmental Quality 28:1359– 1365. Goulding K W T. 2000. Nitrate leaching from arable and horticultural land. Soil Use and Management 16:145–151. Hansen E M, Christensen B T, Jensen L S, Kristensen K. 2004. Carbon sequestration in soil beneath long-term Miscanthus plantations as determined by 13 C abundance. Biomass and Energy 26:97–105.
- 9. 201Approaches for decreasing fossil fuel emissions from agriculture Hilton B S. 2001. Establishment, management and harvesting of short rotation coppice at the commercial scale forARBRE. Aspects of Applied Biology 65, Biomass and energy crops II, pp. 109–116. IPCC. 2001. Summary for Policy Makers. In Climate Change 2001: The Scientific Basis. Contribution of Working Group I to the Third Assessment Report of the Intergovernmental Panel on Climate Change. Eds. J T Houghton, Y Ding, D J Griggs, M Noguer, P J van der Linden, X Dai, K Maskell and C A Johnson. Cambridge, UK, and New York, USA: Cambridge University Press. Available at http://www.ipcc.ch Johnson P. 1999. Fertiliser requirements for short rotation coppice. ETSU/B/W2/00579/REP/1. Lewandowski I, Clifton-Brown J C, Scurlock J M O, Huisman W. 2000. Miscanthus: European experience with a novel energy crop. Biomass and Bioenergy 19:209–27. McCrackenAR, Dawson W M. 2001. Disease effects in mixed varietal plantations of willow. Aspects of Applied Biology 65, Biomass and energy crops I, pp. 255–262. Metcalfe P, Bullard M J. 2001. Life-cycle analysis of energy grasses. Aspects of Applied Biology 65, Biomass and energy crops II, pp. 29–37. Pfeifer R A, Fick G W, Lathwell, D J, Maybee C. 1990. Screening and selection of herbaceous species for biomass production in the Midwest/lake states, Final Report 1985– 1989. Report ORNL/Sub/85-27410/5, Oak Ridge. TN, USA: Oak Ridge National Laboratory. RCEP. 2000. Royal Commission on Environmental Pollution. Twenty-second Report : Energy – the changing climate. Norwich, UK: Her Majesty’s Stationery Office. RCEP. 2004. Biomass as a Renewable Energy Source – A Limited Report by The Royal Commission on Environmental Pollution. Norwich, UK: Her Majesty’s Stationery Office. Riche A B, Christian D G. 2001. Estimates of rhizome weight of Miscanthus with time and rooting depth compared to switchgrass. Aspects of Applied Biology 65, Biomass and energy crops II, pp. 147–152. Royal Society. 2001. The role of land carbon sinks in mitigating global climate change. Royal Society Policy Document 10/01, 27 pp. See also http://www.royalsoc.ac.uk. Santos O J F. 2001. Environmental aspects of Miscanthus production. In Miscanthus for Energy and Fibre, pp. 46–67. Eds M B Jones and M Walsh. London: James and James. Saynor R, Bauen A, Leach M. 2003. The potential for renewable energy sources in aviation. Report for the DTI by Imperial College Centre for Energy Policy and Technology. http://www.iccept.ic.ac.uk/pdfs/PRESAV%20final%20repo rt%2003Sep03.pdf Smith P, Goulding K W, Smith K A, Powlson D S, Smith J U, Falloon, P, Coleman K 2001. Enhancing the carbon sink in European agricultural soils: including trace gas fluxes in estimates of carbon mitigation potential. Nutrient Cycling in Agroecosystems 60:237–252. Smith P, Smith J U, Powlson D S. 1996. Moving the British cattle herd. Nature 381:15. West T O, Marland G. 2002. A synthesis of carbon sequestration, carbon emissions, and net carbon flux in agriculture: comparing tillage practices in the United States. Agriculture, Ecosystems and Environment 91:217–232. Woods J, Bauen A. 2003. Resources, costs and carbon abatement potential of biofuels. European Climate Forum, 9th September 2003. http://www.european-climate-forum. net/events/norwich2003/pdf/ecf_norwich_woods.pdf. A summary of DTI project B/U2/00785/REP URN 03/982 (Revised version accepted 26 January 2005; Received 30 April 2004)