
Recommandé
Recommandé
Contenu connexe
Tendances
Tendances (15)
Similaire à Indianapolis JLL Office Employment Update May 2015
Similaire à Indianapolis JLL Office Employment Update May 2015 (20)
Plus de JLL_Midwest_Great_Lakes_Research
Plus de JLL_Midwest_Great_Lakes_Research (20)
Dernier
Dernier (20)
Indianapolis JLL Office Employment Update May 2015
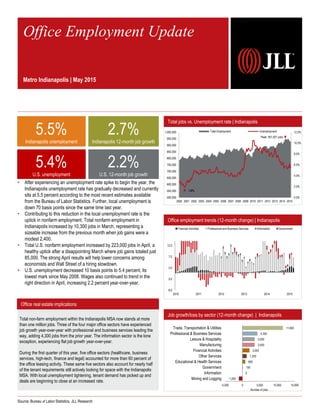
- 1. Office real estate implications Office employment trends (12-month change) | Indianapolis Source: Bureau of Labor Statistics, JLL Research Job growth/loss by sector (12-month change) | Indianapolis Total non-farm employment within the Indianapolis MSA now stands at more than one million jobs. Three of the four major office sectors have experienced job growth year-over-year with professional and business services leading the way, adding 4,300 jobs from the prior year. The information sector is the lone exception, experiencing flat job growth year-over-year. During the first quarter of this year, five office sectors (healthcare, business services, high-tech, finance and legal) accounted for more than 60 percent of the office leasing activity. These same five sectors also account for nearly half of the tenant requirements still actively looking for space with the Indianapolis MSA. With local unemployment tightening, tenant demand has picked up and deals are beginning to close at an increased rate. Total jobs vs. Unemployment rate | Indianapolis 5.5% Indianapolis unemployment 2.7% Indianapolis 12-month job growth 5.4% U.S. unemployment 2.2% U.S. 12-month job growth Number of jobs • After experiencing an unemployment rate spike to begin the year, the Indianapolis unemployment rate has gradually decreased and currently sits at 5.5 percent according to the most recent estimates available from the Bureau of Labor Statistics. Further, local unemployment is down 70 basis points since the same time last year. • Contributing to this reduction in the local unemployment rate is the uptick in nonfarm employment. Total nonfarm employment in Indianapolis increased by 10,300 jobs in March, representing a sizeable increase from the previous month when job gains were a modest 2,400. • Total U.S. nonfarm employment increased by 223,000 jobs in April, a healthy uptick after a disappointing March where job gains totaled just 85,000. The strong April results will help lower concerns among economists and Wall Street of a hiring slowdown. • U.S. unemployment decreased 10 basis points to 5.4 percent, its lowest mark since May 2008. Wages also continued to trend in the right direction in April, increasing 2.2 percent year-over-year. Office Employment Update Metro Indianapolis | May 2015 0.0% 2.0% 4.0% 6.0% 8.0% 10.0% 12.0% 500,000 550,000 600,000 650,000 700,000 750,000 800,000 850,000 900,000 950,000 1,000,000 2000 2001 2002 2003 2004 2005 2006 2007 2008 2009 2010 2011 2012 2013 2014 2015 Total Employment Unemployment Peak: 951,921 jobs 1.8% -8.0 -3.0 2.0 7.0 12.0 2010 2011 2012 2013 2014 2015 Financial Activities Professional and Business Services Information Government -1,000 0 100 800 1,200 2,000 3,500 3,500 4,300 11,600 -5,000 0 5,000 10,000 15,000 Mining and Logging Information Government Educational & Health Services Other Services Financial Activities Manufacturing Leisure & Hospitality Professional & Business Services Trade, Transportation & Utilities
- 2. © 2015 Jones Lang LaSalle IP, Inc. All rights reserved. All information contained herein is from sources deemed reliable; however, no representation or warranty is made to the accuracy thereof. March 2013 March 2014 March 2015 Total non-farm employment 958,400 1.8% 976,700 1.9% 1,002,700 2.7% Unemployment rate 8.1% 6.2% 5.5% Indianapolis supersectors March 2013 March 2014 March 2015 Mining, Logging & Construction 40,500 -1.5% 41,400 2.2% 40,400 -2.4% Manufacturing 87,200 1.8% 88,100 1.0% 91,600 4.0% Trade, Transportation, & Utilities 202,000 2.5% 205,900 1.9% 217,500 5.6% Information 16,500 3.1% 16,800 1.8% 16,800 0.0% Financial Activities 59,600 -0.8% 60,200 1.0% 62,200 3.3% Professional & Business Services 139,800 3.0% 148,100 5.9% 152,400 2.9% Educational & Health Services 145,000 2.3% 144,800 -0.1% 145,600 0.6% Leisure & Hospitality 96,500 1.8% 97,400 0.9% 100,900 3.6% Other Services 42,100 3.4% 43,700 3.8% 44,900 2.7% Government 129,200 0.2% 130,300 0.9% 130,400 0.1% News on the street | Indianapolis businesses expanding, contracting, etc. Employment statistics | Indianapolis Industry employment stratification | Indianapolis AgReliant Genetics, LLC. │ Agricultural research and production: Expanding AgReliant Genetics, LLC., a corn seed research and production company, will invest $4 million to expand its headquarters in Westfield. The expansion will provide additional office space, a break room and meeting space. The new facility will total approximately 50,000 square feet when completed. AgReliant currently occupies 30,000 square feet. The company anticipates hiring about 30 new employees over the next two years. AgReliant currently has more than 50 employees on site. Dattus, Inc. │ High-tech: Expanding Dattus, Inc., a locally-based tech start-up company, recently opened an office in Indianapolis. The company is located in 2,500 square feet at One College Park after previously being housed in the Purdue Research Park in West Lafayette. The Indianapolis office currently houses six employees, but the company is currently looking to fill several positions and anticipates having up to 40 employees by 2020. EnviroForensics │ Environmental engineering: Expanding Indianapolis-based EnviroForensics, an environmental engineering firm, plans to purchase and rehab a former retail building in downtown Indianapolis into its new headquarters. The project is expected to cost nearly $1 million and will enable the company to double its workforce from 42 employees to 84 employees during the next five years. Geofeedia │ High-tech: Expanding Chicago-based Geofeedia will invest nearly $3 million to expand its presence in downtown Indianapolis. The company will lease more than 9,000 square feet in the Circle Tower building. Geofeedia plans to grow from 20 employees to more than 300 over the next five years thanks to its popular social media analytics program. HealthPro, LLC. │ Healthcare: Expanding HealthPro, LLC., a spin-off of locally-based OurHealth, recently established its headquarters in Indianapolis. The company plans to invest more than $8.5 million and create nearly 200 jobs over the next four years. HealthPro assists patients in selecting their optimal healthcare provider. HRD Advisory Group │ Consulting: Expanding HRD Advisory Group recently announced plans to invest upwards of $500,000 in new equipment at its 5,000-square-foot Carmel location. The consulting firm also plans to hire an additional 25 employees over the next four years. Lowe’s (NYSE: LOW) │ Retail: Expanding Lowe’s recently marked the opening of its new Indianapolis call center. The home improvement retailer purchased Intech 12 on the northwest side of Indianapolis last year. Lowe’s plans to employ roughly 1,000 workers in the 140,000-square-foot Class A facility. 8900 Keystone Crossing, Suite 1150 Indianapolis, IN 46240 www.jll.com/indianapolis For more information, please contact: Mike Cagna Senior Research Analyst tel +1 317 810 7358 Mike.Cagna@am.jll.com Trade, transportation and Utilities, 217,500, 22% Professional and Business Services, 152,400, 15% Educational and Health Services, 145,600, 15% Government, 130,400, 13% Leisure and Hospitality, 100,900, 10% Manufacturing, 91,600, 9% Financial Activities, 62,200, 6% Other Services, 44,900, 4% Mining, Logging and construction, 40,400, 4% Information, 16,800, 2%