SlideShare une entreprise Scribd logo
1  sur  75
TABLE OF CONTENT
ABSTRACT
1.0 INTRODUCTION
1.1 Objectives
1.2 Site Study
1.2.1 Introduction
1.2.2 Site Selection Reasons
1.2.3 Measured Drawings
1.3 Methodology
1.3.1 Identification of Existing Conditions
2.0 LITERATURE REVIEW
2.1 Acoustics
2.1.1 Sound
2.1.2 Amplitude, Wavelength & Frequency
2.1.3 Common Sound in Decibels
2.1.4 Acoustics in Architecture
2.1.5 Acoustics Standard ANSI (2008) S12.2-2008
3.0 PRECEDENT STUDY
3.1 Introduction to Building
3.2 Statistical Analysis Method/Questionnaire
3.3 Formula for Acoustic Analysis Calculation
4.0 CASE STUDY
4.1 Site Study and Zoning
4.2 External Noise Source
4.3 Interior Noise Sources
4.3.1 SPACE 1: Gymnasium
4.3.1.1 Existing Equipment
4.3.1.2 Cooling System
4.3.1.3 Human noise
4.3.2 SPACE 2: Physiology Room
4.3.2.1 Existing Equipment
4.3.2.2 Cooling System
4.3.2.3 Human noise
4.4 Tabulation & Interpretation of Data
4.5 Acoustic Fixtures and Specifications
4.6 Gymasium calculation
4.6.1 Calculation of sound intensity of indoor noise source
4.6.2 The calculation of sound level
4.6.3 Analysis & Evaluation
4.6.4 Sound reduction index calculation
4.6.5 Reverberation Time Calculation
4.7 Acoustic Analysis
4.8 PHYSIOTHERAPY CALCULATION
4.8.1 Calculation of sound intensity of indoor noise source
4.8.2 The calculation of sound level
4.8.3 Analysis & Evaluation
4.8.4 Sound reduction index calculation
4.8.5 Reverberation Time Calculation
4.9 Acoustic Analysis for Physiotherapy
5.0 References
ABSTRACT
This report consists of the study of how acoustics affects the environment and we chose to
conduct at SOSCO Rehabilitation Centre, Melacca as our case study. In order to carry out the
performance evaluation, we’ve requested the proper floor plans from the facilities
management that govern the site buildings, and also produced elevations and sections for
the ease of data collection. Collection of acoustics data is carried out at the functioning hour
of the building to quantify and qualify the existing condition of the site. All the data and
drawings collected were then further used to carry out an analysis to study the performance
of the building. A list of figures are used as well and a list of references is provided at the end
of the report for the ease of navigation. Additionally, photographs were also taken on site to
further identify acoustics sources of the chosen area.
1.0 INTRODUCTION
Acoustics study on buildings and spaces within is crucial as considerations of maintaining and
having good quality noise control. Some key spaces that requires critical acoustics control
are galleries, concert halls, restaurants and many other spaces.
In short, this project is design to expose and introduce us acoustics requirement in a
suggested space. In a group of 7, we have chosen SOSCO Rehabilitation Centre, Melacca, as
our site study. We have conducted several site visits to ensure the success of the project
outcome. Measurement and calculations of acoustic readings and site measurement are
done during the visits and after the visit respectively. Lastly, we concluded the analysis based
on the results of our findings and observations.
1.1 Objectives and Aim
1. To observe and understand acoustics and its characteristics.
2. To understand acoustic requirement in a suggested place.
3. To determine the different types of acoustics throughout this project.
4. To determine the characteristics and function of sound within the intended space.
5. To critically report and analyze the space and suggest remedies to improve acoustic
qualities within the space.
The primary objective of this project is to impart the understanding of acoustics and
characteristic and requirement in a suggested space, thereby determine their functions and
various factors affecting it. With the data collected and the relevant knowledge, an analysis
is to perform to evaluate the suggested space with a critical mindset. Besides that,
understanding the acoustics elements and existing arrangement helps in determining the
acoustics characteristics that is reflected in the data collection by using certain methods or
calculations. Backed up with precedent studies, drawing comparison with the site study, our
precedent studies will aid in achieving all the objectives above.
1.2 Site Study
Case Study: SOCSO Rehabilitation Center, Melacca.
Identification of space: Gymnasium rehabilitation space and physiotherapy room.
Address: Pusat Rehabilitasi Perkeso
Lot PT 7263 [H.S (D) 18923]
Bandar Hijau, Hang Tuah Jaya,
Melaka, 75450, Malaysia.
1.2.1 Introduction
SOCSO Rehabilitation Centre is located at Bandar Hijau, Hang Tuah Jaya, Melacca. It is
a rehabilitation centre that consists of an administration block and 5 extended wings.
Namely, the Gymnasium, Vocational, Physiotherapy, Hydrotherapy and the Speech and
Audio therapy.
Under SOCSO’s "Return to Work" program, disabled patients undergo physical and
vocational rehabilitation in order to rejoin the workforce. The architect, Anuar Aziz Architect,
called this process the "Journey to Healing," where the patients will heal physically and
mentally, and lead a normal working life after the rehabilitation process.
The allied health institute will provide the skilled personnel. This green certified complex was
designed with ‘nature’ and ‘spirituality’ integral to the healing process. A universal access-
for-all concept and Malaysian Standard for disabled access is applied throughout.
The concept of the building is each building is given a different identity according to
functions and ease of way finding. Calming and soft colors are utilized throughout the
complex.
1.2.2 Site Selection Reasons
Based on observation, the building provides sufficient functional spaces to conduct out an
analysis on acoustics conditions. The gymnasium space and the physiological therapy space
with specific function would help us develop an understanding on how noise is controlled to
achieve comfort for users based on different programs and functions.
In terms of acoustics properties, the gymnasium space and the physiological therapy space
can be categorized into semi enclosed space, though the gymnasium has a higher ceiling
space compared to the other. Numerous noise producing elements are spotted within the
spaces ranging from electronic equipments, to human activities.
1.2.3 Measured Drawings
Figure 1 Floor Plan of Physiotherapy Room
Figure 2 Floor plan of Gymnasium Room
2.0 Precedent study
2.1. INTRODUCTION TO BUILDING
Bahcesehir University (BAU) Office, Besiktas Campus
Figure 3.1a: Bahcesehir University Besiktas Campus
Located in Istanbul, Turkey, the Bahcesehir University is a well-known private educational
institution with its main campus located at the edge of the Bosporus in Besiktas. The
university consists of eight faculties: a school of language, two vocational schools and four
institutes that provide post graduate education, with an average of 17,000 registered
students studying at the university.
The space that we chose to study is the Faculty of Architecture & Design of Bahcesehir
University. Position on the side of the shore, the buildings are formed in the shape of long,
narrow rectangular prisms sited very close and are interconnected to one another. These
buildings face the garden on the shore and sea with one of their narrow sides, and a high
traffic artery of the city with the other.
The office occupies half of the 1st floor of
Block B and faces sea on the East, and other
two neighboring buildings (buildings A and C)
on the north and south. There are two
different types of office spaces in the faculty.
Open-offices with semi-enclosed partitions in
the central area and are used by the
teaching/research assistants; the closed
offices surrounding the central area from
three sides, shared by two or three academic
staff. Closed offices, with regard to their
orientation as A and B, create 2 subgroups within closed office type.
2.1.2.1 ACOUSTIC COMFORT/NOISE CONTROL
Measurements regarding the environmental noise in the space were taken in the
morning (10.00-10.11), noon (13.00-13.12) and afternoon (16.26-16.36) times of a working
day, with the windows tightly shut. These periods were decided in reference to the standard
working hours of the users. Sound level meter and sound pressure equipment were set in
the middle of the office and central area 150cm above the ground level and then used for
comparison with the standards IEC 60651 and IEC 60804.
Placement of equipment for acoustic analysis
2.3.1.2 ACOUSTIC COMFORT
Acoustics data of Office A close to neighboring building
Acoustics data of Office A campus side
Acoustics data of Office B
Acoustics data of Office C
2.4 Conclusion
Through the data taken in the precedent study of the Bahcesehir University Besiktas
Campus, the result was shown that the environmental noise appeared to influence the
perception of environmental quality. Mentioned by the occupants, they show dissatisfaction
of acoustic privacy and noise control due to the fact that they are not that well maintained
as it is affect by environmental elements.
The findings shown a slightly higher environmental sound intensity compared to
optimum human condition, the poor choice of materials for sound buffering is one of the key
faults of providing bad acoustic control
3.0 Research Methodology
3.1 Acoustic Analysis
Sound and Acoustic analysis plays a role in the acoustic design performance, sound and
noise level of the noise. The analysis might involve in design fine tuning in order to achieve
the standards from ANSI, IEC and ISO. A simple and fairly effective method of diagnostics can
be performed with acoustical equipment.
Description of Equipment
(a) Acoustic Measuring Equipment (Digital Sound Level Meter)
Figure 3.2.1.1: Sound Level Meter
GENERAL SPECIFICATIONS
Measurement 30 – 130 dB
Resolution 0.1 dB
Measured Quantities
Linearity Characteristics of “A” frequency weighting network meet IEC
61672 class 2.
Under 94 dB input signal, the accuracy are:
31.5 Hz ± 3.5 dB
63 Hz ± 2.5 dB
125 Hz ± 2.0 dB
250 Hz ± 1.9 dB
500 Hz ± 1.9 dB
1 K Hz ± 1.4 dB
2 K Hz ± 2.6 dB
4 K Hz ± 3.6 dB
8 K Hz ± 5.6 dB
Power Supply Alkaline or heavy duty DC 1.5V battery (UM3, AA) x 6 PCs.
Or equivalent.
DC 9V adapter input. (AC/ DC power adapter is optional).
Dimension 245mm x 68mm x 45mm
Weight 489g
Table 3.2.1.2: General Specification of Sound Level Meter
(b) Smartphone [OnePlus One]
An additional recording device is used as a result comparison with the digital sound level
meter. A median result is then obtained and will be averaged in the recordings table.
(c) Measuring Tape
The tape is used to measure a constant height of the position of the sound meter and the
grids established for the area, which is at 1m and 1.5m respectively. The height is taken on
one person as reference to obtain an accurate reading.
(d) Camera [a7ii Sony]
The camera is used to record pictures on the source of sound in the cafe and its surrounding.
3.2 Data Collection Method
The sound level meter is placed at the same height of 1m for each point in order to obtain an
accurate reading. This is done to ensure the consistency of the measurements taken. The
readings were recorded on a plotted plan with 1.5m x 1.5m gridlines. Noises produced by us
students are kept to the minimum to obtain the best sound reading result.
Procedure
1. Push the Power Switch to switch on the device.
2. Record the dB value by holding the Noise Indicator at 1m height, approximately at
waist height (ear level while sitting).
3. Record the data displayed on the device.
4. Repeat 2 and 3 until all data are completed.
Figure 3.2.2.1: Position of Noise Indicator at 1 meter
3.3 Formula for Acoustic Analysis Calculation
Calculation for Reverberation Time:
Reverberation time (RT) is a measure of the amount of reverberation in a space and equal to
the time required for the level of a steady sound to decay by 60dB after the sound has
stopped. The decay rate depends on the amount of sound absorption in a room, the room
geometry, and the frequency of the sound.
Reverberation Time Formula: RT = (0.16 x V) divide by A
Where,
V = Volume of space
A = Total absorption (Material Covering Area x Absorption Coefficient)
4.0 CASE STUDY
4.1 Site Study and Zoning
4.2 External Noise Source
Located in a fairly remote part of Bemban, Malacca, the SOCSO Rehabilitation Centre is
located between Jalan Kolej Yayasan Saad and Lebuhraya Utara-Selatan. Since Kolej Yayasan
Saad is located before SOCSO Rehabilitation Centre, vehicle circulation in front of our site is
quite minimal as the other end only consists of a solar farm and an undeveloped road end.
Contrastingly, the back of SOCSO Rehabilitation Centre is the North-South highway where
many high-speed vehicles pass by the site.
But through our observation, SOCSO Rehabilitation Centre is surrounded by lush and thick
greeneries, thus constant audible sound ranges just around 50 to 55 dB, an optimum sound
range for the disables to concentrate on their trainings without any unnecessary
disturbances.
Annotated plan to indicate noise sources
4.3 Interior Noise Sources
4.3.1 SPACE 1: Gymnasium
Inside the SOCSO Rehabilitation Centre’s gymnasium space, we noticed some of the key
activities of patients exercising and trainings with their nurses’ guidance.
From our observation, we noted that the music produced by the speakers have quite a high
sound intensity level in our chosen analysis space, whereas the sound from the gym
equipment and air diffusers are moderate, but noticeable.
Sound produced by human activities are considered low as patients tend to train individually
and independently according to their own pace, thus there was not much human interaction
in the area unless by-standing nurses come to aid.
4.3.1.1 Existing Equipment
Some of the most significant noise produced are the electronic equipment present in our
chosen gymnasium area. The one component that constantly produces noise are the
speakers located on corner walls of the room, blasting catchy beats to motivate the patients.
Occasional rings from the phone can be heard as well for the nurses to communicate any
reports of situations. Lastly, electronic gym equipment such as the treadmills can be quite
noticeable when used by patients during operating hours of the day, whereas other
equipment such as the bicycle and lifting training produces little to none noises.
4.3.1.2 Cooling System
Though moderate, yet noticeable, the noise generated through air diffusers are located at
higher walls can be heard constantly. Noise produce from the air diffusers are related by the
velocity settings of the AHU panels, and for the gymnasium, it was considered set slightly
above average due to the fact that users will experience body heat during a workout. Thus
the higher velocity of conditioned air caused a slightly higher intensity of sound level, yet it is
still not till extend which will distract the users.
4.3.1.3 Human noise
Human interactions are considered low in the gymnasium due to the fact that most users
attended as independent individuals, and not as groups. As so, human communications such
as chats and discussions are very faint, thus overall human noises are low. Only a few
grudges sounds can be heard during their activities.
4.3.2 SPACE 2: Physiology Room
The other chosen area of SOCSO Rehabilitation Centre’s is the Physiology room, located a
block away from the gymnasium. Comparison wise, the sound intensity level of the
Physiology room is slightly higher than the gymnasium, but with dissimilar factors.
From our observation, we noticed that the room ceiling is much lower than the gymnasium,
thus noise reflection is closer and more obvious. The most significant noises are produced by
human noises due to the fact that this particular room consists of many patients interacting
with their nurses. The sound from electronic equipment and air diffusers are too moderate
yet noticeable as well.
4.3.2.1 Existing Equipment
Unlike the gymnasium, the physiology room consists of numerous of specialized equipment
that measures and records the patients’ performance, although those are seldom used and
only used on critical phases only, thus they do not contribute much to the noise level of the
area. Other electronic equipment are the phones and computers which occasionally rings
when used by nurses to communicate with other departments.
4.3.2.2 Cooling System
The ceiling fixed air diffusers present in the physiology room has the similar moderate yet
noticeable noise produced, but not till extend which will distract and affect the patients and
nurses who are using the facilities as communication is still clearly hearable. Additionally, we
observed that the velocity is not as powerful as the gymnasium as not much vigorous
activities present in this block. Thus, a fainter noise is produced in this area.
4.3.2.3 Human noise
For this room, human noise level is considerably higher than the gymnasium due to the
higher amount of patient and nurse interactions. Usually new patients are introduced to this
area first to familiarize themselves to their trainings, thus many nurses are present to guide
and motivate them to push through their limits, and therefore occasional loud grudges
sound may occur in this area of space.
4.4 Tabulation & Interpretation of Data
The colors present in the table represent the respective zones in the colored plan. The
reading were taken at the level of 1m
4.5 Acoustic Fixtures and Specifications
Item Type Treadmill
Product Name Biodex RTM600
Weight 179kg
Sound Pressure Level 70 – 76 dB
Dimension 218cm x 69cm x 137cm
Placement Floor
Item Type Telephone
Product Name Panasonic KX-550B
Weight 495g
Sound Pressure Level 80dB
Dimension 9.6cm x 15cm x 20cm
Placement Table
Item Type Speaker
Product Name JBL CSS-1S/T
Weight 2000g
Sound Pressure Level 96 – 106 dB
Dimension 29cm x 15.9cm x 14.3cm
Placement Wall
–
Product Name Air Diffusers
Sound Pressure Level 40 – 50 dB
Placement Wall
Item Type Basin
Sound Pressure Level 40 dB
Dimension 47cm x 55 cm
Placement Wall
Item Type Computer Monitor
Product Name HP V241p LED Monitor
Weight 3, 855g
Sound Pressure Level 35 dB
Dimension 55cm x 40cm x 5cm
Placement Table
Item Type Printer
Product Name HP Deskjet 1000 series
Weight 3,600g
Sound Pressure Level 50 dB
Dimension 42.7cm x 30cm x 15.5cm
Placement Table
Item Type Printer
Product Name HP Officejet 4000 series
Weight 6,000g
Sound Pressure Level 55 dB
Dimension 44.5cm x 33cm x 17cm
Placement Wall
4.6 GYMNASIUM CALCULATION
4.6.1 Calculation of sound intensity of indoor noise source
To obtain the intensity of the sound of each noise source in order
By using formula, SIL = 10 log ( I Io )
Where I = the intensity of sound being measured, (W/m2 )
Io = the intensity of the threshold of hearing, taken as 10-12 W/m2
Air diffuser
The maximum sound power level of the air diffuser is 50dB.
SIL = 10 log (
Iac
Io
)
50 = 10 log (
Iac
Io
)
5.0 = log ( Iac / 1 x 10 -12)
105 = ( Iac / 1 x 10 -12)
Iac = 1 x 10 -12 x 105
Iac = 1 x 10 -7
The air diffuser sound intensity is 1 x 10 -7 W/m2
Treadmill Biodex RTM 600
The maximum sound power level of the treadmill is 76dB.
SIL = 10 log (
Itm
Io
)
76 = 10 log (
Itm
Io
)
7.6 = log ( Itm / 1 x 10 -12)
107.6 = ( Itm / 1 x 10 -12)
Itm = 1 x 10-12 x 107.6
Itm = 1 x 10-4.4
The treadmill sound intensity is 1 x 10-4.4 W/m2
Telephone Panasonic KX-550B
The maximum sound power level of the telephone is 80 dB.
SIL = 10 log (
It
Io
)
80 = 10 log (
It
Io
)
8.0 = log ( It / 1 x 10 -12)
108.0 = ( It / 1 x 10 -12)
It = 1 x 10-12 x 108.0
It = 1 x 10⁻⁴
The telephone sound intensity is 1 x 10⁻⁴ W/m2
Speaker JBL CSS-1S/T
The maximum sound power level of the speaker is 106dB
SIL = 10 log (
Is
Io
)
106 = 10 log (
Is
Io
)
10.6 = log ( Is / 1 x 10 -12)
1010.6 = ( Is / 1 x 10 -12)
Is = 1 x 10-12 x 1010.6
Is = 1 x 10-1.4
The speaker sound intensity is 1 x 10-1.4 W/m2
Basin
The maximum sound power level of the basin is 40 dB
SIL = 10 log (
Ib
Io
)
40 = 10 log (
Ib
Io
)
4.0 = log ( Ib / 1 x 10 -12)
104 = ( Ib / 1 x 10 -12)
Ib = 1 x 10-12 x 104
Ib = 1 x 10⁻⁸
The basin sound intensity is 1 x 10⁻⁸ W/m2
Human Activities
The maximum sound power level of the human activities is around 60 dB.
SIL = 10 log (
Ir
Io
)
60 = 10 log (
Ir
Io
)
6.0 = log ( Ir / 1 x 10 -12)
106.0 = ( Ir / 1 x 10 -12)
Ir = 1 x 10-12 x 106.0
Ir = 1 x 10⁻⁶
The human activities sound intensity is 1 x 10⁻⁶ W/m2
4.6.2 THE CALCULATION OF SOUND LEVEL
Air diffuser 1 x 10⁻⁷ W/m2
Telephone Panasonic KX-550B 1 x 10⁻⁴ W/m2
Basin 1 x 10⁻⁸ W/m2
Speaker JBL CSS-1S/T 1 x 10-1.4 W/m2
Treadmill Biodex RTM600 1 x 10-4.4 W/m2
Human Activities 1 x 10⁻⁶ W/m2
The sound intensity of all indoor noise sources is calculated beforehand. The sound level of
different zones can be calculated using data shown in table above and these formula,
I = I1 + I2 + I3 +…+ In and SIL = 10 log ( I Io ).
Where I = the intensity of sound being measured, (W/m2 )
Io = the intensity of the threshold of hearing, taken as 10-12 W/m2
Zone 01: Rowling machine zone
Total intensity = 2 x air duct + 1 telephone + 2 human activities
= 2 x ( 1 x 10 -7) + 1 x 10⁻⁴ + 2 x (1 x 10-6 )
= 1.022 x 10 -4 W/m2
SIL = 10 log (
I
Io
)
SIL = 10 log ( 1.022 X 10⁻⁴ / 1 x 10-12)
SIL = 80.10 dB
Zone 02: Bike riding area
Total intensity = 3 x air duct + 1 basin + 1 speaker + 2 human activities
= 3 x ( 1 x 10 -7) + 1 x 10⁻⁸ + 1 x 10⁻⁸ + 2 x (1 x 10-6 )
= 2.320 x 10 -6
SIL = 10 log (
I
Io
)
SIL = 10 log ( 2.320x10⁻⁶ / 1 x 10-12)
SIL = 63.65 dB
Zone 03: Multipurpose machine zone
Total intensity = 1 speaker + 2 human activities
= 1 x 10⁻⁸ + 2 x (1 x 10-6 )
= 2.010 x 10⁻⁶ W/m2
SIL = 10 log (
I
Io
)
SIL = 10 log (2.01 x 10⁻⁶/ 1 x 10-12)
SIL = 63.03 dB
Zone 04: Treadmill area
Total intensity = 3 treadmill + 2 air duct + 1 speaker
= 3 x ( 1 x 10-4.4) + 2 x ( 1 x 10 -7) + 1 x 10-8
= 1.196 x 10⁻⁴ W/m2
SIL = 10 log (
I
Io
)
SIL = 10 log (1.196 x 10⁻⁴ / 1 x 10-12)
SIL = 80.78 dB
4.6.3 ANALYSIS AND EVALUATION
Zone 1: Rowling machine zone
Highest reading: 74dB
SIL = 10 log (
I1
Io
)
74 = 10 log (I1 / 1 x 10-12)
7.4 = log (I1 / 1 x 10-12)
107.4 = (I1 / 1 x 10-12)
I1 = 1 x 10-12 x 107.4
I1 = 1 x 10-4.6 W/m2
Lowest reading: 58dB
SIL = 10 log (
I2
Io
)
58 = 10 log (I2 / 1 x 10-12)
5.8 = 10 log (I2 / 1 x 10-12)
105.8 = (I2 / 1 x 10-12)
I2 = 1 x 10-12 x 105.8
I2 = 1 x 10-6.2 W/m2
Total intensity, I = 1 x 10-4.6 + 1 x 10-6.2 = 2.57 x 10 -5
SIL = 10 log (
I
Io
)
SIL = 10 log (2.57 x 10 -5/ 1 x 10-12)
SIL = 74.10 dB
The sound intensity level at Zone 1 is 74.10 dB.
Zone 2: Bike riding area
Highest reading: 77 dB
SIL = 10 log (
I1
Io
)
77 = 10 log (I1 / 1 x 10-12)
7.7 = log (I1 / 1 x 10-12)
107.7 = (I1 / 1 x 10-12)
I1 = 1 x 10-12 x 107.7
I1 = 1 x 10-4.3 W/m2
Lowest reading: 63 dB
SIL = 10 log (
I2
Io
)
63 = 10 log (I2 / 1 x 10-12)
6.3 = 10 log (I2 / 1 x 10-12)
106.3 = (I2 / 1 x 10-12)
I2 = 1 x 10-12 x 106.3
I2 = 1 x 10-5.7 W/m2
Total intensity, I = 1 x 10-4.3 + 1 x 10-5.7 = 5.21 x 10 -5
SIL = 10 log (
I
Io
)
SIL = 10 log (5.21 x 10 -5/ 1 x 10-12)
SIL = 77.17 dB
The sound intensity level at Zone 2 is 77.17 dB.
Zone 3: Multipurpose machine zone
Highest reading: 71 dB
SIL = 10 log (
I1
Io
)
71 = 10 log (I1 / 1 x 10-12)
7.1 = log (I1 / 1 x 10-12)
107.1 = (I1 / 1 x 10-12)
I1 = 1 x 10-12 x 107.1
I1 = 1 x 10-4.9 W/m2
Lowest reading: 54dB
SIL = 10 log (
I2
Io
)
54 = 10 log (I2 / 1 x 10-12)
5.4 = 10 log (I2 / 1 x 10-12)
105.4 = (I2 / 1 x 10-12)
I2 = 1 x 10-12 x 105.4
I2 = 1 x 10-6.6 W/m2
Total intensity, I = 1 x 10-4.9 + 1 x 10-6.6 = 1.28 x 10 -5
SIL = 10 log (
I
Io
)
SIL = 10 log (1.28 x 10 -5/ 1 x 10-12)
SIL = 71.07 dB
The sound intensity level at Zone 3 is 71.07 dB.
Zone 4: Treadmill area
Highest reading: 77 dB
SIL = 10 log (
I1
Io
)
77 = 10 log (I1 / 1 x 10-12)
7.7 = log (I1 / 1 x 10-12)
107.7 = (I1 / 1 x 10-12)
I1 = 1 x 10-12 x 107.7
I1 = 1 x 10-4.3 W/m2
Lowest reading: 62dB
SIL = 10 log (
I2
Io
)
62 = 10 log (I2 / 1 x 10-12)
6.2 = 10 log (I2 / 1 x 10-12)
106.2 = (I2 / 1 x 10-12)
I2 = 1 x 10-12 x 106.2
I2 = 1 x 10-5.8 W/m2
Total intensity, I = 1 x 10-4.3 + 1 x 10-5.8 = 5.17 x 10 -5
SIL = 10 log (
I
Io
)
SIL = 10 log (5.17 x 10 -5/ 1 x 10-12)
SIL = 77.13 dB
The sound intensity level at Zone 4 is 77.13 dB.
4.6.4 SOUND REDUCTION INDEX CALCULATION
Wall 1
Component Material Colour Finish Surface
Area, m2
Sound
Reduction
Index
(500Hz)
Transmission
Coefficient,
T =
1
log−1 (
R
10
)
Wall Concrete White Smooth 15 50 1 x 10⁻⁵
Mirror Glass Transparent Reflective 37.5 26 2.51 x 10⁻³
Sound Reduction index for each material of wall 1
T0=
(T1 x A1)+ (T2xA2)
A1+A2
T0= (1 x 10-5 x 15.0) + (2.51 x 10-3 x 37.5) / 15.0+37.5
T0= 1.80 x 10⁻³
R= 10 log (
1
T0
)
R= 10 log (
1
1.80 x 10⁻³
)
R= 10 log 555.56
R= 27.45 dB
The overall SRI for wall 1 is 27.45 dB
Sound Reduction Index: Wall 2
Component Material Colour Finish Surface
Area, m2
Sound
Reduction
Index
(500Hz)
Transmission
Coefficient,
T =
1
log−1 (
R
10
)
Wall Concrete White Smooth 33.3 50 1 x 10⁻⁵
Door Glass Transparent Reflective 3.0 31 7.94 x 10⁻⁴
Window Glass Transparent Reflective 1.2 26 2.51 x 10⁻³
Sound Reduction index for each material on wall 2
T0=
(T1 x A1)+ (T2xA2)+(T3 x A3)
A1+A2+A3
T0= (1 x 10-5 x 33.3) + (7.94 x 10-4 x 3.0) + (2.51 x 10-3 x 1.2) / 33.3+3.0+1.2
T0= 1.53x10⁻⁴
R= 10 log (
1
T0
)
R= 10 log (
1
1.53x10⁻⁴
)
R= 10 log 6535.95
R= 38.15 dB
The overall SRI for wall 2 is 38.15 dB
Sound Reduction Index: Wall 3
Component Material Colour Finish Surface
Area, m2
Sound
Reduction
Index
(500Hz)
Transmission
Coefficient,
T =
1
log−1 (
R
10
)
Wall Concrete White Smooth 47.7 50 1 x 10⁻⁵
Door Glass Transparent Reflective 3.0 31 7.94 x 10⁻⁴
Window Glass Transparent Reflective 1.8 26 2.51 x 10⁻³
Sound Reduction index for each material on wall 3
T0=
(T1 x A1)+ (T2xA2)+(T3 x A3)
A1+A2+A3
T0= (1 x 10-5 x 47.7) + (7.94 x 10-4 x 3.0) + (2.51 x 10-3 x 1.8) / 47.7+3.0+1.8
T0= 1.41x10⁻⁴
R= 10 log (
1
T0
)
R= 10 log (
1
1.41x10⁻⁴
)
R= 10 log 7092.20
R= 38.51 dB
The overall SRI for wall 3 is 38.51 dB
Sound Reduction Index: Wall 4
Component Material Colour Finish Surface
Area, m2
Sound
Reduction
Index
(500Hz)
Transmission
Coefficient,
T =
1
log−1 (
R
10
)
Wall Concrete White Smooth 19.5 50 1 x 10⁻⁵
Door Timber Brown Veneer 3.0 24 3.98 x 10⁻³
Sound Reduction index for each material on wall 4
T0=
(T1 x A1)+ (T2xA2)
A1+A2
T0= (1 x 10-5 x 19.5) + (3.98 x 10-3x 3.0) / 19.5+3.0
T0= 5.40x10⁻⁴
R= 10 log (
1
T0
)
R= 10 log (
1
5.40x10⁻⁴
)
R= 10 log 1851.85
R= 32.68 dB
The overall SRI for wall 4 is 32.68 dB
4.6.5 Reverberation Time Calculation
Gymnasium
Compone
nt
Materia
l
Colou
r
Finis
h
Surfac
e
Area,
m2
Absorpti
on
Coefficie
nt
(500Hz)
Sound
Absorpti
on 500Hz
(m2
sabin)
Absorpti
on
Coefficie
nt
(2000Hz)
Sound
Absorpti
on
2000Hz
(m2
sabin)
Wall Concret
e
Whit
e
Smo-
oth
115.5
0
0.05 5.78 0.05 5.78
Ceiling Plaster
Ceiling
Whit
e
Dott
-ed
110.2
5
0.02 2.21 0.04 4.41
Floor Cerami
c Tiles
Blue Smo-
oth
110.2
5
0.01 1.10 0.02 1.10
Door Timber Light
Brow
n
Vene
-er
3.0 0.06 0.18 0.10 0.30
Door Glass Trans
-
paren
t
Refle
- fec-
tive
6.0 0.06 0.36 0.03 0.18
Window Glass Trans
-
paren
t
Refle
- fec-
tive
3.0 0.18 0.54 0.07 0.21
Mirror Glass Trans
-
paren
t
Refle
- fec-
tive
37.5 0.06 2.25 0.03 1.13
People - - - 7 0.46 3.22 0.51 3.57
Total Absorption(A) 15.64 16.68
Sound Absorption of different materials in gymnasium
Reverberation Time when absorption coefficient at 500Hz,
Room volume of Gymnasium, V = 10.5x10.5x5
= 551.25m3
Reverberation Time = (0.16 x V) / A
= (0.16 x 551.25) / 15.64
= 5.64s
Reverberation Time when absorption coefficient at 2000Hz,
Room volume of Gymnasium, V = 10.5x10.5x5
= 551.25m3
Reverberation Time = (0.16 x V) / A
= (0.16 x 551.25) / 16.68
= 5.29s
4.7 Acoustic Analysis
Type of Occupancy &
activities
Recommended Design Sound
Level (dB)
Recommended
Reverberation Time (s)
Gymnasium 35 1.00
In referring to AS/ZS 2107:2000 standard for sound levels and reverberation times for
building interiors. We found out that the recommended design sound level should be
average 35 dB. The recommended reverberation time is 1.00s.
Zones Sound Pressure Level
(dB)
Reverberation Time(s)
500Hz
Reverberation Time(s)
2000Hz
Zone 1:Rowling
machine zone
74.10
5.64 5.29
Zone 2:Bike riding
area
77.17
Zone 3:Multipurpose
machine zone
71.07
Zone 4:Treadmill area 77.13
From the table above, conclusion had been made. All the 4 zones in the gymnasium
do not meet the minimum requirement of the acoustic standard. From the table above,
Zone 2 has the highest sound pressure level due to the amount of furniture, human activities
and external noise source from outdoor. However, Zone 3 has lowest sound pressure level
due to lacking of human activities and there is no air diffuser locate on the top of the zone.
Recommended reverberation time for gymnasium (<750m3) is 1.00s. However, the
reverberation time in this gymnasium is around 5.00s which does not meet the minimum
requirement. This is due to the materials cannot absorb sounds efficiently or this space is too
large with too less sound absorption materials.
In conclusion, the gymnasium area in this building is huge leap the acoustic standard.
Some improvement should be taken to lower down the sound pressure level in this
gymnasium.
4.8 PHYSIOTHERAPY CALCULATION
4.8.1 Calculation of sound intensity of indoor noise source
To obtain the intensity of the sound of each noise source in order
By using formula, SIL = 10 log ( I Io )
Where I = the intensity of sound being measured, (W/m2 )
Io = the intensity of the threshold of hearing, taken as 10-12 W/m2
BASIN
The maximum sound power level of the basin is 40 dB
SIL = 10 log (
Ib
Io
)
40 = 10 log (
Ib
Io
)
4.0 = log ( Ib / 1 x 10 -12)
104 = ( Ib / 1 x 10 -12)
Ib = 1 x 10-12 x 104
Ib = 1 x 10⁻⁸
The basin sound intensity is 1 x 10⁻⁸ W/m2
AIR SUPPLY DIFFUSER
The maximum sound power level of the diffuser is 50dB.
SIL = 10 log (
Iac
Io
)
50 = 10 log (
Iac
Io
)
5.0 = log ( Iac / 1 x 10 -12)
105 = ( Iac / 1 x 10 -12)
Iac = 1 x 10 -12 x 105
Iac = 1 x 10 -7
The air duct sound intensity is 1 x 10 -7 W/m2
TELEPHONE
The maximum sound power level of the telephone is 80 dB.
SIL = 10 log (
It
Io
)
80 = 10 log (
It
Io
)
8.0 = log ( It / 1 x 10 -12)
108.0 = ( It / 1 x 10 -12)
It = 1 x 10-12 x 108.0
It = 1 x 10⁻⁴
The telephone sound intensity is 1 x 10⁻⁴ W/m2
COMPUTER
The maximum sound power level of the computer is 35 dB.
SIL = 10 log (
Ic
Io
)
35 = 10 log (
Ic
Io
)
3.5 = log ( Ic / 1 x 10 -12)
103.5 = ( Ic / 1 x 10 -12)
Ic = 1 x 10-12 x 103.5
Ic = 1 x 10-8.5
The computer sound intensity is 1 x 10-8.5 W/m2
HP DESKJET PRINTER
The maximum sound power level of the deskjet printer is 50 dB.
SIL = 10 log (
Ip
Io
)
50 = 10 log (
Ip
Io
)
5.0 = log ( Ip / 1 x 10 -12)
105.0 = ( Ip / 1 x 10 -12)
Idp = 1 x 10-12 x 105.0
Idp = 1 x 10⁻⁷
The deskjet printer sound intensity is 1 x 10⁻⁷ W/m2
HP OFFICEJET PRINTER
The maximum sound power level of the officejet printer is 55 dB.
SIL = 10 log (
Ip
Io
)
55 = 10 log (
Ip
Io
)
5.5 = log ( Ip / 1 x 10 -12)
105.5 = ( Ip / 1 x 10 -12)
Iop = 1 x 10-12 x 105.5
Iop = 1 x 10-6.5
The officejet printer sound intensity is 1 x 10-6.5 W/m2
Human Activity
The maximum sound power level of the human activity is 50 dB.
SIL = 10 log (
Iha
Io
)
60 = 10 log (
Iha
Io
)
6.0 = log ( Iha / 1 x 10 -12)
106.0 = ( Iha / 1 x 10 -12)
Idp = 1 x 10-12 x 106.0
Idp = 1 x 10⁻⁶
The human activity sound intensity is 1 x 10⁻⁶ W/m2
4.8.2 CALCULATION OF SOUND LEVEL
Calculate to obtain the sound level in different zones to compare with the collected data.
Indoor Noise Sources Sound Intensity (w/m2)
Basin, Ib 1 x 10⁻⁸ W/m2
Air Supply Diffuser, Iac 1 x 10 -7 W/m2
Telephone, It 1 x 10 -4 W/m2
Computer, Ic 1 x 10 -8.5 W/m2
HP Deskjet Printer, Idp 1 x 10 -7 W/m2
HP Officejet Printer, Iop 1 x 10 -6.5 W/m2
Human Activity, Iha 1 x 10 -6 W/m2
The sound intensity of all indoor noise sources is calculated beforehand. The sound level of
different zones can be calculated using data shown in table above and these formulas,
I = I1+I2+I3+…+In and SIL = 10 log (
1
10
)
Where I = the intensity of sound being measured, (W/m2)
Io = the intensity of threshold of hearing, taken as 10-12 W/m2
Zone 1 : Robotic Gait Area (Worst case scenario)
(1 x Basin) + (10 x Air Diffuser) + (2 x Telephone) + (1 x Computer) + (1 x Officejet Printer) + (4
x Human Activity)
Total intensity, I = (1 x Ib) + (10 x Iac) + (2 x It) + (1 x Ic) + (1 x Iop) + (4 x Iha)
= (1 x 1 x 10-8) + (10 x 1 x 10 -7) + (2 x 1 x 10 -4) + (1 x 1 x 10 -8.5) +
(1 x 1 x 10 -6.5) + (4 x 1 x 10 -6)
= 2.05 x 10⁻⁴ W/m2
SIL = 10 log (
I
Io
)
= 10 log (2.05 x 10⁻⁴ / 1 x 10-12)
= 83.12 dB
Hence, the sound intensity level in this area is 83.12 dB.
Zone 2 : Open Therapy Area (Worst case scenario)
(2 x Basin) + (5 x Air Diffuser) + (1 x Computer) + (1 x Deskjet Printer) + (4 x Human Activity)
Total intensity, I = (2 x Ib) + (5 x Iac) + (1 x Ic) + (1 x Idp) + (4 x Iha)
= (2 x 1 x 10-8) + (5 x 1 x 10 -7) + (1 x 1 x 10 -8.5) +(1 x 1 x 10 -7) + (4 x 1 x 10 -6)
= 4.62 x 10⁻⁶ W/m2
SIL = 10 log (
I
Io
)
= 10 log (4.62 x 10⁻⁶ / 1 x 10-12)
= 66.65 dB
Hence, the sound intensity level in this area is 66.65 dB.
Zone 3 : Staff Base Area (Worst case scenario)
(1 x Basin) + (2 x Air Diffuser) + (2 x Telephone) + (3 x Computer) + (1 x Human Activity)
Total intensity, I = (1 x Ib) + (2 x Iac) + (2 x It) + (3 x Ic) + (1 x Iha)
= (1 x 1 x 10-8) + (2 x 1 x 10 -7) + (2 x 1 x 10 -4) + (3 x 1 x 10 -8.5) + (1 x 1 x 10 -6)
= 2.01x10⁻⁴ W/m2
SIL = 10 log (
I
Io
)
= 10 log (2.01 x 10⁻⁴ / 1 x 10-12)
= 83.03 dB
Hence, the sound intensity level in this area is 83.03 dB.
Zone 4 : Neuro Assessment Area (Worst case scenario)
(1 x Air Diffuser) + (1x Computer) + (1 x Human Activity)
Total intensity, I = (1 x Iac) + (1 x Ic) + (1 x Iha)
= (1 x 1 x 10 -7) + (1 x 1 x 10 -8.5) + (1 x 1 x 10 -6)
= 1.01x10⁻⁶ W/m2
SIL = 10 log (
I
Io
)
= 10 log (1.01x10⁻⁶ / 1 x 10-12)
= 60.04 dB
Hence, the sound intensity level in this area is 60.04 dB.
4.8.3 Analysis & Evaluation
Zone 1 : Robotic Gait Area
Highest Reading : 68 dB
SIL = 10 log (
I1
Io
)
68 = 10 log (I1 / 1 x 10-12)
106.8 = (I1 / 1 x 10-12)
I1 = 106.8 x 1 x 10-12
I1 = 6.31 x 10⁻⁶ W/m2
Lowest Reading : 51
SIL = 10 log (
I1
Io
)
51 = 10 log (I1 / 1 x 10-12)
105.1 = (I1 / 1 x 10-12)
I1 = 105.1 x 1 x 10-12
I1 = 1.26 x 10⁻⁷ W/m2
Total Intensity,
I = (6.31 x 10⁻⁶) + (1.26 x 10⁻⁷)
= 6.44 x 10⁻⁶ W/m2
SIL = 10 log (
I
Io
)
= 10 log (6.44 x 10⁻⁶ / 1 x 10-12)
= 68.09 dB
The sound intensity level at Robotic Gait Area (Zone 1) is 68.09 dB.
Zone 2 : Open Therapy Area
Highest Reading : 68 dB
SIL = 10 log (
I1
Io
)
68 = 10 log (I1 / 1 x 10-12)
106.8 = (I1 / 1 x 10-12)
I1 = 106.8 x 1 x 10-12
I1 = 6.31 x 10⁻⁶ W/m2
Lowest Reading : 52
SIL = 10 log (
I1
Io
)
52 = 10 log (I1 / 1 x 10-12)
105.2 = (I1 / 1 x 10-12)
I1 = 105.2 x 1 x 10-12
I1 = 1.59 x 10⁻⁷ W/m2
Total Intensity,
I = (6.31 x 10⁻⁶) + (1.59 x 10⁻⁷)
= 6.47 x 10⁻⁶ W/m2
SIL = 10 log (
I
Io
)
= 10 log (6.47 x 10⁻⁶ / 1 x 10-12)
= 68.11 dB
The sound intensity level at Open Therapy Area (Zone 2) is 68.11 dB.
Zone 3 : Staff Base Area
Highest Reading : 63 dB
SIL = 10 log (
I1
Io
)
63 = 10 log (I1 / 1 x 10-12)
106.3 = (I1 / 1 x 10-12)
I1 = 106.3 x 1 x 10-12
I1 = 2.00 x 10⁻⁶ W/m2
Lowest Reading : 51
SIL = 10 log (
I1
Io
)
51 = 10 log (I1 / 1 x 10-12)
105.1 = (I1 / 1 x 10-12)
I1 = 105.1 x 1 x 10-12
I1 = 1.26 x 10⁻⁷ W/m2
Total Intensity,
I = (2.00 x 10⁻⁶) + (1.26 x 10⁻⁷)
= 2.13 x 10⁻⁶ W/m2
SIL = 10 log (
I
Io
)
= 10 log (2.13 x 10⁻⁶ / 1 x 10-12)
= 63.28 dB
The sound intensity level at Staff Base Area (Zone 3) is 63.28 dB.
Zone 4 : Neuro Assessment Area
Highest Reading : 68 dB
SIL = 10 log (
I1
Io
)
68 = 10 log (I1 / 1 x 10-12)
106.8 = (I1 / 1 x 10-12)
I1 = 106.8 x 1 x 10-12
I1 = 6.31 x 10⁻⁶ W/m2
Lowest Reading : 56
SIL = 10 log (
I1
Io
)
56 = 10 log (I1 / 1 x 10-12)
105.6 = (I1 / 1 x 10-12)
I1 = 105.6 x 1 x 10-12
I1 = 3.98 x 10⁻⁷ W/m2
Total Intensity,
I = (6.31 x 10⁻⁶) + (3.98 x 10⁻⁷)
= 6.71 x 10⁻⁶ W/m2
SIL = 10 log (
I
Io
)
= 10 log (6.71 x 10⁻⁶ / 1 x 10-12)
= 68.27 dB
The sound intensity level at Neuro Assessment Area (Zone 4) is 68.27 dB.
4.8.4 SOUND REDUCTION INDEX CALCULATION
Wall 1
Sound Reduction index for each material on wall 1
Component Material Color Finish Surface
Area,m2
Sound
Reduction
Index
(500Hz)
Transmission
Coefficient, T
T=
𝟏
𝒍𝒐𝒈−𝟏
(
𝑹
𝟏𝟎
)
Wall Concrete Light blue Smooth 54.36 50 1.00 x 10⁻⁵
Window Glass Transparent Reflective 1.44 25 2.51 x 10⁻³
T0 =
( 𝑇1 𝑥 𝐴1)+(𝑇2 𝑥 𝐴2)
𝐴1+𝐴2
T0 = (1.00 x 10-5 x 54.36) + (2.51 x 10-3 x 1.44) / 54.36 + 1.44
= 4.16 x 10⁻³ / 55.8
= 7.46 x 10⁻⁵
SRI = 10 log (
1
𝑇0
)
= 10 log (1 / 7.46 x 10⁻⁵)
= 41.27 dB
Hence, the overall SRI is 41.27 dB.
Wall 2
Sound Reduction index for each material on wall 2
Component Material Color Finish Surface
Area,m2
Sound
Reduction
Index
(500Hz)
Transmission
Coefficient, T
T=
𝟏
𝒍𝒐𝒈−𝟏
(
𝑹
𝟏𝟎
)
Wall Concrete White Smooth 38.25 50 1.00 x 10⁻⁵
Door Glass Transparent Reflective 3.6 31 7.94 x 10⁻⁴
T0 =
( 𝑇1 𝑥 𝐴1)+(𝑇2 𝑥 𝐴2)
𝐴1+𝐴2
T0 = (1.00 x 10-5 x 38.25) + (7.94 x 10-4 x 3.6) / 38.25 + 3.6
= 3.24 x 10⁻³ / 41.85
= 7.74 x 10⁻⁵
SRI = 10 log (
1
𝑇0
)
= 10 log (1 / 7.74 x 10⁻⁵)
= 41.11 dB
Hence, the overall SRI is 41.11 dB.
Wall 3
Sound Reduction index for each material on wall 3
Component Material Color Finish Surface
Area,m2
Sound
Reduction
Index
(500Hz)
Transmission
Coefficient, T
T=
𝟏
𝒍𝒐𝒈−𝟏
(
𝑹
𝟏𝟎
)
Wall Concrete White Smooth 45 50 1.00 x 10⁻⁵
Window Glass Transparent Reflective 10.8 25 2.51 x 10⁻³
T0 =
( 𝑇1 𝑥 𝐴1)+(𝑇2 𝑥 𝐴2)
𝐴1+𝐴2
T0 = (1.00 x 10-5 x 45) + (2.51 x 10-3 x 10.8) / 45 + 10.8
= 0.028 / 55.8
= 5.02 x 10⁻⁴
SRI = 10 log (
1
𝑇0
)
= 10 log (1 / 5.02 x 10⁻⁴)
= 32.99 dB
Hence, the overall SRI is 32.99 dB.
Wall 4
Sound Reduction index for each material on wall 4
Component Material Color Finish Surface
Area,m2
Sound
Reduction
Index
(500Hz)
Transmission
Coefficient, T
T=
𝟏
𝒍𝒐𝒈−𝟏
(
𝑹
𝟏𝟎
)
Wall Concrete White Smooth 7.5 50 1.00 x 10⁻⁵
Door Timber Light Brown Smooth 1.8 24 3.98 x 10⁻³
T0 =
( 𝑇1 𝑥 𝐴1)+(𝑇2 𝑥 𝐴2)
𝐴1+𝐴2
T0 = (1.00 x 10-5 x 7.5) + (3.98 x 10-3 x 1.8) / 7.5 + 1.8
= 7.24 x 10⁻³ / 9.3
= 7.79 x 10⁻⁴
SRI = 10 log (
1
𝑇0
)
= 10 log (1 / 7.79 x 10⁻⁴)
= 31.09 dB
Hence, the overall SRI is 31.09 dB.
4.8.5 REVERBERATION TIME CALCULATION
Reverberation Time when absorption coefficient at 500Hz,
Room volume of Gymnasium, V = 13.5x18x3.1
= 753.3m3
Reverberation Time = (0.16 x V) / A
= (0.16 x 753.3) / 21.68
= 5.56s
Reverberation Time when absorption coefficient at 2000Hz,
Room volume of Gymnasium, V = 13.5x18x3.1
= 753.3m3
Reverberation Time = (0.16 x V) / A
= (0.16 x 753.3) / 28.09
= 4.29s
Componen
t
Material Color Finish Surfac
e Area,
m2
Absorptio
n
Coefficien
t
(500Hz)
Sound
Absorptio
n
(500Hz)
(m2 sabin)
Absorptio
n
Coefficien
t
(2000Hz)
Sound
Absorptio
n
(200Hz)
(m2 sabin)
Wall Concret
e
White,
Light Blue
Smooth 145.11 0.05 7.26 0.05 7.26
Ceiling Plaster
Ceiling
White Dotted 243 0.02 4.86 0.04 9.72
Floor Ceramic
Tiles
Blue Veneer 243 0.01 2.43 0.02 4.86
Door Timber Light
Brown
Veneer 1.8 0.06 0.11 0.10 0.18
Door Glass Transparen
t
Reflectiv
e
3.6 0.06 0.22 0.03 0.11
Window Glass Transparen
t
Reflectiv
e
12.24 0.18 2.2 0.07 0.86
People - - - 10 0.46 4.6 0.51 5.1
Total Absorption (A) 21.68 28.09
4.9 Acoustic Analysis for Physiotherapy
Type of Occupancy &
activities
Recommended Design
Sound Level (dB)
Recommended
Reverberation Time (s)
Physiotherapy 30 1.00 - 1.25
Table 4.2.6l: AS/NZS 2107:2000
In referring to AS/NZS 2107:2000 standard for sound levels and reverberation times for
building interiors. We found out that the recommended design sound level should be 40-
45dB range. As for the recommended reverberation time is 0.4 to 0.6s.
Zones Sound Pressure
Level (dB)
Reverberation
Time 500Hz (S)
Reverberation Time
2000Hz (S)
1 : Robotic Gait Area 68.09
5.56 4.29
2 : Open Therapy
Area
68.11
3 : Staff Base Area 63.28
4 : Neuro Assessment
Area
68.27
From the summary table above, we can conclude that all the 4 zones in the
Physiotherapy Room exceeds and even doubled up the minimum requirement of the
acoustic standard.
From the table, the Neuro Assessment Area is the one with the highest sound
pressure level. This is because there are 3 sides of walls covering it, where other spaces only
covered by 2 sides of walls. This cause the area become more enclosed and thus with higher
Sound Pressure. Besides, the Staff Base Area is the one having the lowest sound pressure
level. This is due to the fact that they are open space instead of enclosed space like the zone
4, Neuro Assessment Area.
As a conclusion, the Physiotherapy Room is designed in an open plan manners, all the zones
are connected and function as multipurpose. From the table we can understand that, the
sound pressure level in this room is actually greatly higher than the recommended standard.
In a nutshell, improvement such as acoustic ceiling and wall panel can be installed to better
improve the acoustic environment of the office.
5.0 Reference
Z. Maekawa, & P. Lord. (1994). Environmental and Architectural Acoustics. London: E &FN
Spon.
Salvan, G. S. (1999). Architectural Utilies 3. Quezon City: JMC Press.
Sound Is A Pressure Wave. (2015). Retrieved from The Physics Classroom:
http://www.physicsclassroom.com/class/sound/Lesson-1/Sound-is-a-PressureWave
Physics Communication Using Waves. (2014). Retrieved from BBC:
http://www.bbc.co.uk/bitesize/standard/physics/telecommunications/communi
cation_using_waves/revision/5/
M. B. (2010). Acoustics and Architectural Design. Taylor & Francis e-Library: New York
L. M. (2014). Architectural Acoustics. USA: Elsevier Inc.
Brooks, C. N. (2003). Architectural Acoustics. US: McFarland Company, Inc.
Absorption Coefficient Chart - Soundproof Your Home. (n.d.). Retrieved May 31, 2016, from
http://soundproofyourhome.com/absorption-coefficient-chart/

Contenu connexe

Tendances

Kinetic structures | B.arch
Kinetic structures | B.archKinetic structures | B.arch
Kinetic structures | B.archAs Per Design
 
Auditorium Acoustics
Auditorium Acoustics Auditorium Acoustics
Auditorium Acoustics mominzaki
 
a case study of acoustic design presentation
a case study of acoustic design presentationa case study of acoustic design presentation
a case study of acoustic design presentationYen Min Khor
 
Acp and glazing
Acp and glazingAcp and glazing
Acp and glazingaduiti
 
Structural systems notes
Structural systems notesStructural systems notes
Structural systems notesAaqib Iqbal
 
Geodesic dome{rishabh mishra}
Geodesic dome{rishabh mishra}Geodesic dome{rishabh mishra}
Geodesic dome{rishabh mishra}Rishabh Mishra
 
Some Acoustics Material
Some Acoustics MaterialSome Acoustics Material
Some Acoustics MaterialMayur Waghulde
 
False Ceiling Information and Joinary Details
False Ceiling Information and Joinary DetailsFalse Ceiling Information and Joinary Details
False Ceiling Information and Joinary DetailsMihirPawar5
 
Acoustic material market survey.pdf
Acoustic material market survey.pdfAcoustic material market survey.pdf
Acoustic material market survey.pdfNehaRanade2
 
Geodesic Dome - History and Construction
Geodesic Dome - History and ConstructionGeodesic Dome - History and Construction
Geodesic Dome - History and ConstructionAzra Maliha
 
Folded Plate structures
Folded Plate structures Folded Plate structures
Folded Plate structures rohan joshi
 

Tendances (20)

Kinetic structures | B.arch
Kinetic structures | B.archKinetic structures | B.arch
Kinetic structures | B.arch
 
Acoustic conference room
Acoustic conference roomAcoustic conference room
Acoustic conference room
 
Auditorium Acoustics
Auditorium Acoustics Auditorium Acoustics
Auditorium Acoustics
 
a case study of acoustic design presentation
a case study of acoustic design presentationa case study of acoustic design presentation
a case study of acoustic design presentation
 
Acp and glazing
Acp and glazingAcp and glazing
Acp and glazing
 
Acoustic material
Acoustic materialAcoustic material
Acoustic material
 
Structural systems notes
Structural systems notesStructural systems notes
Structural systems notes
 
Geodesic dome{rishabh mishra}
Geodesic dome{rishabh mishra}Geodesic dome{rishabh mishra}
Geodesic dome{rishabh mishra}
 
Some Acoustics Material
Some Acoustics MaterialSome Acoustics Material
Some Acoustics Material
 
Architectural acoustics
Architectural acousticsArchitectural acoustics
Architectural acoustics
 
False Ceiling Information and Joinary Details
False Ceiling Information and Joinary DetailsFalse Ceiling Information and Joinary Details
False Ceiling Information and Joinary Details
 
Amphitheatre.pptx
 Amphitheatre.pptx Amphitheatre.pptx
Amphitheatre.pptx
 
Acoustic material market survey.pdf
Acoustic material market survey.pdfAcoustic material market survey.pdf
Acoustic material market survey.pdf
 
FREI OTTO
FREI OTTOFREI OTTO
FREI OTTO
 
Basement
BasementBasement
Basement
 
Tensile Fabric Structures
Tensile Fabric StructuresTensile Fabric Structures
Tensile Fabric Structures
 
Geodesic Dome - History and Construction
Geodesic Dome - History and ConstructionGeodesic Dome - History and Construction
Geodesic Dome - History and Construction
 
Folded plates
Folded platesFolded plates
Folded plates
 
Folded Plate structures
Folded Plate structures Folded Plate structures
Folded Plate structures
 
Tensile structures
Tensile structuresTensile structures
Tensile structures
 

En vedette

Jill Schroeter Portfolio
Jill Schroeter PortfolioJill Schroeter Portfolio
Jill Schroeter Portfoliojillss00
 
Lighting Analysis Project 1
Lighting Analysis Project 1Lighting Analysis Project 1
Lighting Analysis Project 1J-Sern Phua
 
Assessment of Gearbox Fault DetectionUsing Vibration Signal Analysis and Acou...
Assessment of Gearbox Fault DetectionUsing Vibration Signal Analysis and Acou...Assessment of Gearbox Fault DetectionUsing Vibration Signal Analysis and Acou...
Assessment of Gearbox Fault DetectionUsing Vibration Signal Analysis and Acou...IOSR Journals
 
Compare and Constrast Essay
Compare and Constrast EssayCompare and Constrast Essay
Compare and Constrast EssayJ-Sern Phua
 
Thinking Architecture - Think Sheet Compiliation
Thinking Architecture - Think Sheet CompiliationThinking Architecture - Think Sheet Compiliation
Thinking Architecture - Think Sheet CompiliationJ-Sern Phua
 
Descriptive and Narrative Essay
Descriptive and Narrative EssayDescriptive and Narrative Essay
Descriptive and Narrative EssayJ-Sern Phua
 
Thinking Architecture - Personal Values Statement
Thinking Architecture - Personal Values StatementThinking Architecture - Personal Values Statement
Thinking Architecture - Personal Values StatementJ-Sern Phua
 
Asian Architecture: 8D House Case Study Paper
Asian Architecture: 8D House Case Study PaperAsian Architecture: 8D House Case Study Paper
Asian Architecture: 8D House Case Study Paperdouglasloon
 
B Science Report Project 2
B Science Report Project 2B Science Report Project 2
B Science Report Project 2J-Sern Phua
 
Aa Presentation slides
Aa Presentation slides Aa Presentation slides
Aa Presentation slides J.j. Hayashi
 
Literature Review of Pulau Ketam
Literature Review of Pulau KetamLiterature Review of Pulau Ketam
Literature Review of Pulau KetamJ-Sern Phua
 
THEORIES OF ARCHITECTURE AND URBANISM SYNOPSIS
THEORIES OF ARCHITECTURE AND URBANISM SYNOPSISTHEORIES OF ARCHITECTURE AND URBANISM SYNOPSIS
THEORIES OF ARCHITECTURE AND URBANISM SYNOPSISJ-Sern Phua
 
basic elements of landscape architechture
basic elements of landscape architechturebasic elements of landscape architechture
basic elements of landscape architechturezubda sajda
 
Building Structure Project B Report
Building Structure Project B ReportBuilding Structure Project B Report
Building Structure Project B ReportJ-Sern Phua
 
Acoustic emission sensors, equipment
Acoustic emission sensors, equipment Acoustic emission sensors, equipment
Acoustic emission sensors, equipment mboria
 
THEORIES OF ARCHITECTURE AND URBANISM PART B
THEORIES OF ARCHITECTURE AND URBANISM PART BTHEORIES OF ARCHITECTURE AND URBANISM PART B
THEORIES OF ARCHITECTURE AND URBANISM PART BJ-Sern Phua
 
Advanced elements of landscape
Advanced elements of landscapeAdvanced elements of landscape
Advanced elements of landscapeYasir Hussain
 

En vedette (20)

Jill Schroeter Portfolio
Jill Schroeter PortfolioJill Schroeter Portfolio
Jill Schroeter Portfolio
 
Lighting Analysis Project 1
Lighting Analysis Project 1Lighting Analysis Project 1
Lighting Analysis Project 1
 
Assessment of Gearbox Fault DetectionUsing Vibration Signal Analysis and Acou...
Assessment of Gearbox Fault DetectionUsing Vibration Signal Analysis and Acou...Assessment of Gearbox Fault DetectionUsing Vibration Signal Analysis and Acou...
Assessment of Gearbox Fault DetectionUsing Vibration Signal Analysis and Acou...
 
Compare and Constrast Essay
Compare and Constrast EssayCompare and Constrast Essay
Compare and Constrast Essay
 
Thinking Architecture - Think Sheet Compiliation
Thinking Architecture - Think Sheet CompiliationThinking Architecture - Think Sheet Compiliation
Thinking Architecture - Think Sheet Compiliation
 
Descriptive and Narrative Essay
Descriptive and Narrative EssayDescriptive and Narrative Essay
Descriptive and Narrative Essay
 
Thinking Architecture - Personal Values Statement
Thinking Architecture - Personal Values StatementThinking Architecture - Personal Values Statement
Thinking Architecture - Personal Values Statement
 
S.Psy journals
S.Psy journalsS.Psy journals
S.Psy journals
 
Asian Architecture: 8D House Case Study Paper
Asian Architecture: 8D House Case Study PaperAsian Architecture: 8D House Case Study Paper
Asian Architecture: 8D House Case Study Paper
 
B Science Report Project 2
B Science Report Project 2B Science Report Project 2
B Science Report Project 2
 
Aa Presentation slides
Aa Presentation slides Aa Presentation slides
Aa Presentation slides
 
Literature Review of Pulau Ketam
Literature Review of Pulau KetamLiterature Review of Pulau Ketam
Literature Review of Pulau Ketam
 
THEORIES OF ARCHITECTURE AND URBANISM SYNOPSIS
THEORIES OF ARCHITECTURE AND URBANISM SYNOPSISTHEORIES OF ARCHITECTURE AND URBANISM SYNOPSIS
THEORIES OF ARCHITECTURE AND URBANISM SYNOPSIS
 
Psy Report
Psy ReportPsy Report
Psy Report
 
basic elements of landscape architechture
basic elements of landscape architechturebasic elements of landscape architechture
basic elements of landscape architechture
 
Building Structure Project B Report
Building Structure Project B ReportBuilding Structure Project B Report
Building Structure Project B Report
 
Acoustic emission sensors, equipment
Acoustic emission sensors, equipment Acoustic emission sensors, equipment
Acoustic emission sensors, equipment
 
THEORIES OF ARCHITECTURE AND URBANISM PART B
THEORIES OF ARCHITECTURE AND URBANISM PART BTHEORIES OF ARCHITECTURE AND URBANISM PART B
THEORIES OF ARCHITECTURE AND URBANISM PART B
 
Lighting in Office
Lighting in Office Lighting in Office
Lighting in Office
 
Advanced elements of landscape
Advanced elements of landscapeAdvanced elements of landscape
Advanced elements of landscape
 

Similaire à Acoustic Analysis Project 1

Building Science II Project 1 - Acoustic Design
Building Science II Project 1 - Acoustic DesignBuilding Science II Project 1 - Acoustic Design
Building Science II Project 1 - Acoustic DesignNik Ahmad Munawwar Nik Din
 
Building Science Report
Building Science ReportBuilding Science Report
Building Science ReportLiew Hong Zhi
 
Master of Facilities management Thesis, June, 2015
Master of Facilities management Thesis, June, 2015Master of Facilities management Thesis, June, 2015
Master of Facilities management Thesis, June, 2015Joel Nyoni
 
Building science 2 report "Case study" on Acoustic Design.
Building science 2 report "Case study" on Acoustic Design.Building science 2 report "Case study" on Acoustic Design.
Building science 2 report "Case study" on Acoustic Design.Digital Space Consultancy Ltd
 
Building science 2
Building science 2Building science 2
Building science 2Baddy Peigun
 
B.science report 1.2
B.science report 1.2B.science report 1.2
B.science report 1.2Elaine Bong
 
Building science ii report
Building science ii reportBuilding science ii report
Building science ii reportWeng Chuan
 
Building Science 2
Building Science 2Building Science 2
Building Science 2Gertrude Lee
 
Building Science 1 (Project 1)
Building Science 1 (Project 1)Building Science 1 (Project 1)
Building Science 1 (Project 1)Soh Shing
 
FINAL REPORT PROJECT 1 LIGHTING AND ACOUSTIC PERFORMANCE.pdf
FINAL REPORT PROJECT 1 LIGHTING AND ACOUSTIC PERFORMANCE.pdfFINAL REPORT PROJECT 1 LIGHTING AND ACOUSTIC PERFORMANCE.pdf
FINAL REPORT PROJECT 1 LIGHTING AND ACOUSTIC PERFORMANCE.pdfOctonio Octonio
 
Lighting and Acoustic Performance - Absolute Coffee
Lighting and Acoustic Performance - Absolute CoffeeLighting and Acoustic Performance - Absolute Coffee
Lighting and Acoustic Performance - Absolute CoffeeOctonio Octonio
 
Building Science II Report
Building Science II ReportBuilding Science II Report
Building Science II ReportVansC
 
An Acoustic Case Study on Calvary Convention Centre Report
An Acoustic Case Study on Calvary Convention Centre ReportAn Acoustic Case Study on Calvary Convention Centre Report
An Acoustic Case Study on Calvary Convention Centre Reportdouglasloon
 
Ccc case study report taylor's university
Ccc case study report taylor's universityCcc case study report taylor's university
Ccc case study report taylor's universityKohSungJie
 
Ccc case study report taylor's university
Ccc case study report taylor's universityCcc case study report taylor's university
Ccc case study report taylor's universityChengWei Chia
 
Building science ii project 1 compiled
Building science ii project 1 compiledBuilding science ii project 1 compiled
Building science ii project 1 compiledDevinchi
 

Similaire à Acoustic Analysis Project 1 (20)

Final report
Final reportFinal report
Final report
 
Building Science II Project 1 - Acoustic Design
Building Science II Project 1 - Acoustic DesignBuilding Science II Project 1 - Acoustic Design
Building Science II Project 1 - Acoustic Design
 
03.Acoustic_Eduardo
03.Acoustic_Eduardo03.Acoustic_Eduardo
03.Acoustic_Eduardo
 
Sound final
Sound finalSound final
Sound final
 
Building Science Report
Building Science ReportBuilding Science Report
Building Science Report
 
Finaleeee bscience 2
Finaleeee bscience 2Finaleeee bscience 2
Finaleeee bscience 2
 
Master of Facilities management Thesis, June, 2015
Master of Facilities management Thesis, June, 2015Master of Facilities management Thesis, June, 2015
Master of Facilities management Thesis, June, 2015
 
Building science 2 report "Case study" on Acoustic Design.
Building science 2 report "Case study" on Acoustic Design.Building science 2 report "Case study" on Acoustic Design.
Building science 2 report "Case study" on Acoustic Design.
 
Building science 2
Building science 2Building science 2
Building science 2
 
B.science report 1.2
B.science report 1.2B.science report 1.2
B.science report 1.2
 
Building science ii report
Building science ii reportBuilding science ii report
Building science ii report
 
Building Science 2
Building Science 2Building Science 2
Building Science 2
 
Building Science 1 (Project 1)
Building Science 1 (Project 1)Building Science 1 (Project 1)
Building Science 1 (Project 1)
 
FINAL REPORT PROJECT 1 LIGHTING AND ACOUSTIC PERFORMANCE.pdf
FINAL REPORT PROJECT 1 LIGHTING AND ACOUSTIC PERFORMANCE.pdfFINAL REPORT PROJECT 1 LIGHTING AND ACOUSTIC PERFORMANCE.pdf
FINAL REPORT PROJECT 1 LIGHTING AND ACOUSTIC PERFORMANCE.pdf
 
Lighting and Acoustic Performance - Absolute Coffee
Lighting and Acoustic Performance - Absolute CoffeeLighting and Acoustic Performance - Absolute Coffee
Lighting and Acoustic Performance - Absolute Coffee
 
Building Science II Report
Building Science II ReportBuilding Science II Report
Building Science II Report
 
An Acoustic Case Study on Calvary Convention Centre Report
An Acoustic Case Study on Calvary Convention Centre ReportAn Acoustic Case Study on Calvary Convention Centre Report
An Acoustic Case Study on Calvary Convention Centre Report
 
Ccc case study report taylor's university
Ccc case study report taylor's universityCcc case study report taylor's university
Ccc case study report taylor's university
 
Ccc case study report taylor's university
Ccc case study report taylor's universityCcc case study report taylor's university
Ccc case study report taylor's university
 
Building science ii project 1 compiled
Building science ii project 1 compiledBuilding science ii project 1 compiled
Building science ii project 1 compiled
 

Plus de J-Sern Phua

THEORIES OF ARCHITECTURE AND URBANISM PART A
THEORIES OF ARCHITECTURE AND URBANISM PART ATHEORIES OF ARCHITECTURE AND URBANISM PART A
THEORIES OF ARCHITECTURE AND URBANISM PART AJ-Sern Phua
 
Research Report Presentation
Research Report PresentationResearch Report Presentation
Research Report PresentationJ-Sern Phua
 
IDJ 2 - Cans and Can'ts
IDJ 2 - Cans and Can'tsIDJ 2 - Cans and Can'ts
IDJ 2 - Cans and Can'tsJ-Sern Phua
 
ENBE PROJECT 2 REPORT
ENBE PROJECT 2 REPORTENBE PROJECT 2 REPORT
ENBE PROJECT 2 REPORTJ-Sern Phua
 
Research development
Research developmentResearch development
Research developmentJ-Sern Phua
 
ICI Company Profile
ICI Company ProfileICI Company Profile
ICI Company ProfileJ-Sern Phua
 
ICI Project Brief
ICI Project BriefICI Project Brief
ICI Project BriefJ-Sern Phua
 
ENBE - Experiencing Nature
ENBE - Experiencing NatureENBE - Experiencing Nature
ENBE - Experiencing NatureJ-Sern Phua
 
ENBE - The Journal 1
ENBE - The Journal 1ENBE - The Journal 1
ENBE - The Journal 1J-Sern Phua
 
CTS - Ideal Journal 1
CTS - Ideal Journal 1CTS - Ideal Journal 1
CTS - Ideal Journal 1J-Sern Phua
 
CTS - Sounds of Daily Objects
CTS - Sounds of Daily ObjectsCTS - Sounds of Daily Objects
CTS - Sounds of Daily ObjectsJ-Sern Phua
 

Plus de J-Sern Phua (15)

THEORIES OF ARCHITECTURE AND URBANISM PART A
THEORIES OF ARCHITECTURE AND URBANISM PART ATHEORIES OF ARCHITECTURE AND URBANISM PART A
THEORIES OF ARCHITECTURE AND URBANISM PART A
 
BUSINESS
BUSINESSBUSINESS
BUSINESS
 
PSY Proposal
PSY ProposalPSY Proposal
PSY Proposal
 
Pulau Ketam
Pulau KetamPulau Ketam
Pulau Ketam
 
Research Report Presentation
Research Report PresentationResearch Report Presentation
Research Report Presentation
 
IDJ 2 - Cans and Can'ts
IDJ 2 - Cans and Can'tsIDJ 2 - Cans and Can'ts
IDJ 2 - Cans and Can'ts
 
ENBE PROJECT 2 REPORT
ENBE PROJECT 2 REPORTENBE PROJECT 2 REPORT
ENBE PROJECT 2 REPORT
 
Research development
Research developmentResearch development
Research development
 
ICI Company Profile
ICI Company ProfileICI Company Profile
ICI Company Profile
 
ICI Project Brief
ICI Project BriefICI Project Brief
ICI Project Brief
 
ICI Magazine
ICI MagazineICI Magazine
ICI Magazine
 
ENBE - Experiencing Nature
ENBE - Experiencing NatureENBE - Experiencing Nature
ENBE - Experiencing Nature
 
ENBE - The Journal 1
ENBE - The Journal 1ENBE - The Journal 1
ENBE - The Journal 1
 
CTS - Ideal Journal 1
CTS - Ideal Journal 1CTS - Ideal Journal 1
CTS - Ideal Journal 1
 
CTS - Sounds of Daily Objects
CTS - Sounds of Daily ObjectsCTS - Sounds of Daily Objects
CTS - Sounds of Daily Objects
 

Dernier

BigBuy dropshipping via API with DroFx.pptx
BigBuy dropshipping via API with DroFx.pptxBigBuy dropshipping via API with DroFx.pptx
BigBuy dropshipping via API with DroFx.pptxolyaivanovalion
 
Brighton SEO | April 2024 | Data Storytelling
Brighton SEO | April 2024 | Data StorytellingBrighton SEO | April 2024 | Data Storytelling
Brighton SEO | April 2024 | Data StorytellingNeil Barnes
 
代办国外大学文凭《原版美国UCLA文凭证书》加州大学洛杉矶分校毕业证制作成绩单修改
代办国外大学文凭《原版美国UCLA文凭证书》加州大学洛杉矶分校毕业证制作成绩单修改代办国外大学文凭《原版美国UCLA文凭证书》加州大学洛杉矶分校毕业证制作成绩单修改
代办国外大学文凭《原版美国UCLA文凭证书》加州大学洛杉矶分校毕业证制作成绩单修改atducpo
 
Apidays Singapore 2024 - Building Digital Trust in a Digital Economy by Veron...
Apidays Singapore 2024 - Building Digital Trust in a Digital Economy by Veron...Apidays Singapore 2024 - Building Digital Trust in a Digital Economy by Veron...
Apidays Singapore 2024 - Building Digital Trust in a Digital Economy by Veron...apidays
 
Smarteg dropshipping via API with DroFx.pptx
Smarteg dropshipping via API with DroFx.pptxSmarteg dropshipping via API with DroFx.pptx
Smarteg dropshipping via API with DroFx.pptxolyaivanovalion
 
VIP High Profile Call Girls Amravati Aarushi 8250192130 Independent Escort Se...
VIP High Profile Call Girls Amravati Aarushi 8250192130 Independent Escort Se...VIP High Profile Call Girls Amravati Aarushi 8250192130 Independent Escort Se...
VIP High Profile Call Girls Amravati Aarushi 8250192130 Independent Escort Se...Suhani Kapoor
 
定制英国白金汉大学毕业证(UCB毕业证书) 成绩单原版一比一
定制英国白金汉大学毕业证(UCB毕业证书)																			成绩单原版一比一定制英国白金汉大学毕业证(UCB毕业证书)																			成绩单原版一比一
定制英国白金汉大学毕业证(UCB毕业证书) 成绩单原版一比一ffjhghh
 
RA-11058_IRR-COMPRESS Do 198 series of 1998
RA-11058_IRR-COMPRESS Do 198 series of 1998RA-11058_IRR-COMPRESS Do 198 series of 1998
RA-11058_IRR-COMPRESS Do 198 series of 1998YohFuh
 
Delhi Call Girls CP 9711199171 ☎✔👌✔ Whatsapp Hard And Sexy Vip Call
Delhi Call Girls CP 9711199171 ☎✔👌✔ Whatsapp Hard And Sexy Vip CallDelhi Call Girls CP 9711199171 ☎✔👌✔ Whatsapp Hard And Sexy Vip Call
Delhi Call Girls CP 9711199171 ☎✔👌✔ Whatsapp Hard And Sexy Vip Callshivangimorya083
 
Unveiling Insights: The Role of a Data Analyst
Unveiling Insights: The Role of a Data AnalystUnveiling Insights: The Role of a Data Analyst
Unveiling Insights: The Role of a Data AnalystSamantha Rae Coolbeth
 
Ukraine War presentation: KNOW THE BASICS
Ukraine War presentation: KNOW THE BASICSUkraine War presentation: KNOW THE BASICS
Ukraine War presentation: KNOW THE BASICSAishani27
 
VIP Call Girls Service Miyapur Hyderabad Call +91-8250192130
VIP Call Girls Service Miyapur Hyderabad Call +91-8250192130VIP Call Girls Service Miyapur Hyderabad Call +91-8250192130
VIP Call Girls Service Miyapur Hyderabad Call +91-8250192130Suhani Kapoor
 
Halmar dropshipping via API with DroFx
Halmar  dropshipping  via API with DroFxHalmar  dropshipping  via API with DroFx
Halmar dropshipping via API with DroFxolyaivanovalion
 
CebaBaby dropshipping via API with DroFX.pptx
CebaBaby dropshipping via API with DroFX.pptxCebaBaby dropshipping via API with DroFX.pptx
CebaBaby dropshipping via API with DroFX.pptxolyaivanovalion
 
Midocean dropshipping via API with DroFx
Midocean dropshipping via API with DroFxMidocean dropshipping via API with DroFx
Midocean dropshipping via API with DroFxolyaivanovalion
 
Week-01-2.ppt BBB human Computer interaction
Week-01-2.ppt BBB human Computer interactionWeek-01-2.ppt BBB human Computer interaction
Week-01-2.ppt BBB human Computer interactionfulawalesam
 
Low Rate Call Girls Bhilai Anika 8250192130 Independent Escort Service Bhilai
Low Rate Call Girls Bhilai Anika 8250192130 Independent Escort Service BhilaiLow Rate Call Girls Bhilai Anika 8250192130 Independent Escort Service Bhilai
Low Rate Call Girls Bhilai Anika 8250192130 Independent Escort Service BhilaiSuhani Kapoor
 

Dernier (20)

Delhi 99530 vip 56974 Genuine Escort Service Call Girls in Kishangarh
Delhi 99530 vip 56974 Genuine Escort Service Call Girls in  KishangarhDelhi 99530 vip 56974 Genuine Escort Service Call Girls in  Kishangarh
Delhi 99530 vip 56974 Genuine Escort Service Call Girls in Kishangarh
 
BigBuy dropshipping via API with DroFx.pptx
BigBuy dropshipping via API with DroFx.pptxBigBuy dropshipping via API with DroFx.pptx
BigBuy dropshipping via API with DroFx.pptx
 
Brighton SEO | April 2024 | Data Storytelling
Brighton SEO | April 2024 | Data StorytellingBrighton SEO | April 2024 | Data Storytelling
Brighton SEO | April 2024 | Data Storytelling
 
代办国外大学文凭《原版美国UCLA文凭证书》加州大学洛杉矶分校毕业证制作成绩单修改
代办国外大学文凭《原版美国UCLA文凭证书》加州大学洛杉矶分校毕业证制作成绩单修改代办国外大学文凭《原版美国UCLA文凭证书》加州大学洛杉矶分校毕业证制作成绩单修改
代办国外大学文凭《原版美国UCLA文凭证书》加州大学洛杉矶分校毕业证制作成绩单修改
 
Apidays Singapore 2024 - Building Digital Trust in a Digital Economy by Veron...
Apidays Singapore 2024 - Building Digital Trust in a Digital Economy by Veron...Apidays Singapore 2024 - Building Digital Trust in a Digital Economy by Veron...
Apidays Singapore 2024 - Building Digital Trust in a Digital Economy by Veron...
 
Smarteg dropshipping via API with DroFx.pptx
Smarteg dropshipping via API with DroFx.pptxSmarteg dropshipping via API with DroFx.pptx
Smarteg dropshipping via API with DroFx.pptx
 
VIP High Profile Call Girls Amravati Aarushi 8250192130 Independent Escort Se...
VIP High Profile Call Girls Amravati Aarushi 8250192130 Independent Escort Se...VIP High Profile Call Girls Amravati Aarushi 8250192130 Independent Escort Se...
VIP High Profile Call Girls Amravati Aarushi 8250192130 Independent Escort Se...
 
定制英国白金汉大学毕业证(UCB毕业证书) 成绩单原版一比一
定制英国白金汉大学毕业证(UCB毕业证书)																			成绩单原版一比一定制英国白金汉大学毕业证(UCB毕业证书)																			成绩单原版一比一
定制英国白金汉大学毕业证(UCB毕业证书) 成绩单原版一比一
 
RA-11058_IRR-COMPRESS Do 198 series of 1998
RA-11058_IRR-COMPRESS Do 198 series of 1998RA-11058_IRR-COMPRESS Do 198 series of 1998
RA-11058_IRR-COMPRESS Do 198 series of 1998
 
Delhi Call Girls CP 9711199171 ☎✔👌✔ Whatsapp Hard And Sexy Vip Call
Delhi Call Girls CP 9711199171 ☎✔👌✔ Whatsapp Hard And Sexy Vip CallDelhi Call Girls CP 9711199171 ☎✔👌✔ Whatsapp Hard And Sexy Vip Call
Delhi Call Girls CP 9711199171 ☎✔👌✔ Whatsapp Hard And Sexy Vip Call
 
VIP Call Girls Service Charbagh { Lucknow Call Girls Service 9548273370 } Boo...
VIP Call Girls Service Charbagh { Lucknow Call Girls Service 9548273370 } Boo...VIP Call Girls Service Charbagh { Lucknow Call Girls Service 9548273370 } Boo...
VIP Call Girls Service Charbagh { Lucknow Call Girls Service 9548273370 } Boo...
 
Unveiling Insights: The Role of a Data Analyst
Unveiling Insights: The Role of a Data AnalystUnveiling Insights: The Role of a Data Analyst
Unveiling Insights: The Role of a Data Analyst
 
Ukraine War presentation: KNOW THE BASICS
Ukraine War presentation: KNOW THE BASICSUkraine War presentation: KNOW THE BASICS
Ukraine War presentation: KNOW THE BASICS
 
VIP Call Girls Service Miyapur Hyderabad Call +91-8250192130
VIP Call Girls Service Miyapur Hyderabad Call +91-8250192130VIP Call Girls Service Miyapur Hyderabad Call +91-8250192130
VIP Call Girls Service Miyapur Hyderabad Call +91-8250192130
 
Halmar dropshipping via API with DroFx
Halmar  dropshipping  via API with DroFxHalmar  dropshipping  via API with DroFx
Halmar dropshipping via API with DroFx
 
CebaBaby dropshipping via API with DroFX.pptx
CebaBaby dropshipping via API with DroFX.pptxCebaBaby dropshipping via API with DroFX.pptx
CebaBaby dropshipping via API with DroFX.pptx
 
Midocean dropshipping via API with DroFx
Midocean dropshipping via API with DroFxMidocean dropshipping via API with DroFx
Midocean dropshipping via API with DroFx
 
Sampling (random) method and Non random.ppt
Sampling (random) method and Non random.pptSampling (random) method and Non random.ppt
Sampling (random) method and Non random.ppt
 
Week-01-2.ppt BBB human Computer interaction
Week-01-2.ppt BBB human Computer interactionWeek-01-2.ppt BBB human Computer interaction
Week-01-2.ppt BBB human Computer interaction
 
Low Rate Call Girls Bhilai Anika 8250192130 Independent Escort Service Bhilai
Low Rate Call Girls Bhilai Anika 8250192130 Independent Escort Service BhilaiLow Rate Call Girls Bhilai Anika 8250192130 Independent Escort Service Bhilai
Low Rate Call Girls Bhilai Anika 8250192130 Independent Escort Service Bhilai
 

Acoustic Analysis Project 1

  • 1. TABLE OF CONTENT ABSTRACT 1.0 INTRODUCTION 1.1 Objectives 1.2 Site Study 1.2.1 Introduction 1.2.2 Site Selection Reasons 1.2.3 Measured Drawings 1.3 Methodology 1.3.1 Identification of Existing Conditions 2.0 LITERATURE REVIEW 2.1 Acoustics 2.1.1 Sound 2.1.2 Amplitude, Wavelength & Frequency 2.1.3 Common Sound in Decibels 2.1.4 Acoustics in Architecture 2.1.5 Acoustics Standard ANSI (2008) S12.2-2008 3.0 PRECEDENT STUDY 3.1 Introduction to Building 3.2 Statistical Analysis Method/Questionnaire 3.3 Formula for Acoustic Analysis Calculation 4.0 CASE STUDY 4.1 Site Study and Zoning 4.2 External Noise Source 4.3 Interior Noise Sources 4.3.1 SPACE 1: Gymnasium 4.3.1.1 Existing Equipment 4.3.1.2 Cooling System 4.3.1.3 Human noise
  • 2. 4.3.2 SPACE 2: Physiology Room 4.3.2.1 Existing Equipment 4.3.2.2 Cooling System 4.3.2.3 Human noise 4.4 Tabulation & Interpretation of Data 4.5 Acoustic Fixtures and Specifications 4.6 Gymasium calculation 4.6.1 Calculation of sound intensity of indoor noise source 4.6.2 The calculation of sound level 4.6.3 Analysis & Evaluation 4.6.4 Sound reduction index calculation 4.6.5 Reverberation Time Calculation 4.7 Acoustic Analysis 4.8 PHYSIOTHERAPY CALCULATION 4.8.1 Calculation of sound intensity of indoor noise source 4.8.2 The calculation of sound level 4.8.3 Analysis & Evaluation 4.8.4 Sound reduction index calculation 4.8.5 Reverberation Time Calculation 4.9 Acoustic Analysis for Physiotherapy 5.0 References
  • 3. ABSTRACT This report consists of the study of how acoustics affects the environment and we chose to conduct at SOSCO Rehabilitation Centre, Melacca as our case study. In order to carry out the performance evaluation, we’ve requested the proper floor plans from the facilities management that govern the site buildings, and also produced elevations and sections for the ease of data collection. Collection of acoustics data is carried out at the functioning hour of the building to quantify and qualify the existing condition of the site. All the data and drawings collected were then further used to carry out an analysis to study the performance of the building. A list of figures are used as well and a list of references is provided at the end of the report for the ease of navigation. Additionally, photographs were also taken on site to further identify acoustics sources of the chosen area.
  • 4. 1.0 INTRODUCTION Acoustics study on buildings and spaces within is crucial as considerations of maintaining and having good quality noise control. Some key spaces that requires critical acoustics control are galleries, concert halls, restaurants and many other spaces. In short, this project is design to expose and introduce us acoustics requirement in a suggested space. In a group of 7, we have chosen SOSCO Rehabilitation Centre, Melacca, as our site study. We have conducted several site visits to ensure the success of the project outcome. Measurement and calculations of acoustic readings and site measurement are done during the visits and after the visit respectively. Lastly, we concluded the analysis based on the results of our findings and observations.
  • 5. 1.1 Objectives and Aim 1. To observe and understand acoustics and its characteristics. 2. To understand acoustic requirement in a suggested place. 3. To determine the different types of acoustics throughout this project. 4. To determine the characteristics and function of sound within the intended space. 5. To critically report and analyze the space and suggest remedies to improve acoustic qualities within the space. The primary objective of this project is to impart the understanding of acoustics and characteristic and requirement in a suggested space, thereby determine their functions and various factors affecting it. With the data collected and the relevant knowledge, an analysis is to perform to evaluate the suggested space with a critical mindset. Besides that, understanding the acoustics elements and existing arrangement helps in determining the acoustics characteristics that is reflected in the data collection by using certain methods or calculations. Backed up with precedent studies, drawing comparison with the site study, our precedent studies will aid in achieving all the objectives above.
  • 6. 1.2 Site Study Case Study: SOCSO Rehabilitation Center, Melacca. Identification of space: Gymnasium rehabilitation space and physiotherapy room. Address: Pusat Rehabilitasi Perkeso Lot PT 7263 [H.S (D) 18923] Bandar Hijau, Hang Tuah Jaya, Melaka, 75450, Malaysia.
  • 7. 1.2.1 Introduction SOCSO Rehabilitation Centre is located at Bandar Hijau, Hang Tuah Jaya, Melacca. It is a rehabilitation centre that consists of an administration block and 5 extended wings. Namely, the Gymnasium, Vocational, Physiotherapy, Hydrotherapy and the Speech and Audio therapy. Under SOCSO’s "Return to Work" program, disabled patients undergo physical and vocational rehabilitation in order to rejoin the workforce. The architect, Anuar Aziz Architect, called this process the "Journey to Healing," where the patients will heal physically and mentally, and lead a normal working life after the rehabilitation process. The allied health institute will provide the skilled personnel. This green certified complex was designed with ‘nature’ and ‘spirituality’ integral to the healing process. A universal access- for-all concept and Malaysian Standard for disabled access is applied throughout. The concept of the building is each building is given a different identity according to functions and ease of way finding. Calming and soft colors are utilized throughout the complex. 1.2.2 Site Selection Reasons Based on observation, the building provides sufficient functional spaces to conduct out an analysis on acoustics conditions. The gymnasium space and the physiological therapy space with specific function would help us develop an understanding on how noise is controlled to achieve comfort for users based on different programs and functions. In terms of acoustics properties, the gymnasium space and the physiological therapy space can be categorized into semi enclosed space, though the gymnasium has a higher ceiling space compared to the other. Numerous noise producing elements are spotted within the spaces ranging from electronic equipments, to human activities.
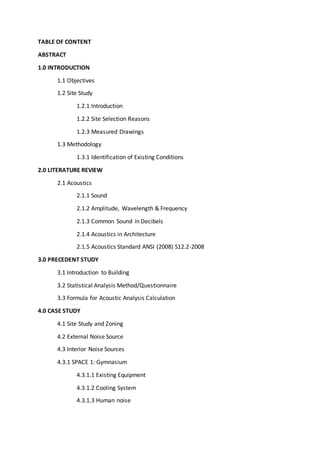
  • 8. 1.2.3 Measured Drawings Figure 1 Floor Plan of Physiotherapy Room
  • 9. Figure 2 Floor plan of Gymnasium Room
  • 10. 2.0 Precedent study 2.1. INTRODUCTION TO BUILDING Bahcesehir University (BAU) Office, Besiktas Campus Figure 3.1a: Bahcesehir University Besiktas Campus Located in Istanbul, Turkey, the Bahcesehir University is a well-known private educational institution with its main campus located at the edge of the Bosporus in Besiktas. The university consists of eight faculties: a school of language, two vocational schools and four institutes that provide post graduate education, with an average of 17,000 registered students studying at the university. The space that we chose to study is the Faculty of Architecture & Design of Bahcesehir University. Position on the side of the shore, the buildings are formed in the shape of long, narrow rectangular prisms sited very close and are interconnected to one another. These buildings face the garden on the shore and sea with one of their narrow sides, and a high traffic artery of the city with the other. The office occupies half of the 1st floor of Block B and faces sea on the East, and other two neighboring buildings (buildings A and C) on the north and south. There are two different types of office spaces in the faculty. Open-offices with semi-enclosed partitions in the central area and are used by the teaching/research assistants; the closed offices surrounding the central area from three sides, shared by two or three academic staff. Closed offices, with regard to their orientation as A and B, create 2 subgroups within closed office type.
  • 11. 2.1.2.1 ACOUSTIC COMFORT/NOISE CONTROL Measurements regarding the environmental noise in the space were taken in the morning (10.00-10.11), noon (13.00-13.12) and afternoon (16.26-16.36) times of a working day, with the windows tightly shut. These periods were decided in reference to the standard working hours of the users. Sound level meter and sound pressure equipment were set in the middle of the office and central area 150cm above the ground level and then used for comparison with the standards IEC 60651 and IEC 60804. Placement of equipment for acoustic analysis 2.3.1.2 ACOUSTIC COMFORT Acoustics data of Office A close to neighboring building
  • 12. Acoustics data of Office A campus side Acoustics data of Office B
  • 13. Acoustics data of Office C 2.4 Conclusion Through the data taken in the precedent study of the Bahcesehir University Besiktas Campus, the result was shown that the environmental noise appeared to influence the perception of environmental quality. Mentioned by the occupants, they show dissatisfaction of acoustic privacy and noise control due to the fact that they are not that well maintained as it is affect by environmental elements. The findings shown a slightly higher environmental sound intensity compared to optimum human condition, the poor choice of materials for sound buffering is one of the key faults of providing bad acoustic control
  • 14. 3.0 Research Methodology 3.1 Acoustic Analysis Sound and Acoustic analysis plays a role in the acoustic design performance, sound and noise level of the noise. The analysis might involve in design fine tuning in order to achieve the standards from ANSI, IEC and ISO. A simple and fairly effective method of diagnostics can be performed with acoustical equipment. Description of Equipment (a) Acoustic Measuring Equipment (Digital Sound Level Meter) Figure 3.2.1.1: Sound Level Meter GENERAL SPECIFICATIONS Measurement 30 – 130 dB Resolution 0.1 dB Measured Quantities Linearity Characteristics of “A” frequency weighting network meet IEC 61672 class 2. Under 94 dB input signal, the accuracy are: 31.5 Hz ± 3.5 dB 63 Hz ± 2.5 dB 125 Hz ± 2.0 dB 250 Hz ± 1.9 dB 500 Hz ± 1.9 dB 1 K Hz ± 1.4 dB 2 K Hz ± 2.6 dB 4 K Hz ± 3.6 dB 8 K Hz ± 5.6 dB Power Supply Alkaline or heavy duty DC 1.5V battery (UM3, AA) x 6 PCs. Or equivalent. DC 9V adapter input. (AC/ DC power adapter is optional). Dimension 245mm x 68mm x 45mm Weight 489g Table 3.2.1.2: General Specification of Sound Level Meter
  • 15. (b) Smartphone [OnePlus One] An additional recording device is used as a result comparison with the digital sound level meter. A median result is then obtained and will be averaged in the recordings table. (c) Measuring Tape The tape is used to measure a constant height of the position of the sound meter and the grids established for the area, which is at 1m and 1.5m respectively. The height is taken on one person as reference to obtain an accurate reading. (d) Camera [a7ii Sony] The camera is used to record pictures on the source of sound in the cafe and its surrounding.
  • 16. 3.2 Data Collection Method The sound level meter is placed at the same height of 1m for each point in order to obtain an accurate reading. This is done to ensure the consistency of the measurements taken. The readings were recorded on a plotted plan with 1.5m x 1.5m gridlines. Noises produced by us students are kept to the minimum to obtain the best sound reading result. Procedure 1. Push the Power Switch to switch on the device. 2. Record the dB value by holding the Noise Indicator at 1m height, approximately at waist height (ear level while sitting). 3. Record the data displayed on the device. 4. Repeat 2 and 3 until all data are completed. Figure 3.2.2.1: Position of Noise Indicator at 1 meter 3.3 Formula for Acoustic Analysis Calculation Calculation for Reverberation Time: Reverberation time (RT) is a measure of the amount of reverberation in a space and equal to the time required for the level of a steady sound to decay by 60dB after the sound has stopped. The decay rate depends on the amount of sound absorption in a room, the room geometry, and the frequency of the sound. Reverberation Time Formula: RT = (0.16 x V) divide by A Where, V = Volume of space A = Total absorption (Material Covering Area x Absorption Coefficient)
  • 17. 4.0 CASE STUDY 4.1 Site Study and Zoning 4.2 External Noise Source Located in a fairly remote part of Bemban, Malacca, the SOCSO Rehabilitation Centre is located between Jalan Kolej Yayasan Saad and Lebuhraya Utara-Selatan. Since Kolej Yayasan Saad is located before SOCSO Rehabilitation Centre, vehicle circulation in front of our site is quite minimal as the other end only consists of a solar farm and an undeveloped road end. Contrastingly, the back of SOCSO Rehabilitation Centre is the North-South highway where many high-speed vehicles pass by the site. But through our observation, SOCSO Rehabilitation Centre is surrounded by lush and thick greeneries, thus constant audible sound ranges just around 50 to 55 dB, an optimum sound range for the disables to concentrate on their trainings without any unnecessary disturbances. Annotated plan to indicate noise sources
  • 18. 4.3 Interior Noise Sources 4.3.1 SPACE 1: Gymnasium Inside the SOCSO Rehabilitation Centre’s gymnasium space, we noticed some of the key activities of patients exercising and trainings with their nurses’ guidance. From our observation, we noted that the music produced by the speakers have quite a high sound intensity level in our chosen analysis space, whereas the sound from the gym equipment and air diffusers are moderate, but noticeable. Sound produced by human activities are considered low as patients tend to train individually and independently according to their own pace, thus there was not much human interaction in the area unless by-standing nurses come to aid.
  • 19. 4.3.1.1 Existing Equipment Some of the most significant noise produced are the electronic equipment present in our chosen gymnasium area. The one component that constantly produces noise are the speakers located on corner walls of the room, blasting catchy beats to motivate the patients. Occasional rings from the phone can be heard as well for the nurses to communicate any reports of situations. Lastly, electronic gym equipment such as the treadmills can be quite noticeable when used by patients during operating hours of the day, whereas other equipment such as the bicycle and lifting training produces little to none noises.
  • 20. 4.3.1.2 Cooling System Though moderate, yet noticeable, the noise generated through air diffusers are located at higher walls can be heard constantly. Noise produce from the air diffusers are related by the velocity settings of the AHU panels, and for the gymnasium, it was considered set slightly above average due to the fact that users will experience body heat during a workout. Thus the higher velocity of conditioned air caused a slightly higher intensity of sound level, yet it is still not till extend which will distract the users.
  • 21. 4.3.1.3 Human noise Human interactions are considered low in the gymnasium due to the fact that most users attended as independent individuals, and not as groups. As so, human communications such as chats and discussions are very faint, thus overall human noises are low. Only a few grudges sounds can be heard during their activities.
  • 22. 4.3.2 SPACE 2: Physiology Room The other chosen area of SOCSO Rehabilitation Centre’s is the Physiology room, located a block away from the gymnasium. Comparison wise, the sound intensity level of the Physiology room is slightly higher than the gymnasium, but with dissimilar factors. From our observation, we noticed that the room ceiling is much lower than the gymnasium, thus noise reflection is closer and more obvious. The most significant noises are produced by human noises due to the fact that this particular room consists of many patients interacting with their nurses. The sound from electronic equipment and air diffusers are too moderate yet noticeable as well.
  • 23. 4.3.2.1 Existing Equipment Unlike the gymnasium, the physiology room consists of numerous of specialized equipment that measures and records the patients’ performance, although those are seldom used and only used on critical phases only, thus they do not contribute much to the noise level of the area. Other electronic equipment are the phones and computers which occasionally rings when used by nurses to communicate with other departments.
  • 24. 4.3.2.2 Cooling System The ceiling fixed air diffusers present in the physiology room has the similar moderate yet noticeable noise produced, but not till extend which will distract and affect the patients and nurses who are using the facilities as communication is still clearly hearable. Additionally, we observed that the velocity is not as powerful as the gymnasium as not much vigorous activities present in this block. Thus, a fainter noise is produced in this area.
  • 25. 4.3.2.3 Human noise For this room, human noise level is considerably higher than the gymnasium due to the higher amount of patient and nurse interactions. Usually new patients are introduced to this area first to familiarize themselves to their trainings, thus many nurses are present to guide and motivate them to push through their limits, and therefore occasional loud grudges sound may occur in this area of space.
  • 26. 4.4 Tabulation & Interpretation of Data The colors present in the table represent the respective zones in the colored plan. The reading were taken at the level of 1m
  • 27. 4.5 Acoustic Fixtures and Specifications Item Type Treadmill Product Name Biodex RTM600 Weight 179kg Sound Pressure Level 70 – 76 dB Dimension 218cm x 69cm x 137cm Placement Floor Item Type Telephone Product Name Panasonic KX-550B Weight 495g Sound Pressure Level 80dB Dimension 9.6cm x 15cm x 20cm Placement Table Item Type Speaker Product Name JBL CSS-1S/T Weight 2000g Sound Pressure Level 96 – 106 dB Dimension 29cm x 15.9cm x 14.3cm Placement Wall – Product Name Air Diffusers Sound Pressure Level 40 – 50 dB Placement Wall Item Type Basin Sound Pressure Level 40 dB Dimension 47cm x 55 cm Placement Wall
  • 28. Item Type Computer Monitor Product Name HP V241p LED Monitor Weight 3, 855g Sound Pressure Level 35 dB Dimension 55cm x 40cm x 5cm Placement Table Item Type Printer Product Name HP Deskjet 1000 series Weight 3,600g Sound Pressure Level 50 dB Dimension 42.7cm x 30cm x 15.5cm Placement Table Item Type Printer Product Name HP Officejet 4000 series Weight 6,000g Sound Pressure Level 55 dB Dimension 44.5cm x 33cm x 17cm Placement Wall
  • 29. 4.6 GYMNASIUM CALCULATION 4.6.1 Calculation of sound intensity of indoor noise source To obtain the intensity of the sound of each noise source in order By using formula, SIL = 10 log ( I Io ) Where I = the intensity of sound being measured, (W/m2 ) Io = the intensity of the threshold of hearing, taken as 10-12 W/m2
  • 30. Air diffuser The maximum sound power level of the air diffuser is 50dB. SIL = 10 log ( Iac Io ) 50 = 10 log ( Iac Io ) 5.0 = log ( Iac / 1 x 10 -12) 105 = ( Iac / 1 x 10 -12) Iac = 1 x 10 -12 x 105 Iac = 1 x 10 -7 The air diffuser sound intensity is 1 x 10 -7 W/m2 Treadmill Biodex RTM 600 The maximum sound power level of the treadmill is 76dB. SIL = 10 log ( Itm Io ) 76 = 10 log ( Itm Io ) 7.6 = log ( Itm / 1 x 10 -12) 107.6 = ( Itm / 1 x 10 -12) Itm = 1 x 10-12 x 107.6 Itm = 1 x 10-4.4 The treadmill sound intensity is 1 x 10-4.4 W/m2
  • 31. Telephone Panasonic KX-550B The maximum sound power level of the telephone is 80 dB. SIL = 10 log ( It Io ) 80 = 10 log ( It Io ) 8.0 = log ( It / 1 x 10 -12) 108.0 = ( It / 1 x 10 -12) It = 1 x 10-12 x 108.0 It = 1 x 10⁻⁴ The telephone sound intensity is 1 x 10⁻⁴ W/m2 Speaker JBL CSS-1S/T The maximum sound power level of the speaker is 106dB SIL = 10 log ( Is Io ) 106 = 10 log ( Is Io ) 10.6 = log ( Is / 1 x 10 -12) 1010.6 = ( Is / 1 x 10 -12) Is = 1 x 10-12 x 1010.6 Is = 1 x 10-1.4 The speaker sound intensity is 1 x 10-1.4 W/m2
  • 32. Basin The maximum sound power level of the basin is 40 dB SIL = 10 log ( Ib Io ) 40 = 10 log ( Ib Io ) 4.0 = log ( Ib / 1 x 10 -12) 104 = ( Ib / 1 x 10 -12) Ib = 1 x 10-12 x 104 Ib = 1 x 10⁻⁸ The basin sound intensity is 1 x 10⁻⁸ W/m2 Human Activities The maximum sound power level of the human activities is around 60 dB. SIL = 10 log ( Ir Io ) 60 = 10 log ( Ir Io ) 6.0 = log ( Ir / 1 x 10 -12) 106.0 = ( Ir / 1 x 10 -12) Ir = 1 x 10-12 x 106.0 Ir = 1 x 10⁻⁶ The human activities sound intensity is 1 x 10⁻⁶ W/m2
  • 33. 4.6.2 THE CALCULATION OF SOUND LEVEL Air diffuser 1 x 10⁻⁷ W/m2 Telephone Panasonic KX-550B 1 x 10⁻⁴ W/m2 Basin 1 x 10⁻⁸ W/m2 Speaker JBL CSS-1S/T 1 x 10-1.4 W/m2 Treadmill Biodex RTM600 1 x 10-4.4 W/m2 Human Activities 1 x 10⁻⁶ W/m2 The sound intensity of all indoor noise sources is calculated beforehand. The sound level of different zones can be calculated using data shown in table above and these formula, I = I1 + I2 + I3 +…+ In and SIL = 10 log ( I Io ). Where I = the intensity of sound being measured, (W/m2 ) Io = the intensity of the threshold of hearing, taken as 10-12 W/m2
  • 34. Zone 01: Rowling machine zone Total intensity = 2 x air duct + 1 telephone + 2 human activities = 2 x ( 1 x 10 -7) + 1 x 10⁻⁴ + 2 x (1 x 10-6 ) = 1.022 x 10 -4 W/m2 SIL = 10 log ( I Io ) SIL = 10 log ( 1.022 X 10⁻⁴ / 1 x 10-12) SIL = 80.10 dB
  • 35. Zone 02: Bike riding area Total intensity = 3 x air duct + 1 basin + 1 speaker + 2 human activities = 3 x ( 1 x 10 -7) + 1 x 10⁻⁸ + 1 x 10⁻⁸ + 2 x (1 x 10-6 ) = 2.320 x 10 -6 SIL = 10 log ( I Io ) SIL = 10 log ( 2.320x10⁻⁶ / 1 x 10-12) SIL = 63.65 dB
  • 36. Zone 03: Multipurpose machine zone Total intensity = 1 speaker + 2 human activities = 1 x 10⁻⁸ + 2 x (1 x 10-6 ) = 2.010 x 10⁻⁶ W/m2 SIL = 10 log ( I Io ) SIL = 10 log (2.01 x 10⁻⁶/ 1 x 10-12) SIL = 63.03 dB
  • 37. Zone 04: Treadmill area Total intensity = 3 treadmill + 2 air duct + 1 speaker = 3 x ( 1 x 10-4.4) + 2 x ( 1 x 10 -7) + 1 x 10-8 = 1.196 x 10⁻⁴ W/m2 SIL = 10 log ( I Io ) SIL = 10 log (1.196 x 10⁻⁴ / 1 x 10-12) SIL = 80.78 dB
  • 38. 4.6.3 ANALYSIS AND EVALUATION Zone 1: Rowling machine zone Highest reading: 74dB SIL = 10 log ( I1 Io ) 74 = 10 log (I1 / 1 x 10-12) 7.4 = log (I1 / 1 x 10-12) 107.4 = (I1 / 1 x 10-12) I1 = 1 x 10-12 x 107.4 I1 = 1 x 10-4.6 W/m2 Lowest reading: 58dB SIL = 10 log ( I2 Io ) 58 = 10 log (I2 / 1 x 10-12) 5.8 = 10 log (I2 / 1 x 10-12) 105.8 = (I2 / 1 x 10-12) I2 = 1 x 10-12 x 105.8 I2 = 1 x 10-6.2 W/m2 Total intensity, I = 1 x 10-4.6 + 1 x 10-6.2 = 2.57 x 10 -5 SIL = 10 log ( I Io ) SIL = 10 log (2.57 x 10 -5/ 1 x 10-12) SIL = 74.10 dB The sound intensity level at Zone 1 is 74.10 dB.
  • 39. Zone 2: Bike riding area Highest reading: 77 dB SIL = 10 log ( I1 Io ) 77 = 10 log (I1 / 1 x 10-12) 7.7 = log (I1 / 1 x 10-12) 107.7 = (I1 / 1 x 10-12) I1 = 1 x 10-12 x 107.7 I1 = 1 x 10-4.3 W/m2 Lowest reading: 63 dB SIL = 10 log ( I2 Io ) 63 = 10 log (I2 / 1 x 10-12) 6.3 = 10 log (I2 / 1 x 10-12) 106.3 = (I2 / 1 x 10-12) I2 = 1 x 10-12 x 106.3 I2 = 1 x 10-5.7 W/m2 Total intensity, I = 1 x 10-4.3 + 1 x 10-5.7 = 5.21 x 10 -5 SIL = 10 log ( I Io ) SIL = 10 log (5.21 x 10 -5/ 1 x 10-12) SIL = 77.17 dB The sound intensity level at Zone 2 is 77.17 dB.
  • 40. Zone 3: Multipurpose machine zone Highest reading: 71 dB SIL = 10 log ( I1 Io ) 71 = 10 log (I1 / 1 x 10-12) 7.1 = log (I1 / 1 x 10-12) 107.1 = (I1 / 1 x 10-12) I1 = 1 x 10-12 x 107.1 I1 = 1 x 10-4.9 W/m2 Lowest reading: 54dB SIL = 10 log ( I2 Io ) 54 = 10 log (I2 / 1 x 10-12) 5.4 = 10 log (I2 / 1 x 10-12) 105.4 = (I2 / 1 x 10-12) I2 = 1 x 10-12 x 105.4 I2 = 1 x 10-6.6 W/m2 Total intensity, I = 1 x 10-4.9 + 1 x 10-6.6 = 1.28 x 10 -5 SIL = 10 log ( I Io ) SIL = 10 log (1.28 x 10 -5/ 1 x 10-12) SIL = 71.07 dB The sound intensity level at Zone 3 is 71.07 dB.
  • 41. Zone 4: Treadmill area Highest reading: 77 dB SIL = 10 log ( I1 Io ) 77 = 10 log (I1 / 1 x 10-12) 7.7 = log (I1 / 1 x 10-12) 107.7 = (I1 / 1 x 10-12) I1 = 1 x 10-12 x 107.7 I1 = 1 x 10-4.3 W/m2 Lowest reading: 62dB SIL = 10 log ( I2 Io ) 62 = 10 log (I2 / 1 x 10-12) 6.2 = 10 log (I2 / 1 x 10-12) 106.2 = (I2 / 1 x 10-12) I2 = 1 x 10-12 x 106.2 I2 = 1 x 10-5.8 W/m2 Total intensity, I = 1 x 10-4.3 + 1 x 10-5.8 = 5.17 x 10 -5 SIL = 10 log ( I Io ) SIL = 10 log (5.17 x 10 -5/ 1 x 10-12) SIL = 77.13 dB The sound intensity level at Zone 4 is 77.13 dB.
  • 42. 4.6.4 SOUND REDUCTION INDEX CALCULATION Wall 1 Component Material Colour Finish Surface Area, m2 Sound Reduction Index (500Hz) Transmission Coefficient, T = 1 log−1 ( R 10 ) Wall Concrete White Smooth 15 50 1 x 10⁻⁵ Mirror Glass Transparent Reflective 37.5 26 2.51 x 10⁻³ Sound Reduction index for each material of wall 1
  • 43. T0= (T1 x A1)+ (T2xA2) A1+A2 T0= (1 x 10-5 x 15.0) + (2.51 x 10-3 x 37.5) / 15.0+37.5 T0= 1.80 x 10⁻³ R= 10 log ( 1 T0 ) R= 10 log ( 1 1.80 x 10⁻³ ) R= 10 log 555.56 R= 27.45 dB The overall SRI for wall 1 is 27.45 dB
  • 44. Sound Reduction Index: Wall 2 Component Material Colour Finish Surface Area, m2 Sound Reduction Index (500Hz) Transmission Coefficient, T = 1 log−1 ( R 10 ) Wall Concrete White Smooth 33.3 50 1 x 10⁻⁵ Door Glass Transparent Reflective 3.0 31 7.94 x 10⁻⁴ Window Glass Transparent Reflective 1.2 26 2.51 x 10⁻³ Sound Reduction index for each material on wall 2
  • 45. T0= (T1 x A1)+ (T2xA2)+(T3 x A3) A1+A2+A3 T0= (1 x 10-5 x 33.3) + (7.94 x 10-4 x 3.0) + (2.51 x 10-3 x 1.2) / 33.3+3.0+1.2 T0= 1.53x10⁻⁴ R= 10 log ( 1 T0 ) R= 10 log ( 1 1.53x10⁻⁴ ) R= 10 log 6535.95 R= 38.15 dB The overall SRI for wall 2 is 38.15 dB
  • 46. Sound Reduction Index: Wall 3 Component Material Colour Finish Surface Area, m2 Sound Reduction Index (500Hz) Transmission Coefficient, T = 1 log−1 ( R 10 ) Wall Concrete White Smooth 47.7 50 1 x 10⁻⁵ Door Glass Transparent Reflective 3.0 31 7.94 x 10⁻⁴ Window Glass Transparent Reflective 1.8 26 2.51 x 10⁻³ Sound Reduction index for each material on wall 3
  • 47. T0= (T1 x A1)+ (T2xA2)+(T3 x A3) A1+A2+A3 T0= (1 x 10-5 x 47.7) + (7.94 x 10-4 x 3.0) + (2.51 x 10-3 x 1.8) / 47.7+3.0+1.8 T0= 1.41x10⁻⁴ R= 10 log ( 1 T0 ) R= 10 log ( 1 1.41x10⁻⁴ ) R= 10 log 7092.20 R= 38.51 dB The overall SRI for wall 3 is 38.51 dB
  • 48. Sound Reduction Index: Wall 4 Component Material Colour Finish Surface Area, m2 Sound Reduction Index (500Hz) Transmission Coefficient, T = 1 log−1 ( R 10 ) Wall Concrete White Smooth 19.5 50 1 x 10⁻⁵ Door Timber Brown Veneer 3.0 24 3.98 x 10⁻³ Sound Reduction index for each material on wall 4
  • 49. T0= (T1 x A1)+ (T2xA2) A1+A2 T0= (1 x 10-5 x 19.5) + (3.98 x 10-3x 3.0) / 19.5+3.0 T0= 5.40x10⁻⁴ R= 10 log ( 1 T0 ) R= 10 log ( 1 5.40x10⁻⁴ ) R= 10 log 1851.85 R= 32.68 dB The overall SRI for wall 4 is 32.68 dB
  • 50. 4.6.5 Reverberation Time Calculation Gymnasium Compone nt Materia l Colou r Finis h Surfac e Area, m2 Absorpti on Coefficie nt (500Hz) Sound Absorpti on 500Hz (m2 sabin) Absorpti on Coefficie nt (2000Hz) Sound Absorpti on 2000Hz (m2 sabin) Wall Concret e Whit e Smo- oth 115.5 0 0.05 5.78 0.05 5.78 Ceiling Plaster Ceiling Whit e Dott -ed 110.2 5 0.02 2.21 0.04 4.41 Floor Cerami c Tiles Blue Smo- oth 110.2 5 0.01 1.10 0.02 1.10 Door Timber Light Brow n Vene -er 3.0 0.06 0.18 0.10 0.30 Door Glass Trans - paren t Refle - fec- tive 6.0 0.06 0.36 0.03 0.18 Window Glass Trans - paren t Refle - fec- tive 3.0 0.18 0.54 0.07 0.21 Mirror Glass Trans - paren t Refle - fec- tive 37.5 0.06 2.25 0.03 1.13 People - - - 7 0.46 3.22 0.51 3.57 Total Absorption(A) 15.64 16.68 Sound Absorption of different materials in gymnasium
  • 51. Reverberation Time when absorption coefficient at 500Hz, Room volume of Gymnasium, V = 10.5x10.5x5 = 551.25m3 Reverberation Time = (0.16 x V) / A = (0.16 x 551.25) / 15.64 = 5.64s Reverberation Time when absorption coefficient at 2000Hz, Room volume of Gymnasium, V = 10.5x10.5x5 = 551.25m3 Reverberation Time = (0.16 x V) / A = (0.16 x 551.25) / 16.68 = 5.29s
  • 52. 4.7 Acoustic Analysis Type of Occupancy & activities Recommended Design Sound Level (dB) Recommended Reverberation Time (s) Gymnasium 35 1.00 In referring to AS/ZS 2107:2000 standard for sound levels and reverberation times for building interiors. We found out that the recommended design sound level should be average 35 dB. The recommended reverberation time is 1.00s. Zones Sound Pressure Level (dB) Reverberation Time(s) 500Hz Reverberation Time(s) 2000Hz Zone 1:Rowling machine zone 74.10 5.64 5.29 Zone 2:Bike riding area 77.17 Zone 3:Multipurpose machine zone 71.07 Zone 4:Treadmill area 77.13 From the table above, conclusion had been made. All the 4 zones in the gymnasium do not meet the minimum requirement of the acoustic standard. From the table above, Zone 2 has the highest sound pressure level due to the amount of furniture, human activities and external noise source from outdoor. However, Zone 3 has lowest sound pressure level due to lacking of human activities and there is no air diffuser locate on the top of the zone. Recommended reverberation time for gymnasium (<750m3) is 1.00s. However, the reverberation time in this gymnasium is around 5.00s which does not meet the minimum requirement. This is due to the materials cannot absorb sounds efficiently or this space is too large with too less sound absorption materials. In conclusion, the gymnasium area in this building is huge leap the acoustic standard. Some improvement should be taken to lower down the sound pressure level in this gymnasium.
  • 53. 4.8 PHYSIOTHERAPY CALCULATION 4.8.1 Calculation of sound intensity of indoor noise source To obtain the intensity of the sound of each noise source in order By using formula, SIL = 10 log ( I Io ) Where I = the intensity of sound being measured, (W/m2 ) Io = the intensity of the threshold of hearing, taken as 10-12 W/m2 BASIN The maximum sound power level of the basin is 40 dB SIL = 10 log ( Ib Io ) 40 = 10 log ( Ib Io ) 4.0 = log ( Ib / 1 x 10 -12) 104 = ( Ib / 1 x 10 -12) Ib = 1 x 10-12 x 104 Ib = 1 x 10⁻⁸ The basin sound intensity is 1 x 10⁻⁸ W/m2 AIR SUPPLY DIFFUSER The maximum sound power level of the diffuser is 50dB. SIL = 10 log ( Iac Io ) 50 = 10 log ( Iac Io ) 5.0 = log ( Iac / 1 x 10 -12) 105 = ( Iac / 1 x 10 -12) Iac = 1 x 10 -12 x 105 Iac = 1 x 10 -7 The air duct sound intensity is 1 x 10 -7 W/m2
  • 54. TELEPHONE The maximum sound power level of the telephone is 80 dB. SIL = 10 log ( It Io ) 80 = 10 log ( It Io ) 8.0 = log ( It / 1 x 10 -12) 108.0 = ( It / 1 x 10 -12) It = 1 x 10-12 x 108.0 It = 1 x 10⁻⁴ The telephone sound intensity is 1 x 10⁻⁴ W/m2 COMPUTER The maximum sound power level of the computer is 35 dB. SIL = 10 log ( Ic Io ) 35 = 10 log ( Ic Io ) 3.5 = log ( Ic / 1 x 10 -12) 103.5 = ( Ic / 1 x 10 -12) Ic = 1 x 10-12 x 103.5 Ic = 1 x 10-8.5 The computer sound intensity is 1 x 10-8.5 W/m2
  • 55. HP DESKJET PRINTER The maximum sound power level of the deskjet printer is 50 dB. SIL = 10 log ( Ip Io ) 50 = 10 log ( Ip Io ) 5.0 = log ( Ip / 1 x 10 -12) 105.0 = ( Ip / 1 x 10 -12) Idp = 1 x 10-12 x 105.0 Idp = 1 x 10⁻⁷ The deskjet printer sound intensity is 1 x 10⁻⁷ W/m2 HP OFFICEJET PRINTER The maximum sound power level of the officejet printer is 55 dB. SIL = 10 log ( Ip Io ) 55 = 10 log ( Ip Io ) 5.5 = log ( Ip / 1 x 10 -12) 105.5 = ( Ip / 1 x 10 -12) Iop = 1 x 10-12 x 105.5 Iop = 1 x 10-6.5 The officejet printer sound intensity is 1 x 10-6.5 W/m2 Human Activity The maximum sound power level of the human activity is 50 dB. SIL = 10 log ( Iha Io ) 60 = 10 log ( Iha Io ) 6.0 = log ( Iha / 1 x 10 -12) 106.0 = ( Iha / 1 x 10 -12) Idp = 1 x 10-12 x 106.0 Idp = 1 x 10⁻⁶ The human activity sound intensity is 1 x 10⁻⁶ W/m2
  • 56. 4.8.2 CALCULATION OF SOUND LEVEL Calculate to obtain the sound level in different zones to compare with the collected data. Indoor Noise Sources Sound Intensity (w/m2) Basin, Ib 1 x 10⁻⁸ W/m2 Air Supply Diffuser, Iac 1 x 10 -7 W/m2 Telephone, It 1 x 10 -4 W/m2 Computer, Ic 1 x 10 -8.5 W/m2 HP Deskjet Printer, Idp 1 x 10 -7 W/m2 HP Officejet Printer, Iop 1 x 10 -6.5 W/m2 Human Activity, Iha 1 x 10 -6 W/m2 The sound intensity of all indoor noise sources is calculated beforehand. The sound level of different zones can be calculated using data shown in table above and these formulas, I = I1+I2+I3+…+In and SIL = 10 log ( 1 10 ) Where I = the intensity of sound being measured, (W/m2) Io = the intensity of threshold of hearing, taken as 10-12 W/m2
  • 57. Zone 1 : Robotic Gait Area (Worst case scenario) (1 x Basin) + (10 x Air Diffuser) + (2 x Telephone) + (1 x Computer) + (1 x Officejet Printer) + (4 x Human Activity) Total intensity, I = (1 x Ib) + (10 x Iac) + (2 x It) + (1 x Ic) + (1 x Iop) + (4 x Iha) = (1 x 1 x 10-8) + (10 x 1 x 10 -7) + (2 x 1 x 10 -4) + (1 x 1 x 10 -8.5) + (1 x 1 x 10 -6.5) + (4 x 1 x 10 -6) = 2.05 x 10⁻⁴ W/m2 SIL = 10 log ( I Io ) = 10 log (2.05 x 10⁻⁴ / 1 x 10-12) = 83.12 dB Hence, the sound intensity level in this area is 83.12 dB.
  • 58. Zone 2 : Open Therapy Area (Worst case scenario) (2 x Basin) + (5 x Air Diffuser) + (1 x Computer) + (1 x Deskjet Printer) + (4 x Human Activity) Total intensity, I = (2 x Ib) + (5 x Iac) + (1 x Ic) + (1 x Idp) + (4 x Iha) = (2 x 1 x 10-8) + (5 x 1 x 10 -7) + (1 x 1 x 10 -8.5) +(1 x 1 x 10 -7) + (4 x 1 x 10 -6) = 4.62 x 10⁻⁶ W/m2 SIL = 10 log ( I Io ) = 10 log (4.62 x 10⁻⁶ / 1 x 10-12) = 66.65 dB Hence, the sound intensity level in this area is 66.65 dB.
  • 59. Zone 3 : Staff Base Area (Worst case scenario) (1 x Basin) + (2 x Air Diffuser) + (2 x Telephone) + (3 x Computer) + (1 x Human Activity) Total intensity, I = (1 x Ib) + (2 x Iac) + (2 x It) + (3 x Ic) + (1 x Iha) = (1 x 1 x 10-8) + (2 x 1 x 10 -7) + (2 x 1 x 10 -4) + (3 x 1 x 10 -8.5) + (1 x 1 x 10 -6) = 2.01x10⁻⁴ W/m2 SIL = 10 log ( I Io ) = 10 log (2.01 x 10⁻⁴ / 1 x 10-12) = 83.03 dB Hence, the sound intensity level in this area is 83.03 dB.
  • 60. Zone 4 : Neuro Assessment Area (Worst case scenario) (1 x Air Diffuser) + (1x Computer) + (1 x Human Activity) Total intensity, I = (1 x Iac) + (1 x Ic) + (1 x Iha) = (1 x 1 x 10 -7) + (1 x 1 x 10 -8.5) + (1 x 1 x 10 -6) = 1.01x10⁻⁶ W/m2 SIL = 10 log ( I Io ) = 10 log (1.01x10⁻⁶ / 1 x 10-12) = 60.04 dB Hence, the sound intensity level in this area is 60.04 dB.
  • 61. 4.8.3 Analysis & Evaluation Zone 1 : Robotic Gait Area Highest Reading : 68 dB SIL = 10 log ( I1 Io ) 68 = 10 log (I1 / 1 x 10-12) 106.8 = (I1 / 1 x 10-12) I1 = 106.8 x 1 x 10-12 I1 = 6.31 x 10⁻⁶ W/m2 Lowest Reading : 51 SIL = 10 log ( I1 Io ) 51 = 10 log (I1 / 1 x 10-12) 105.1 = (I1 / 1 x 10-12) I1 = 105.1 x 1 x 10-12 I1 = 1.26 x 10⁻⁷ W/m2 Total Intensity, I = (6.31 x 10⁻⁶) + (1.26 x 10⁻⁷) = 6.44 x 10⁻⁶ W/m2 SIL = 10 log ( I Io ) = 10 log (6.44 x 10⁻⁶ / 1 x 10-12) = 68.09 dB The sound intensity level at Robotic Gait Area (Zone 1) is 68.09 dB.
  • 62. Zone 2 : Open Therapy Area Highest Reading : 68 dB SIL = 10 log ( I1 Io ) 68 = 10 log (I1 / 1 x 10-12) 106.8 = (I1 / 1 x 10-12) I1 = 106.8 x 1 x 10-12 I1 = 6.31 x 10⁻⁶ W/m2 Lowest Reading : 52 SIL = 10 log ( I1 Io ) 52 = 10 log (I1 / 1 x 10-12) 105.2 = (I1 / 1 x 10-12) I1 = 105.2 x 1 x 10-12 I1 = 1.59 x 10⁻⁷ W/m2 Total Intensity, I = (6.31 x 10⁻⁶) + (1.59 x 10⁻⁷) = 6.47 x 10⁻⁶ W/m2 SIL = 10 log ( I Io ) = 10 log (6.47 x 10⁻⁶ / 1 x 10-12) = 68.11 dB The sound intensity level at Open Therapy Area (Zone 2) is 68.11 dB.
  • 63. Zone 3 : Staff Base Area Highest Reading : 63 dB SIL = 10 log ( I1 Io ) 63 = 10 log (I1 / 1 x 10-12) 106.3 = (I1 / 1 x 10-12) I1 = 106.3 x 1 x 10-12 I1 = 2.00 x 10⁻⁶ W/m2 Lowest Reading : 51 SIL = 10 log ( I1 Io ) 51 = 10 log (I1 / 1 x 10-12) 105.1 = (I1 / 1 x 10-12) I1 = 105.1 x 1 x 10-12 I1 = 1.26 x 10⁻⁷ W/m2 Total Intensity, I = (2.00 x 10⁻⁶) + (1.26 x 10⁻⁷) = 2.13 x 10⁻⁶ W/m2 SIL = 10 log ( I Io ) = 10 log (2.13 x 10⁻⁶ / 1 x 10-12) = 63.28 dB The sound intensity level at Staff Base Area (Zone 3) is 63.28 dB.
  • 64. Zone 4 : Neuro Assessment Area Highest Reading : 68 dB SIL = 10 log ( I1 Io ) 68 = 10 log (I1 / 1 x 10-12) 106.8 = (I1 / 1 x 10-12) I1 = 106.8 x 1 x 10-12 I1 = 6.31 x 10⁻⁶ W/m2 Lowest Reading : 56 SIL = 10 log ( I1 Io ) 56 = 10 log (I1 / 1 x 10-12) 105.6 = (I1 / 1 x 10-12) I1 = 105.6 x 1 x 10-12 I1 = 3.98 x 10⁻⁷ W/m2 Total Intensity, I = (6.31 x 10⁻⁶) + (3.98 x 10⁻⁷) = 6.71 x 10⁻⁶ W/m2 SIL = 10 log ( I Io ) = 10 log (6.71 x 10⁻⁶ / 1 x 10-12) = 68.27 dB The sound intensity level at Neuro Assessment Area (Zone 4) is 68.27 dB.
  • 65. 4.8.4 SOUND REDUCTION INDEX CALCULATION Wall 1 Sound Reduction index for each material on wall 1 Component Material Color Finish Surface Area,m2 Sound Reduction Index (500Hz) Transmission Coefficient, T T= 𝟏 𝒍𝒐𝒈−𝟏 ( 𝑹 𝟏𝟎 ) Wall Concrete Light blue Smooth 54.36 50 1.00 x 10⁻⁵ Window Glass Transparent Reflective 1.44 25 2.51 x 10⁻³
  • 66. T0 = ( 𝑇1 𝑥 𝐴1)+(𝑇2 𝑥 𝐴2) 𝐴1+𝐴2 T0 = (1.00 x 10-5 x 54.36) + (2.51 x 10-3 x 1.44) / 54.36 + 1.44 = 4.16 x 10⁻³ / 55.8 = 7.46 x 10⁻⁵ SRI = 10 log ( 1 𝑇0 ) = 10 log (1 / 7.46 x 10⁻⁵) = 41.27 dB Hence, the overall SRI is 41.27 dB.
  • 67. Wall 2 Sound Reduction index for each material on wall 2 Component Material Color Finish Surface Area,m2 Sound Reduction Index (500Hz) Transmission Coefficient, T T= 𝟏 𝒍𝒐𝒈−𝟏 ( 𝑹 𝟏𝟎 ) Wall Concrete White Smooth 38.25 50 1.00 x 10⁻⁵ Door Glass Transparent Reflective 3.6 31 7.94 x 10⁻⁴
  • 68. T0 = ( 𝑇1 𝑥 𝐴1)+(𝑇2 𝑥 𝐴2) 𝐴1+𝐴2 T0 = (1.00 x 10-5 x 38.25) + (7.94 x 10-4 x 3.6) / 38.25 + 3.6 = 3.24 x 10⁻³ / 41.85 = 7.74 x 10⁻⁵ SRI = 10 log ( 1 𝑇0 ) = 10 log (1 / 7.74 x 10⁻⁵) = 41.11 dB Hence, the overall SRI is 41.11 dB.
  • 69. Wall 3 Sound Reduction index for each material on wall 3 Component Material Color Finish Surface Area,m2 Sound Reduction Index (500Hz) Transmission Coefficient, T T= 𝟏 𝒍𝒐𝒈−𝟏 ( 𝑹 𝟏𝟎 ) Wall Concrete White Smooth 45 50 1.00 x 10⁻⁵ Window Glass Transparent Reflective 10.8 25 2.51 x 10⁻³
  • 70. T0 = ( 𝑇1 𝑥 𝐴1)+(𝑇2 𝑥 𝐴2) 𝐴1+𝐴2 T0 = (1.00 x 10-5 x 45) + (2.51 x 10-3 x 10.8) / 45 + 10.8 = 0.028 / 55.8 = 5.02 x 10⁻⁴ SRI = 10 log ( 1 𝑇0 ) = 10 log (1 / 5.02 x 10⁻⁴) = 32.99 dB Hence, the overall SRI is 32.99 dB.
  • 71. Wall 4 Sound Reduction index for each material on wall 4 Component Material Color Finish Surface Area,m2 Sound Reduction Index (500Hz) Transmission Coefficient, T T= 𝟏 𝒍𝒐𝒈−𝟏 ( 𝑹 𝟏𝟎 ) Wall Concrete White Smooth 7.5 50 1.00 x 10⁻⁵ Door Timber Light Brown Smooth 1.8 24 3.98 x 10⁻³
  • 72. T0 = ( 𝑇1 𝑥 𝐴1)+(𝑇2 𝑥 𝐴2) 𝐴1+𝐴2 T0 = (1.00 x 10-5 x 7.5) + (3.98 x 10-3 x 1.8) / 7.5 + 1.8 = 7.24 x 10⁻³ / 9.3 = 7.79 x 10⁻⁴ SRI = 10 log ( 1 𝑇0 ) = 10 log (1 / 7.79 x 10⁻⁴) = 31.09 dB Hence, the overall SRI is 31.09 dB.
  • 73. 4.8.5 REVERBERATION TIME CALCULATION Reverberation Time when absorption coefficient at 500Hz, Room volume of Gymnasium, V = 13.5x18x3.1 = 753.3m3 Reverberation Time = (0.16 x V) / A = (0.16 x 753.3) / 21.68 = 5.56s Reverberation Time when absorption coefficient at 2000Hz, Room volume of Gymnasium, V = 13.5x18x3.1 = 753.3m3 Reverberation Time = (0.16 x V) / A = (0.16 x 753.3) / 28.09 = 4.29s Componen t Material Color Finish Surfac e Area, m2 Absorptio n Coefficien t (500Hz) Sound Absorptio n (500Hz) (m2 sabin) Absorptio n Coefficien t (2000Hz) Sound Absorptio n (200Hz) (m2 sabin) Wall Concret e White, Light Blue Smooth 145.11 0.05 7.26 0.05 7.26 Ceiling Plaster Ceiling White Dotted 243 0.02 4.86 0.04 9.72 Floor Ceramic Tiles Blue Veneer 243 0.01 2.43 0.02 4.86 Door Timber Light Brown Veneer 1.8 0.06 0.11 0.10 0.18 Door Glass Transparen t Reflectiv e 3.6 0.06 0.22 0.03 0.11 Window Glass Transparen t Reflectiv e 12.24 0.18 2.2 0.07 0.86 People - - - 10 0.46 4.6 0.51 5.1 Total Absorption (A) 21.68 28.09
  • 74. 4.9 Acoustic Analysis for Physiotherapy Type of Occupancy & activities Recommended Design Sound Level (dB) Recommended Reverberation Time (s) Physiotherapy 30 1.00 - 1.25 Table 4.2.6l: AS/NZS 2107:2000 In referring to AS/NZS 2107:2000 standard for sound levels and reverberation times for building interiors. We found out that the recommended design sound level should be 40- 45dB range. As for the recommended reverberation time is 0.4 to 0.6s. Zones Sound Pressure Level (dB) Reverberation Time 500Hz (S) Reverberation Time 2000Hz (S) 1 : Robotic Gait Area 68.09 5.56 4.29 2 : Open Therapy Area 68.11 3 : Staff Base Area 63.28 4 : Neuro Assessment Area 68.27 From the summary table above, we can conclude that all the 4 zones in the Physiotherapy Room exceeds and even doubled up the minimum requirement of the acoustic standard. From the table, the Neuro Assessment Area is the one with the highest sound pressure level. This is because there are 3 sides of walls covering it, where other spaces only covered by 2 sides of walls. This cause the area become more enclosed and thus with higher Sound Pressure. Besides, the Staff Base Area is the one having the lowest sound pressure level. This is due to the fact that they are open space instead of enclosed space like the zone 4, Neuro Assessment Area. As a conclusion, the Physiotherapy Room is designed in an open plan manners, all the zones are connected and function as multipurpose. From the table we can understand that, the sound pressure level in this room is actually greatly higher than the recommended standard. In a nutshell, improvement such as acoustic ceiling and wall panel can be installed to better improve the acoustic environment of the office.
  • 75. 5.0 Reference Z. Maekawa, & P. Lord. (1994). Environmental and Architectural Acoustics. London: E &FN Spon. Salvan, G. S. (1999). Architectural Utilies 3. Quezon City: JMC Press. Sound Is A Pressure Wave. (2015). Retrieved from The Physics Classroom: http://www.physicsclassroom.com/class/sound/Lesson-1/Sound-is-a-PressureWave Physics Communication Using Waves. (2014). Retrieved from BBC: http://www.bbc.co.uk/bitesize/standard/physics/telecommunications/communi cation_using_waves/revision/5/ M. B. (2010). Acoustics and Architectural Design. Taylor & Francis e-Library: New York L. M. (2014). Architectural Acoustics. USA: Elsevier Inc. Brooks, C. N. (2003). Architectural Acoustics. US: McFarland Company, Inc. Absorption Coefficient Chart - Soundproof Your Home. (n.d.). Retrieved May 31, 2016, from http://soundproofyourhome.com/absorption-coefficient-chart/