Recommended

Recommended
More Related Content
What's hot
What's hot (20)
Viewers also liked
Viewers also liked (20)
Similar to Effects of Agricultural Buffer Strips on Surface Water Quality
Similar to Effects of Agricultural Buffer Strips on Surface Water Quality (20)
Effects of Agricultural Buffer Strips on Surface Water Quality
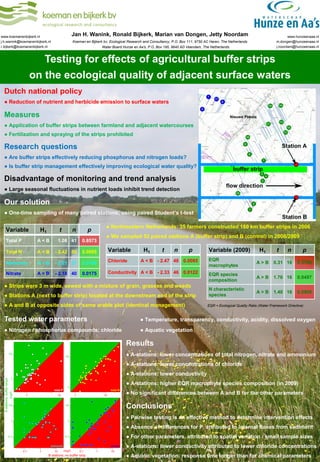
- 1. Jan H. Wanink, Ronald Bijkerk, Marian van Dongen, Jetty Noordam www.koemanenbijkerk.nl j.h.wanink@koemanenbijkerk.nl r.bijkerk@koemanenbijkerk.nl www.hunzeenaas.nl m.dongen@hunzeenaas.nl j.noordam@hunzeenaas.nl Koeman en Bijkerk bv, Ecological Research and Consultancy, P.O. Box 111, 9750 AC Haren, The Netherlands Water Board Hunze en Aa's, P.O. Box 195, 9640 AD Veendam, The Netherlands Testing for effects of agricultural buffer strips on the ecological quality of adjacent surface waters Dutch national policy ● Reduction of nutrient and herbicide emission to surface waters Measures ● Application of buffer strips between farmland and adjacent watercourses ● Fertilization and spraying of the strips prohibited Research questions ● Are buffer strips effectively reducing phosphorus and nitrogen loads? ● Is buffer strip management effectively improving ecological water quality? Disadvantage of monitoring and trend analysis ● Large seasonal fluctuations in nutrient loads inhibit trend detection Our solution ● One-time sampling of many paired stations; using paired Student’s t-test Variable H1 t n p ● Northeastern Netherlands: 35 farmers constructed 160 km buffer strips in 2006 ● We sampled 52 paired stations A (buffer strip) and B (control) in 2008/2009 Total P A<B 1.08 41 0.8573 Total N A<B - 2.42 50 0.0095 Variable Ammonia A<B - 2.21 37 0.0169 Chloride A < B - 2.47 48 0.0085 EQR macrophytes A>B 0.31 16 0.3796 Nitrate A<B - 2.18 40 0.0175 Conductivity A < B - 2.33 46 0.0122 EQR species composition A>B 1.76 16 0.0497 N characteristic species A>B 1.40 16 0.0908 H1 t n p ● Strips were 3 m wide, sewed with a mixture of grain, grasses and weeds ● Stations A (next to buffer strip) located at the downstream end of the strip ● A and B at opposite sides of same arable plot (identical management) Variable (2009) H1 t n p EQR = Ecological Quality Ratio (Water Framework Directive) Tested water parameters ● Temperature, transparency, conductivity, acidity, dissolved oxygen ● Nitrogen / phosphorus compounds; chloride ● Aquatic vegetation Results ● A-stations: lower concentrations of total nitrogen, nitrate and ammonium ● A-stations: lower concentrations of chloride ● A-stations: lower conductivity ● A-stations: higher EQR macrophyte species composition (in 2009) ● No significant differences between A and B for the other parameters Conclusions ● Pairwise testing is an effective method to determine intervention effects ● Absence of differences for P, attributed to internal fluxes from sediment ● For other parameters, attributed to spatial variation / small sample sizes ● A-stations: lower conductivity attributed to lower chloride concentrations ● Aquatic vegetation: response time longer than for chemical parameters