SlideShare une entreprise Scribd logo
1  sur  8
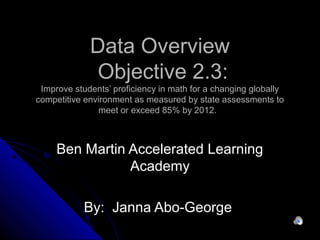
Data OverviewData Overview
Objective 2.3:Objective 2.3:
Improve students’ proficiency in math for a changing globallyImprove students’ proficiency in math for a changing globally
competitive environment as measured by state assessments tocompetitive environment as measured by state assessments to
meet or exceed 85% by 2012.meet or exceed 85% by 2012.
Ben Martin Accelerated LearningBen Martin Accelerated Learning
AcademyAcademy
By: Janna Abo-GeorgeBy: Janna Abo-George
High Growth Math AchievementHigh Growth Math Achievement
Note: 2009-2010 school year. Chart depicts ratio of students achieving growth
objective to those not achieving objective. Ratios > 1.5 = high growth.
2009-2010 Math Performance2009-2010 Math Performance
by Grade Levelby Grade Level
Note: Percentage of students’ scores at or above grade level.
3 Year Math Performance Trend3 Year Math Performance Trend
by Grade Levelby Grade Level
Note: Percentage of students’ scores at or above grade level.
3 Year Overall Math3 Year Overall Math
Performance TrendPerformance Trend
Note: Percentage of students’ scores at or above grade level.
2009-2010 Math Performance2009-2010 Math Performance
by Subgroupby Subgroup
Note: Percentage of students’ scores at or above grade level.
Ben Martin ALA vs StateBen Martin ALA vs State
Targets Grades 3-5Targets Grades 3-5
School Year Ben Martin State Difference
2007-2008 62.1 77.2 (15.1)
2008-2009 71.6 77.2 (5.6)
2009-2010 74.3 77.2 (2.9)
2010-2011 ? 88.6 ?
2011-2012 ? 88.6 ?
2012-2013 ? 88.6 ?
2013-2014 ? 100 ?
Where do we go from here?Where do we go from here?
 How do we help our students achieveHow do we help our students achieve
grade level achievement or “high growth”grade level achievement or “high growth”
in mathematics?in mathematics?
 What can we do to “close the gap”?What can we do to “close the gap”?
 What can we do as a school community,What can we do as a school community,
grade level or classroom?grade level or classroom?
 Questions? Comments?Questions? Comments?
Information from this presentation can be found at:
http://www.ncreportcards.org/src/schDetails.jsp?pYear=2009-2010&pLEACode=260&pSchCode=414

Contenu connexe

Tendances

C&I 578 Assignment 11.1. Design Bad
C&I 578 Assignment 11.1. Design BadC&I 578 Assignment 11.1. Design Bad
C&I 578 Assignment 11.1. Design BadShelley Overman
 
How Prodigy Helped More Texas Students Succeed
How Prodigy Helped More Texas Students SucceedHow Prodigy Helped More Texas Students Succeed
How Prodigy Helped More Texas Students SucceedProdigy Game
 
Getting explicit about reading
Getting explicit about readingGetting explicit about reading
Getting explicit about readingCourtney Huff
 
Map Growth July 14
Map Growth July 14Map Growth July 14
Map Growth July 14pthies
 
Can we identify effective teachers?
Can we identify effective teachers?Can we identify effective teachers?
Can we identify effective teachers?seprogram
 
Designing an impact curriculum | Phil Bourne, Director, School and Academy Co...
Designing an impact curriculum | Phil Bourne, Director, School and Academy Co...Designing an impact curriculum | Phil Bourne, Director, School and Academy Co...
Designing an impact curriculum | Phil Bourne, Director, School and Academy Co...Wholeeducation
 
JR Gerritts Achievement Goals - Review of 2010-11, Preview of 2011-2012
JR Gerritts Achievement Goals - Review of 2010-11, Preview of 2011-2012JR Gerritts Achievement Goals - Review of 2010-11, Preview of 2011-2012
JR Gerritts Achievement Goals - Review of 2010-11, Preview of 2011-2012ebrinkmann
 
Kemp/Kidd Acsa presentation november 2013
Kemp/Kidd Acsa presentation november 2013Kemp/Kidd Acsa presentation november 2013
Kemp/Kidd Acsa presentation november 2013ACSASummit
 
Acsa presentation november 2013
Acsa presentation november 2013Acsa presentation november 2013
Acsa presentation november 2013ACSASummit
 

Tendances (9)

C&I 578 Assignment 11.1. Design Bad
C&I 578 Assignment 11.1. Design BadC&I 578 Assignment 11.1. Design Bad
C&I 578 Assignment 11.1. Design Bad
 
How Prodigy Helped More Texas Students Succeed
How Prodigy Helped More Texas Students SucceedHow Prodigy Helped More Texas Students Succeed
How Prodigy Helped More Texas Students Succeed
 
Getting explicit about reading
Getting explicit about readingGetting explicit about reading
Getting explicit about reading
 
Map Growth July 14
Map Growth July 14Map Growth July 14
Map Growth July 14
 
Can we identify effective teachers?
Can we identify effective teachers?Can we identify effective teachers?
Can we identify effective teachers?
 
Designing an impact curriculum | Phil Bourne, Director, School and Academy Co...
Designing an impact curriculum | Phil Bourne, Director, School and Academy Co...Designing an impact curriculum | Phil Bourne, Director, School and Academy Co...
Designing an impact curriculum | Phil Bourne, Director, School and Academy Co...
 
JR Gerritts Achievement Goals - Review of 2010-11, Preview of 2011-2012
JR Gerritts Achievement Goals - Review of 2010-11, Preview of 2011-2012JR Gerritts Achievement Goals - Review of 2010-11, Preview of 2011-2012
JR Gerritts Achievement Goals - Review of 2010-11, Preview of 2011-2012
 
Kemp/Kidd Acsa presentation november 2013
Kemp/Kidd Acsa presentation november 2013Kemp/Kidd Acsa presentation november 2013
Kemp/Kidd Acsa presentation november 2013
 
Acsa presentation november 2013
Acsa presentation november 2013Acsa presentation november 2013
Acsa presentation november 2013
 

En vedette

Data overview
Data overviewData overview
Data overviewcdm6789
 
Newsletter
NewsletterNewsletter
NewsletterGWU
 
Technology In The Class
Technology In The  ClassTechnology In The  Class
Technology In The ClassAkbar Harrison
 
Propel Schools Embedding Technology Through Curriculum, Instruction,
Propel Schools Embedding Technology Through Curriculum, Instruction,Propel Schools Embedding Technology Through Curriculum, Instruction,
Propel Schools Embedding Technology Through Curriculum, Instruction,joe42ppc
 
Technology Needs Assessment
Technology Needs AssessmentTechnology Needs Assessment
Technology Needs Assessmentabryan
 
Teacher technology survey and needs assessment school name
Teacher technology survey and needs assessment            school nameTeacher technology survey and needs assessment            school name
Teacher technology survey and needs assessment school namelisawitteman
 

En vedette (6)

Data overview
Data overviewData overview
Data overview
 
Newsletter
NewsletterNewsletter
Newsletter
 
Technology In The Class
Technology In The  ClassTechnology In The  Class
Technology In The Class
 
Propel Schools Embedding Technology Through Curriculum, Instruction,
Propel Schools Embedding Technology Through Curriculum, Instruction,Propel Schools Embedding Technology Through Curriculum, Instruction,
Propel Schools Embedding Technology Through Curriculum, Instruction,
 
Technology Needs Assessment
Technology Needs AssessmentTechnology Needs Assessment
Technology Needs Assessment
 
Teacher technology survey and needs assessment school name
Teacher technology survey and needs assessment            school nameTeacher technology survey and needs assessment            school name
Teacher technology survey and needs assessment school name
 

Similaire à Educ 6240 assignment one data overview

Leveraging MAP Data to Improve Instruction
Leveraging MAP Data to Improve InstructionLeveraging MAP Data to Improve Instruction
Leveraging MAP Data to Improve InstructionAmanda DeCardy
 
002709_2011-2012_BUILD
002709_2011-2012_BUILD002709_2011-2012_BUILD
002709_2011-2012_BUILDStephen Fujii
 
002709_2009-2010_BUILD
002709_2009-2010_BUILD002709_2009-2010_BUILD
002709_2009-2010_BUILDStephen Fujii
 
Vertical Scale Scores
Vertical Scale ScoresVertical Scale Scores
Vertical Scale Scoresguest3921f8
 
Title i annual meeting powerpoint 2013
Title i annual meeting powerpoint 2013Title i annual meeting powerpoint 2013
Title i annual meeting powerpoint 2013Monecia Vasbinder
 
Datag Annual Testing Accountabilty Discussion 10 081
Datag Annual Testing Accountabilty Discussion 10 081Datag Annual Testing Accountabilty Discussion 10 081
Datag Annual Testing Accountabilty Discussion 10 081jborgioli
 
Datag Annual Testing Accountabilty Discussion 10 081
Datag Annual Testing Accountabilty Discussion 10 081Datag Annual Testing Accountabilty Discussion 10 081
Datag Annual Testing Accountabilty Discussion 10 081guestb767
 
Teacher Rating 2012-2013
Teacher Rating 2012-2013Teacher Rating 2012-2013
Teacher Rating 2012-2013Justin Rook
 
PTA Presentation 530 wk 5 with Audio
PTA Presentation 530 wk 5 with AudioPTA Presentation 530 wk 5 with Audio
PTA Presentation 530 wk 5 with Audiojohncreel
 
Web 2.0 PTA Presentation 530 wk 5
Web 2.0 PTA Presentation 530 wk 5Web 2.0 PTA Presentation 530 wk 5
Web 2.0 PTA Presentation 530 wk 5johncreel
 
Teacher Rating 2013-2014
Teacher Rating 2013-2014Teacher Rating 2013-2014
Teacher Rating 2013-2014Justin Rook
 
7 Keys to College Readiness Overview
7 Keys to College Readiness Overview7 Keys to College Readiness Overview
7 Keys to College Readiness OverviewBrenda Green
 
Hanly - TVAAS Summary
Hanly - TVAAS SummaryHanly - TVAAS Summary
Hanly - TVAAS SummaryMeg Hanly
 
002709_2012-2013_BUILD
002709_2012-2013_BUILD002709_2012-2013_BUILD
002709_2012-2013_BUILDStephen Fujii
 
Salient Point of k 12
Salient Point of k 12 Salient Point of k 12
Salient Point of k 12 Naome Brao
 
MURSD 2012 MCAS Results & Accountability Status
MURSD 2012 MCAS Results & Accountability StatusMURSD 2012 MCAS Results & Accountability Status
MURSD 2012 MCAS Results & Accountability Statusjpm66
 
B O E 12112007
B O E 12112007B O E 12112007
B O E 12112007millerjtx
 

Similaire à Educ 6240 assignment one data overview (20)

Leveraging MAP Data to Improve Instruction
Leveraging MAP Data to Improve InstructionLeveraging MAP Data to Improve Instruction
Leveraging MAP Data to Improve Instruction
 
002709_2011-2012_BUILD
002709_2011-2012_BUILD002709_2011-2012_BUILD
002709_2011-2012_BUILD
 
Growth Analysis
Growth AnalysisGrowth Analysis
Growth Analysis
 
002709_2009-2010_BUILD
002709_2009-2010_BUILD002709_2009-2010_BUILD
002709_2009-2010_BUILD
 
Vertical Scale Scores
Vertical Scale ScoresVertical Scale Scores
Vertical Scale Scores
 
Title i annual meeting powerpoint 2013
Title i annual meeting powerpoint 2013Title i annual meeting powerpoint 2013
Title i annual meeting powerpoint 2013
 
Lori PR 2012-13
Lori PR 2012-13Lori PR 2012-13
Lori PR 2012-13
 
Datag Annual Testing Accountabilty Discussion 10 081
Datag Annual Testing Accountabilty Discussion 10 081Datag Annual Testing Accountabilty Discussion 10 081
Datag Annual Testing Accountabilty Discussion 10 081
 
Datag Annual Testing Accountabilty Discussion 10 081
Datag Annual Testing Accountabilty Discussion 10 081Datag Annual Testing Accountabilty Discussion 10 081
Datag Annual Testing Accountabilty Discussion 10 081
 
Module 5
Module 5Module 5
Module 5
 
Teacher Rating 2012-2013
Teacher Rating 2012-2013Teacher Rating 2012-2013
Teacher Rating 2012-2013
 
PTA Presentation 530 wk 5 with Audio
PTA Presentation 530 wk 5 with AudioPTA Presentation 530 wk 5 with Audio
PTA Presentation 530 wk 5 with Audio
 
Web 2.0 PTA Presentation 530 wk 5
Web 2.0 PTA Presentation 530 wk 5Web 2.0 PTA Presentation 530 wk 5
Web 2.0 PTA Presentation 530 wk 5
 
Teacher Rating 2013-2014
Teacher Rating 2013-2014Teacher Rating 2013-2014
Teacher Rating 2013-2014
 
7 Keys to College Readiness Overview
7 Keys to College Readiness Overview7 Keys to College Readiness Overview
7 Keys to College Readiness Overview
 
Hanly - TVAAS Summary
Hanly - TVAAS SummaryHanly - TVAAS Summary
Hanly - TVAAS Summary
 
002709_2012-2013_BUILD
002709_2012-2013_BUILD002709_2012-2013_BUILD
002709_2012-2013_BUILD
 
Salient Point of k 12
Salient Point of k 12 Salient Point of k 12
Salient Point of k 12
 
MURSD 2012 MCAS Results & Accountability Status
MURSD 2012 MCAS Results & Accountability StatusMURSD 2012 MCAS Results & Accountability Status
MURSD 2012 MCAS Results & Accountability Status
 
B O E 12112007
B O E 12112007B O E 12112007
B O E 12112007
 

Dernier

Congestive Cardiac Failure..presentation
Congestive Cardiac Failure..presentationCongestive Cardiac Failure..presentation
Congestive Cardiac Failure..presentationdeepaannamalai16
 
Influencing policy (training slides from Fast Track Impact)
Influencing policy (training slides from Fast Track Impact)Influencing policy (training slides from Fast Track Impact)
Influencing policy (training slides from Fast Track Impact)Mark Reed
 
ClimART Action | eTwinning Project
ClimART Action    |    eTwinning ProjectClimART Action    |    eTwinning Project
ClimART Action | eTwinning Projectjordimapav
 
Active Learning Strategies (in short ALS).pdf
Active Learning Strategies (in short ALS).pdfActive Learning Strategies (in short ALS).pdf
Active Learning Strategies (in short ALS).pdfPatidar M
 
Choosing the Right CBSE School A Comprehensive Guide for Parents
Choosing the Right CBSE School A Comprehensive Guide for ParentsChoosing the Right CBSE School A Comprehensive Guide for Parents
Choosing the Right CBSE School A Comprehensive Guide for Parentsnavabharathschool99
 
4.16.24 Poverty and Precarity--Desmond.pptx
4.16.24 Poverty and Precarity--Desmond.pptx4.16.24 Poverty and Precarity--Desmond.pptx
4.16.24 Poverty and Precarity--Desmond.pptxmary850239
 
USPS® Forced Meter Migration - How to Know if Your Postage Meter Will Soon be...
USPS® Forced Meter Migration - How to Know if Your Postage Meter Will Soon be...USPS® Forced Meter Migration - How to Know if Your Postage Meter Will Soon be...
USPS® Forced Meter Migration - How to Know if Your Postage Meter Will Soon be...Postal Advocate Inc.
 
ICS2208 Lecture6 Notes for SL spaces.pdf
ICS2208 Lecture6 Notes for SL spaces.pdfICS2208 Lecture6 Notes for SL spaces.pdf
ICS2208 Lecture6 Notes for SL spaces.pdfVanessa Camilleri
 
Field Attribute Index Feature in Odoo 17
Field Attribute Index Feature in Odoo 17Field Attribute Index Feature in Odoo 17
Field Attribute Index Feature in Odoo 17Celine George
 
THEORIES OF ORGANIZATION-PUBLIC ADMINISTRATION
THEORIES OF ORGANIZATION-PUBLIC ADMINISTRATIONTHEORIES OF ORGANIZATION-PUBLIC ADMINISTRATION
THEORIES OF ORGANIZATION-PUBLIC ADMINISTRATIONHumphrey A Beña
 
Oppenheimer Film Discussion for Philosophy and Film
Oppenheimer Film Discussion for Philosophy and FilmOppenheimer Film Discussion for Philosophy and Film
Oppenheimer Film Discussion for Philosophy and FilmStan Meyer
 
INTRODUCTION TO CATHOLIC CHRISTOLOGY.pptx
INTRODUCTION TO CATHOLIC CHRISTOLOGY.pptxINTRODUCTION TO CATHOLIC CHRISTOLOGY.pptx
INTRODUCTION TO CATHOLIC CHRISTOLOGY.pptxHumphrey A Beña
 
Keynote by Prof. Wurzer at Nordex about IP-design
Keynote by Prof. Wurzer at Nordex about IP-designKeynote by Prof. Wurzer at Nordex about IP-design
Keynote by Prof. Wurzer at Nordex about IP-designMIPLM
 
Dust Of Snow By Robert Frost Class-X English CBSE
Dust Of Snow By Robert Frost Class-X English CBSEDust Of Snow By Robert Frost Class-X English CBSE
Dust Of Snow By Robert Frost Class-X English CBSEaurabinda banchhor
 
MULTIDISCIPLINRY NATURE OF THE ENVIRONMENTAL STUDIES.pptx
MULTIDISCIPLINRY NATURE OF THE ENVIRONMENTAL STUDIES.pptxMULTIDISCIPLINRY NATURE OF THE ENVIRONMENTAL STUDIES.pptx
MULTIDISCIPLINRY NATURE OF THE ENVIRONMENTAL STUDIES.pptxAnupkumar Sharma
 
Visit to a blind student's school🧑‍🦯🧑‍🦯(community medicine)
Visit to a blind student's school🧑‍🦯🧑‍🦯(community medicine)Visit to a blind student's school🧑‍🦯🧑‍🦯(community medicine)
Visit to a blind student's school🧑‍🦯🧑‍🦯(community medicine)lakshayb543
 
4.16.24 21st Century Movements for Black Lives.pptx
4.16.24 21st Century Movements for Black Lives.pptx4.16.24 21st Century Movements for Black Lives.pptx
4.16.24 21st Century Movements for Black Lives.pptxmary850239
 
Measures of Position DECILES for ungrouped data
Measures of Position DECILES for ungrouped dataMeasures of Position DECILES for ungrouped data
Measures of Position DECILES for ungrouped dataBabyAnnMotar
 

Dernier (20)

Congestive Cardiac Failure..presentation
Congestive Cardiac Failure..presentationCongestive Cardiac Failure..presentation
Congestive Cardiac Failure..presentation
 
Influencing policy (training slides from Fast Track Impact)
Influencing policy (training slides from Fast Track Impact)Influencing policy (training slides from Fast Track Impact)
Influencing policy (training slides from Fast Track Impact)
 
ClimART Action | eTwinning Project
ClimART Action    |    eTwinning ProjectClimART Action    |    eTwinning Project
ClimART Action | eTwinning Project
 
Paradigm shift in nursing research by RS MEHTA
Paradigm shift in nursing research by RS MEHTAParadigm shift in nursing research by RS MEHTA
Paradigm shift in nursing research by RS MEHTA
 
Active Learning Strategies (in short ALS).pdf
Active Learning Strategies (in short ALS).pdfActive Learning Strategies (in short ALS).pdf
Active Learning Strategies (in short ALS).pdf
 
Choosing the Right CBSE School A Comprehensive Guide for Parents
Choosing the Right CBSE School A Comprehensive Guide for ParentsChoosing the Right CBSE School A Comprehensive Guide for Parents
Choosing the Right CBSE School A Comprehensive Guide for Parents
 
4.16.24 Poverty and Precarity--Desmond.pptx
4.16.24 Poverty and Precarity--Desmond.pptx4.16.24 Poverty and Precarity--Desmond.pptx
4.16.24 Poverty and Precarity--Desmond.pptx
 
USPS® Forced Meter Migration - How to Know if Your Postage Meter Will Soon be...
USPS® Forced Meter Migration - How to Know if Your Postage Meter Will Soon be...USPS® Forced Meter Migration - How to Know if Your Postage Meter Will Soon be...
USPS® Forced Meter Migration - How to Know if Your Postage Meter Will Soon be...
 
ICS2208 Lecture6 Notes for SL spaces.pdf
ICS2208 Lecture6 Notes for SL spaces.pdfICS2208 Lecture6 Notes for SL spaces.pdf
ICS2208 Lecture6 Notes for SL spaces.pdf
 
Field Attribute Index Feature in Odoo 17
Field Attribute Index Feature in Odoo 17Field Attribute Index Feature in Odoo 17
Field Attribute Index Feature in Odoo 17
 
THEORIES OF ORGANIZATION-PUBLIC ADMINISTRATION
THEORIES OF ORGANIZATION-PUBLIC ADMINISTRATIONTHEORIES OF ORGANIZATION-PUBLIC ADMINISTRATION
THEORIES OF ORGANIZATION-PUBLIC ADMINISTRATION
 
Oppenheimer Film Discussion for Philosophy and Film
Oppenheimer Film Discussion for Philosophy and FilmOppenheimer Film Discussion for Philosophy and Film
Oppenheimer Film Discussion for Philosophy and Film
 
INTRODUCTION TO CATHOLIC CHRISTOLOGY.pptx
INTRODUCTION TO CATHOLIC CHRISTOLOGY.pptxINTRODUCTION TO CATHOLIC CHRISTOLOGY.pptx
INTRODUCTION TO CATHOLIC CHRISTOLOGY.pptx
 
Keynote by Prof. Wurzer at Nordex about IP-design
Keynote by Prof. Wurzer at Nordex about IP-designKeynote by Prof. Wurzer at Nordex about IP-design
Keynote by Prof. Wurzer at Nordex about IP-design
 
Dust Of Snow By Robert Frost Class-X English CBSE
Dust Of Snow By Robert Frost Class-X English CBSEDust Of Snow By Robert Frost Class-X English CBSE
Dust Of Snow By Robert Frost Class-X English CBSE
 
YOUVE_GOT_EMAIL_PRELIMS_EL_DORADO_2024.pptx
YOUVE_GOT_EMAIL_PRELIMS_EL_DORADO_2024.pptxYOUVE_GOT_EMAIL_PRELIMS_EL_DORADO_2024.pptx
YOUVE_GOT_EMAIL_PRELIMS_EL_DORADO_2024.pptx
 
MULTIDISCIPLINRY NATURE OF THE ENVIRONMENTAL STUDIES.pptx
MULTIDISCIPLINRY NATURE OF THE ENVIRONMENTAL STUDIES.pptxMULTIDISCIPLINRY NATURE OF THE ENVIRONMENTAL STUDIES.pptx
MULTIDISCIPLINRY NATURE OF THE ENVIRONMENTAL STUDIES.pptx
 
Visit to a blind student's school🧑‍🦯🧑‍🦯(community medicine)
Visit to a blind student's school🧑‍🦯🧑‍🦯(community medicine)Visit to a blind student's school🧑‍🦯🧑‍🦯(community medicine)
Visit to a blind student's school🧑‍🦯🧑‍🦯(community medicine)
 
4.16.24 21st Century Movements for Black Lives.pptx
4.16.24 21st Century Movements for Black Lives.pptx4.16.24 21st Century Movements for Black Lives.pptx
4.16.24 21st Century Movements for Black Lives.pptx
 
Measures of Position DECILES for ungrouped data
Measures of Position DECILES for ungrouped dataMeasures of Position DECILES for ungrouped data
Measures of Position DECILES for ungrouped data
 

Educ 6240 assignment one data overview

  • 1. Data OverviewData Overview Objective 2.3:Objective 2.3: Improve students’ proficiency in math for a changing globallyImprove students’ proficiency in math for a changing globally competitive environment as measured by state assessments tocompetitive environment as measured by state assessments to meet or exceed 85% by 2012.meet or exceed 85% by 2012. Ben Martin Accelerated LearningBen Martin Accelerated Learning AcademyAcademy By: Janna Abo-GeorgeBy: Janna Abo-George
  • 2. High Growth Math AchievementHigh Growth Math Achievement Note: 2009-2010 school year. Chart depicts ratio of students achieving growth objective to those not achieving objective. Ratios > 1.5 = high growth.
  • 3. 2009-2010 Math Performance2009-2010 Math Performance by Grade Levelby Grade Level Note: Percentage of students’ scores at or above grade level.
  • 4. 3 Year Math Performance Trend3 Year Math Performance Trend by Grade Levelby Grade Level Note: Percentage of students’ scores at or above grade level.
  • 5. 3 Year Overall Math3 Year Overall Math Performance TrendPerformance Trend Note: Percentage of students’ scores at or above grade level.
  • 6. 2009-2010 Math Performance2009-2010 Math Performance by Subgroupby Subgroup Note: Percentage of students’ scores at or above grade level.
  • 7. Ben Martin ALA vs StateBen Martin ALA vs State Targets Grades 3-5Targets Grades 3-5 School Year Ben Martin State Difference 2007-2008 62.1 77.2 (15.1) 2008-2009 71.6 77.2 (5.6) 2009-2010 74.3 77.2 (2.9) 2010-2011 ? 88.6 ? 2011-2012 ? 88.6 ? 2012-2013 ? 88.6 ? 2013-2014 ? 100 ?
  • 8. Where do we go from here?Where do we go from here?  How do we help our students achieveHow do we help our students achieve grade level achievement or “high growth”grade level achievement or “high growth” in mathematics?in mathematics?  What can we do to “close the gap”?What can we do to “close the gap”?  What can we do as a school community,What can we do as a school community, grade level or classroom?grade level or classroom?  Questions? Comments?Questions? Comments? Information from this presentation can be found at: http://www.ncreportcards.org/src/schDetails.jsp?pYear=2009-2010&pLEACode=260&pSchCode=414

Notes de l'éditeur

  1. Hello and welcome to Ben Martin Accelerated Learning Academy. This is a presentation to show one instructional area of focus for our school. Objective 2.3: Improve students’ proficiency in math for a changing globally competitive environment as measured by state assessments to meet or exceed 85% by 2012. This presentation will highlight some of the results from the 2009-2010 school year and will show how we are performing as a school according to state testing by grade levels, in comparison with our district and state, the performance trends, performance by subgroup and showing future target information. At the end of this presentation, I hope that you will have a better understanding of our school data in relations to math and our school objective.
  2. This slide shows our students during the 2009-2010 school year and represents how well our 4th and 5th grade students are performing in math according to state testing with growth from the previous year. Students who are at or above the 1.5 ratio is considered having high growth in math. Students overall and 4th grade had high growth and those in 5th grade at grade level. The reason 3rd grade isn’t shown here is because students in 3rd grade were not tested in 2nd grade from the previous year therefore will not be able to show “growth”.
  3. This slide shows students in 3rd, 4th and 5th grade in comparison with the state and district. As you can tell, students in our 3rd grade are close to meeting the state and district’s grade level performance, while 4th and 5th grade students have a bigger gap to reach.
  4. This slide shows how well the students in 3rd, 4th, and 5th grade have been performing the past 3 years. It shows that students in all grade levels have increased in performing at or above grade level each year. This also shows that 3rd grade students in math perform better than 5th graders.
  5. This slide shows overall how students have been performing from year to year. Students have increased in overall math performance in each of the years.
  6. This slide represents the percentage of students achieving at or above grade level in performance according to subgroups. As you can see here, the White student population is doing better than all the others and same with the overall percentage.
  7. This slide shows the target for each year for the state and how we have been comparing. The good news is that the difference between our school and the state has decreased. But, on the other hand, this year the target for the state in math has increased as well so we will have to make up a bigger gap if we want to hit the target for math achievement for grades 3-5. By 2013-2014, the state’s target is to be able to be 100% proficient in math performance.