Find Furnished Short Term Rentals in Minneapolis | CHBO
Tampa Bay Office Market Report - Q3 2011
1. Q3 2011 | OFFICE
TAMPA BAY FLORIDA
OFFICE RESEARCH REPORT Tampa Bay Florida
Absorption Turns Positive Year-to-Date
EXECUTIVE SUMMARY
The Tampa Bay office market showed signs of stabilization in the third quarter as overall net
absorption posted the largest quarter-over-quarter gain in over three years. This indicates landlords
are beginning to accept the new reality of lower rents and increased concessions. In addition,
vacancy rates declined to levels not seen in nearly two years. Of all office space, Class-A posted the
largest net absorption increase as tenants capitalized on the opportunity to move into higher quality
buildings while not increasing their overall costs. Average asking rental rates fell for the tenth
MARKET INDICATORS
consecutive quarter, down one half of a percent to $19.60 per square foot. The excess supply of
Q3 2011 Q4 2011* office space will likely continue to put downward pressure on rents well into 2012. Despite the
positive signs which occurred during the third quarter, significant employment increases in sectors
VACANCY traditionally associated with office space will need to occur for a sustained recovery.
NET ABSORPTION
HIGHLIGHTED TRENDS
CONSTRUCTION • Five of six submarkets saw both positive net • Office sectors generating the highest leasing
OVERALL absorption and declines in vacancy rates. activity included: healthcare, finance,
RENTAL RATE technology, education and defense.
• Over 245,000 square feet of Class A office
CLASS A RENTAL space was absorbed during the third quarter. • Lending has become looser as of late,
RATE
• Functional obsolescence began to force however the lack of product in the
*Relative to prior period. Note: Arrows landlords to improve buildings in order to marketplace is preventing an increase in sale
compare current quarter to the previous maintain occupancy levels and attract new activity.
quarter historically adjusted figures. All data in
tenants.
this report include buildings 10,000 square feet and greater.
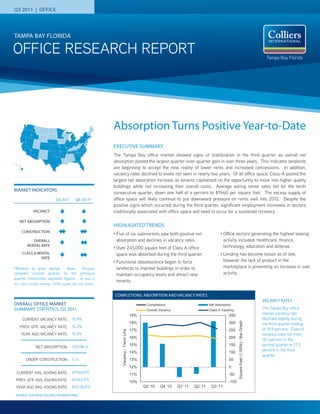
COMPLETIONS, ABSORPTION AND VACANCY RATES
VACANCY RATES
OVERALL OFFICE MARKET Completions Net Absorption
SUMMARY STATISTICS, Q3 2011 Overall Vacancy Class A Vacancy
The Tampa Bay office
19% 350 market vacancy rate
CURRENT VACANCY RATE: 15.9% declined slightly during
Square Feet (1,000s) - Bar Graph
18% 300 the third quarter ending
PREV. QTR. VACANCY RATE: 16.2%
17% 250 at 15.9 percent. Class A
Vacancy - Trend Line
YEAR AGO VACANCY RATE: 16.3% vacancy rates fell from
16% 200
18.1 percent in the
310,196 sf 15% 150 second quarter to 17.2
NET ABSORPTION:
percent in the third
14% 100
quarter.
UNDER CONSTRUCTION: 0 sf 13% 50
12% 0
CURRENT AVG. ASKING RATE: $19.60/FS 11% -50
PREV. QTR. AVG. ASKING RATE: $19.65/FS 10% -100
YEAR AGO AVG. ASKING RATE: $20.06/FS Q3 '10 Q4 '10 Q1' 11 Q2 '11 Q3 '11
SOURCE: COSTAR & COLLIERS INTERNATIONAL
2. RESEARCH REPORT | Q3 2011 | OFFICE | COLLIERS INTERNATIONAL TAMPA BAY FLORIDA
UNEMPLOYMENT TRENDS
VACANCY
The Tampa Bay office market vacancy rate quarter-over-quarter increase dating back to
Florida Tampa MSA USA fell 30 basis points during the third quarter to the first quarter of 2007. Once again, the
14 15.9 percent. Vacancy rates were highest in Westshore submarket posted the largest
the Westshore submarket (17.0 percent) and increase as 72,277 square feet of Class A
12
lowest in Gateway submarket (11.9 percent). space was absorbed.
Market-wide, Class A vacancy rates were
10
highest (17.2 percent) with Westshore
8 submarket Class A space posting the highest RENTAL RATES
rate (21.3 percent). The overall direct average asking rate during
6
the third quarter fell to $19.60 per square foot
full service. Class A asking rates ended the
4 ABSORPTION
quarter at $23.10 per square foot full service.
Overall net absorption jumped during the third Overall asking rates continue to remain
2
quarter to positive 310,196 square feet, highest in the Westshore submarket at $23.57
0 compared to negative 45,949 square feet per square foot full service. Landlords and
Aug-06
Aug-07
Aug-08
Aug-09
Aug-10
Aug-11
Feb-07
Feb-08
Feb-09
Feb-10
Feb-11
during in the previous quarter. Year-to-date brokers continued to report that concessions,
net absorption moved into positive territory generous tenant improvement allowances and
(196,383 square feet) for only the second one month of free rent per year leased are
The Tampa Bay MSA unemployment rate time during the last four years. The North common throughout the market. Indicators
posted 11.0% in August 2011, down from the Pinellas submarket gave back the most space, point towards asking rates remaining flat to
12.4% rate posted in August 2010. The State as just over 55,000 square feet were vacated. slightly falling through the remainder of 2011.
of Florida rate was 10.9% in August 2011,
All other Tampa Bay submarkets posted
while the national rate stood at 9.1%. Both
Tampa Bay and the State of Florida as a positive absorption figures during the quarter.
whole continued to experience unemployment
SUMMARY
rates well above the national average. The Tampa Bay office market continued to
The ability of tenants to move into higher favor the tenant as a large amount of vacant
Source: Florida Research & Economic Database quality space was evident as Class A space space remained and unemployment levels
experienced 246,170 square feet of positive failed to significantly improve.
absorption, which representthe largest
TRANSACTION UPDATE
SALES ACTIVITY
PROPERTY NAME CLASS BUYER NAME SIZE SF SALES PRICE SUBMARKET
125 Indian Rocks Rd N B South River Realty LLC 17,004 $2,835,000 ($166.73/sf ) Mid-Pinellas
3802 Northdale Blvd C Weingarten Realty Investors 32,523 $2,750,000 ($84.56/sf ) NW Tampa
930 Lithia Pinecrest Blvd B Golden City Gymnastics 21,798 $2,446,700 ($112.24/sf ) I-75 Corridor
14914 Winding Creek Ct (3 Properties) C TSI-GSA, LLC 13,247 $1,200,000 ($90.59/sf ) I-75 Corridor
LEASING ACTIVITY
PROPERTY NAME CLASS TENANT NAME SIZE (SF) LEASE TYPE SUBMARKET
MetWest II A PricewaterhouseCoopers 250,000 New Westshore
Independence Park I A ConnectWise 50,000 New Westshore
3402 W Martin Luther King Blvd A Optimal Outcomes 36,000 New - Build to Suit Westshore
Bayview Pavillion A Universal American Mortgage 31,723 Renewal Gateway
909 N Dale Mabry (Former Borders) A Florida Orthopaedic Institute 27,500 New Westshore
580 Corporate Center A Federal Verification Company, Inc 7,225 New North Pinellas
The Pointe A Agile Thought 7,129 New Westshore
Wells Fargo Center A LCM Group, Inc. 4,933 New Tampa CBD
P. 2 | COLLIERS INTERNATIONAL TAMPA BAY FLORIDA
3. RESEARCH REPORT | Q3 2011 | OFFICE | COLLIERS INTERNATIONAL TAMPA BAY FLORIDA
UPDATE SUBMARKET COMPARISONS
SUBMARKET BREAKDOWN
Total Net Absorp. New
Property Total Inventory Direct Vac. Net Absorp. YTD Under Avg. Direct Asking Rate Full
Bldgs. Vac. Current Completions
Class S.F. % S.F. Construc. S.F. Service
% Qtr. S.F. S.F.
TAMPA CBD
A 12 4,977,318 14.4% 15.1% 59,353 138,223 0 0 $22.09/fs
B,C 61 3,626,381 13.9% 13.9% -1,022 15,229 0 0 $17.32/fs
Overall 73 8,603,699 14.2% 14.6% 58,331 153,452 0 0 $20.16/fs
WESTSHORE
A 40 7,583,378 21.1% 21.3% 72,277 49,128 0 0 $26.13/fs
B,C 204 7,958,218 12.6% 12.9% 66,263 48,347 0 0 $19.71/fs
Overall 244 15,541,596 16.8% 17.0% 138,540 97,475 0 0 $23.57/fs
I-75 CORRIDOR
A 44 6,891,536 14.6% 14.9% 64,273 14,607 0 0 $22.17/fs
B,C 283 9,280,623 16.7% 17.0% -14,713 -120,878 0 0 $16.87/fs
Overall 327 16,172,159 15.8% 16.1% 49,560 -106,271 0 0 $19.20/fs
NORTH PINELLAS
A 16 1,345,783 18.9% 19.3% -17,098 -29,084 0 0 $19.14/fs
B,C 157 3,891,084 15.6% 15.6% -37,994 -12,193 0 0 $16.81/fs
Overall 173 5,236,867 16.4% 16.5% -55,092 -41,277 0 0 $17.67/fs
GATEWAY
A 24 3,085,606 4.9% 5.4% 33,529 79,345 0 0 $21.08/fs
B,C 121 4,609,375 15.7% 16.3% 27,630 100,027 0 0 $17.09/fs
Overall 145 7,694,981 11.4% 11.9% 61,159 179,372 0 0 $18.25/fs
ST. PETERSBURG CBD
A 9 1,635,246 23.7% 23.9% 26,836 -60,743 0 0 $25.02/fs
B,C 55 2,168,183 10.4% 10.4% 99,942 121,832 0 0 $20.00/fs
Overall 64 3,803,429 16.1% 16.2% 126,778 61,089 0 0 $22.31/fs
TAMPA BAY OVERALL OFFICE MARKET
Total Net Absorp. Net New Overall Avg. Class A Avg.
Total Inventory Direct Vac. Under
Qtr. & Year Bldgs. Vac. Current Absorp. Completions Direct Asking Direct Asking
S.F. % Construc. S.F.
% Qtr. S.F. YTD S.F. S.F. Rate F.S. Rate F.S.
2011 3Q 1,775 79,962,625 15.6% 15.9% 310,196 196,383 0 0 $19.60/fs $23.10/fs
2011 2Q 1,775 79,962,625 15.9% 16.2% -45,949 -113,813 0 0 $19.65/fs $23.16/fs
2011 1Q 1,775 79,962,625 15.8% 16.2% -67,864 -67,864 0 0 $19.79/fs $23.18/fs
2010 4Q 1,775 79,962,625 15.7% 16.1% 157,740 102,619 0 0 $20.01/fs $23.44/fs
2010 3Q 1,775 79,962,625 15.8% 16.3% 300,557 -55,121 0 0 $20.06/fs $23.61/fs
2010 2Q 1,775 79,962,625 16.1% 16.7% -234,649 -355,678 0 0 $20.10/fs $23.58/fs
2010 1Q 1,774 79,933,591 15.7% 16.3% -121,029 -121,029 0 0 $20.17/fs $23.59/fs
2009 4Q 1,774 79,933,591 15.4% 16.2% -201,004 -1,634,786 136,364 117,034 $20.37/fs $24.16/fs
2009 3Q 1,768 79,774,157 14.9% 15.8% -589,785 -1,433,782 40,000 276,468 $20.64/fs $24.47/fs
COLLIERS INTERNATIONAL TAMPA BAY FLORIDA | P. 3
4. RESEARCH REPORT | Q3 2011 | OFFICE | COLLIERS INTERNATIONAL TAMPA BAY FLORIDA
SUBMARKET MAP
512 offices in
61 countries on
6 continents
United States: 125
Canada: 38
Latin America: 18
Asia Pacific: 214
EMEA: 117
• $1.5 billion in annual revenue
• 979 million square feet under
management
• Over 12,500 professionals
TAMPA BAY CITY LEADER:
Ryan Kratz
Executive Vice President
Brokerage | Marketing | Operations
Corporate Office
311 Park Place Boulevard
Suite 600
Clearwater, FL 33759
Camille Renshaw, CCIM Jeff Tolrud, CCIM Josh Pardue
Director of Investment Sales Managing Director, Office Services Senior Investment Associate TEL +1 727 442 7184
camille.renshaw@colliers.com jeff.tolrud@colliers.com josh.pardue@colliers.com
www.colliers.com/Camille.Renshaw www.colliers.com/Jeff.Tolrud www.colliers.com/Josh.Pardue
Carol Warren, CCIM Jim Allen Mia Jarrell
Senior Director Managing Director Managing Director, Office Services
Commercial Services Healthcare Services Group mia.jarrell@colliers.com
carol.warren@colliers.com jim.allen@colliers.com www.colliers.com/Mia.Jarrell
www.colliers.com/Carol.Warren www.colliers.com/Jim.Allen
Christopher Leonard, CCIM Jim Stuckey, MCR Mary Clare Codd, CCIM,
Director, Commercial Sales Director Corporate Services
christopher.leonard@colliers.com jim.stuckey@colliers.com SIOR RESEARCHER:
www.colliers.com/ www.colliers.com/Jim.Stuckey Senior Office & Industrial Specialist
Christopher.Leonard maryclare.codd@colliers.com
www.colliers.com/MaryClare.Codd Matt Dolan
Research, GIS & Market Analytics
Administrator
Claire Calzon Jim Parker, CCIM Melanie Jackson
Managing Director Director Commercial Services Senior Associate Office Services
Office Services jim.parker@colliers.com melanie.jackson@colliers.com
claire.calzon@colliers.com www.colliers.com/Jim.Parker www.colliers.com/MClouelanie. Market: Tampa Bay
www.colliers.com/Claire.Calzon Jackson
TEL +1 813 221 2290
FAX +1 813 224 9403
Mackenzie Gerlach John Gerlach, CCIM Alan Feldshue EMAIL matt.dolan@colliers.com
Investment Specialist Managing Director Office Services Managing Director Office Services
mackenzie.gerlach@colliers.com john.gerlach@colliers.com alan.feldshue@colliers.com
www.colliers.com/Mackenzie. www.colliers.com/John.Gerlach www.colliers.com/Alan.Feldshue
Gerlach
Kevin Yeager
Senior Associate, Office Services
kevin.yeager@colliers.com
www.colliers.com/Kevin.Yeager
Copyright @ 2011 Colliers International
The information contained herein has been obtained from sources deemed reliable. While every reasonable effort has been made to ensure its accuracy, Tampa Bay Florida
we cannot guarantee it. No responsibility is assumed for any inaccuracies. Readers are encouraged to consult their professional advisors prior to acting
on any of the material contained in this report.
This report includes owner and non-owner occupied space 10,000 sf and greater. Directional arrows compare current quarter to previous quarter
Accelerating success.
numbers. Arrows show change when there is a 10 cent or more change in lease rate or 0.5% or more change in vacancy rate. Due to continual updates
and refinements in the historical database, some of the data in this report may not match data published in previous reports. Sources: Costar Property
and Colliers International Tampa Bay Florida.
www.colliers.com/marketname