1. Journal of Cardiovascular Disease Research Vol. 5 / Issue 1 Jan–Mar, 2014 7
JCDROriginal Article
Diastolic blood pressure is predictive of an elevated ventilatory
efficiency slope in at-risk middle-aged obese adults that are
asymptomatic for cardiovascular disease
Jeffrey E. Herricka,*
, Erik P. Kirkb
, Michael R. Hollyb
, Bryan L. Smithb
and Joshua S. Wootenb
a*
Department of Rehabilitation Science, George Mason University, Fairfax, VA, USA
b
Department of Kinesiology and Health Education, Southern Illinois University Edwardsville,
Edwardsville, IL, USA
INTRODUCTION
Cardiovascular disease (CVD) related deaths are the lead-
ing cause of mortality worldwide. According to the World
Health Organization in 2008, the mortality rate due to
CVD was 214–455 deaths per 100,000 varying by glob-
ally1
. In the United States, heart disease currently rep-
resents the leading cause of death, accounting for 27%
of total deaths in people age 65 and over2
. The develop-
ment of CVD can be attributed to both modifiable risk
factors such as obesity, blood pressure, physical activity
status, cholesterol, pre-diabetes and smoking; as well as
non-modifiable risk factors such as age, gender, family
history and genetic predisposition3,4
. The primary mecha-
nism by which risk factors contribute to the development
of CVD is their role in the development of atheroscle-
rotic plaque deposition5
. Coronary heart disease (CHD)
due to atherosclerosis represents the largest proportion
of CVD related deaths resulting from acute myocardial
infarction (MI)6
. The high incidence and mortality rates
of CVD demonstrate a need to continuously improve
current detection methods for severity and progression
ABSTRACT
Background: Cardiopulmonary exercise tests (CPET)assess oxygen uptake (VO2
) and ventilatory efficiency (VE
/VCO2
slope) as both are predictive measures of cardiovascular disease (CVD) severity in symptomatic adults. Specifically, the
VE
/VCO2
slope is a powerful prognostic tool for assessing CVD severity and prognosis as it is effectively independent of
a patient’s capacity to reach volitional fatigue. In asymptomatic adults, several clinical risk factors for CVD have been
established for use in health assessments, and as a method for early CVD detection and prevention.Therefore, we evaluated
the relationship between the VE
/VCO2
slope and several clinical CVD risk factors in at-risk but asymptomatic middle-aged
obese adults. Methods: 29 obese adults (Mean ± SE; Age 46.5 ±2.6 years; BMI 35.9 ±1.1 kg/m2
) were stratified into low
(LR2 risk factor) or moderate risk (MR≥2 risk factors) from self-reported health history questionnaires and quantitative
assessments and performed a treadmill CPET. Results: No differences in VE
/VCO2
slope between risk groups (LR30.1
±1.8, MR29.2 ±0.9 VE
/VCO2
slope). The VE
/VCO2
slope positively associated with age and diastolic blood pressure
(DBP) and not with the CVD risk factors BMI, HDL-C, LDL-C, fasting blood glucose, systolic blood pressure, or total
risk factors; further DBP was the only predictor(r=0.429, r2
=0.184, p= 0.037). Conclusion: DBP predicted a steeper
ventilatory efficiency (VE
/VCO2
slope) in at-risk but asymptomatic for CVD middle-aged obese adults. Our findings
indicate that the ventilatory efficiency slopes CVD risk and prognosis assessment extends to clinically at-risk middle-
aged asymptomatic obese adults, and may function as an additional measure for long-term health monitoring.
Keywords: body weight, exercise test, heart disease, obesity, risk factors
Corresponding address:
Jeffrey E. Herrick, PhD Tel: 703.993.1263
Department of Rehabilitation Science, MSN 2G7
E-mail: jherrick@gmu.edu
College of Health and Human Services Fax: 703.993.6073
George Mason University
Fairfax, VA 22030
DOI: 10.5530/jcdr.2014.1.2
2. Ventilatory Slope and CVD Risk
8 Journal of Cardiovascular Disease Research Vol. 5 / Issue 1 Jan–Mar, 2014
of CVD and the associated risk factors. Presently, CVD
prevention is focused on methods of early detection of
at-risk individuals and the subsequent identification and
management of specific CVD risk factors. Clear rela-
tionships have been established between the presence of
single and multiple risk factors and the development of
CHD7
. Moreover, 90% of all CHD related events can be
attributed to the identification of known risk factors5
. In
addition, several functional cardiovascular fitness assess-
ments, specifically oxygen uptake capacity, are employed
to categorize an individual’s functional capacity and popu-
lation based risk for developing CVD4
.
The early identification of CVD and associated risk fac-
tors has several positive outcomes including reduced
patient re-hospitalization and lower incidences of mor-
tality8–10
. Exercise tolerance which is commonly accessed
via cardiopulmonary exercise testing (CPET) is a valu-
able tool for the detection of cardiac impairment in
patients with diagnosed heart failure11–13
. Respiratory gas
analysis during CPET provides clinicians and exercise
physiologists with measures for a differential diagnosis
which often clarified severity of cardiac impairment. The
CPET is a non-invasive diagnostic tool that has multiple
outcome measures to determine the underlying causes
contributing to a patientspain, dyspnea, and or fatigue
during physical activity8,14
. Two common measures used
to diagnose and grade the severity of CVD are the CPET
derived variables peak or highest achieved oxygen uptake
(VO2
) and recently the ventilatory efficiency slope (VE
/
VCO2
slope)15
.
As an independent measure, peak VO2
has been strongly
correlated with rates of hospitalization and incidence
of mortality in heart failure patients and is strong mea-
sure of overall health status in un-diagnosed adults 16–18
.
However, as an independent measure, VO2
prognostic
precision is partially limited in patients unable to pro-
vide a maximal effort to volitional fatigue. In contrast,
the ventilatory efficiency slope (VE
/VCO2
: rise in minute
ventilation plotted against the rate of ventilated carbon
dioxide), has been shown to be a similar predictor of
CHD patient outcomes as peak VO2
alone9,10,16–18
. Specifi-
cally, the ventilatory efficiency slope’s prognostic capac-
ity has been shown to not be limited by patient effort or
capacity to reach volitional exhaustion during a CPET15
.
Therefore, as a clinical measure the ventilatory efficiency
slope retains the capacity to be an effective evaluator of
prognosis and severity within a wide range of symptom-
atic heart disease patients exercise capacities. Normative
ranges for VE
/VCO2
slopes for adults aged 41–50 years
of age reported to be 25.2±2.919
. Although no established
clinical parameters exist for ventilatory efficiency, a VE
/
VCO2
slope of30or greater, has indicated a CVD patient
with increased risk for cardiac event reoccurrence and or
mortality, while a slope of 34 or greater is associated with
an even poorer prognosis with a greater risk for mortal-
ity10,14
. Further, as a longitudinal measure a progressive
rise in VE
/VCO2
slope over a CVD patients treatment
duration may indicate an advancing decline in cardio-
vascular function and is associated with higher rates of
re-hospitalization and mortality9,10,16
. There is presently
no clear indication if the predictive capacity of the VE
/
VCO2
slope is retained in adults that are clinically at-risk
but asymptomatic for cardiovascular disease. In asymp-
tomatic but clinically at-risk adults, the ventilatory effi-
ciency slope could prove to be a valuable tool in addition
to common CVD risk factors in further describing car-
diovascular health and aid in early identification of CVD.
Therefore, the purpose of this study is to determine the
relationship between clinically relevant CVD risk factors
and the CPET derived measure of ventilatory efficiency
(VE
/VCO2
slope), in a sample of asymptomatic obese
middle-aged adults free of diagnosed heart disease.
Materials and Methods
Subjects
Subjects for this study were prospectively recruited from
a university weight loss program, where data was collected
prior to any weight loss interventions. Exercise testing was
completed on a single visit for all subjects included in the
study. Approval from the university institutional review
board and a written informed consent was obtained prior
to exercise testing and administered to each study subject.
Prior to exercise testing, subjects were stratified into one
of two risk categories based on responses to a self-guided
health history questionnaire citing cardiovascular disease
risk factors. In addition to self-report, we measured total
cholesterol and fasting blood glucose from a fasted blood
sample, resting heart rate, and resting blood pressure
the day prior to CPET testing. Risk stratification was in
accordance to the logic model provided by the American
College of Sports Medicine (ACSM)4
. Testing was per-
formed on low and moderate risk subjects that reported
no signs, symptoms or diagnosis of CVD.
Inclusion Criteria
Study inclusion criteria consisted of subjects having a
body mass index (BMI=kg/m2
) of 30 or greater and being
designated as either low (≤1 CVD Risk Factor) or moder-
ate risk (≥2 CVD Risk Factor) according to the ACSM
3. Ventilatory Slope and CVD Risk
Journal of Cardiovascular Disease Research Vol. 5 / Issue 1 Jan–Mar, 2014 9
logic model for risk stratification4
. Subjects that reported
smoking within the previous 12-months, expressed the
presence of signs and symptoms and or were diagnosed
with cardio-metabolic disease were excluded from the
study. In addition, subjects were required to complete a
health history questionnaire with physician approval for
maximal exercise.
Anthropometric Measures
All subjects underwent a preliminary screening one day
prior to CPET testing between the hours of 7am and
9am. Height was measured three times and averaged to
the nearest tenth of a centimeter. Subject weight was mea-
sured using a digital scale. Weight was measured twice and
averaged to the nearest tenth of a kilogram. The average
height and weight values were used to compute the body
mass index (kg/m2
) for each participant. Resting blood
pressure and resting heart rate were measured twice on
two separate days and averaged for each subject. All mea-
surements were performed after each subject rested in a
chair for five minutes in order to more accurately reflect
true resting values.
Risk Stratification
Subjects were stratified into one of two risk categories
(low vs. moderate) according to the self-reported and
quantified number ofCVD risk factors and following the
logic model provided by the ACSM4
.Specifically, subjects
with ≤1 risk factor for CVD were designated as low risk
and those with ≥2 risk factors for CVD were designated as
moderate risk. The presence of physician diagnosed vas-
cular disease, obstructive or restrictive lung disease, heart
disease, metabolic disease, or major signs and/or symp-
toms of the aforementioned conditions was grounds for
designation as a high risk subject and resulted in exclusion
from exercise testing4
. Determination of the presence of
CVD risk factors were based on established thresholds
set forth by the ACSM in accordance with their risk strati-
fication logic model4
. The positive risk factors include,
age, family history of CVD, tobacco smoking, sedentary
lifestyle, obesity, hypertension, dyslipidemia, and pre-dia-
betes with one negative risk factor for HDL.
Fasted blood samples were obtained via a venipunc-
ture from all subjects on their first day in the laboratory
between the hours of 7am and 11am. Samples were stored
at subzero temperatures (-80˚c until the time of analy-
sis. Analysis consisted of standard colorimetric assays
to quantify total cholesterol (TCHOL) (Thermo Fisher
Scientific, Pittsburgh, PA), total triglycerides (TRIG)
(Thermo Fisher Scientific, Pittsburgh, PA) and fasting
plasma glucose (IFG) (Wako Chemicals, Richmond, VA).
High density lipoprotein-cholesterol (HDL-C) was mea-
sured by the precipitation of apolipoprotein B (apo-B)
containing lipoproteins with a heparin sodium (1.63%
w/v) and MnCl2
-4
H2
O (1 M) solution followed by enzy-
matic measurement of the supernatant for the remaining
cholesterol. Low density lipoprotein-cholesterol (LDL-C)
was determined using the Freidewald Equation for esti-
mating LDL-C.
Respiratory Gas Analysis
Ventilatory expired gas was analyzed using a ParvoMed-
ics metabolic cart and linear pneumotachometer (Par-
voMedics MMS–2400, Salt Lake City, UT). The O2
and
CO2
gas analyzing sensors were calibrated prior to test-
ing using gases with known values for O2
and CO2
(16%
O2
, 4% CO2
) and according to recommended ranges (
3% change from known calibration gas value for O2
and
CO2
). The flow sensor was calibrated using a standard
three liter syringe, also according to recommended ranges
for metabolic testing ( 3% change for both high and low
volumes obtained).
Cardiopulmonary Exercise Testing
Exercise testing with ventilatory expired gas analysis
was conducted on a motorized treadmill (Trackmaster
TMX55, Newton, KS). Following a 4 minute warm-up
at 3 mph and 0% grade (to allow familiarity with tread-
mill and head gear apparatus), each subject performed a
graded exercise test at a constant speed of 3.5 miles per
hour with a 2.5% grade increase at two minute intervals.
Low risk subjects performed the test to volitional fatigue
or until test termination was requested. Moderate risk
individuals performed the exercise test until 76% of maxi-
mal predicted heart rate (220-age) or until a work rate of 6
METS (Metabolic Equivalent, 1 MET=3.5 ml•kg-1
•min-1
)
was achieved. The ranges for percent predicted heart rate
and MET level are consistent with ACSM recommended
ranges for exercise testing of moderate risk persons in
the absence of a physician4
. Procedures for testing low
and moderate risk patients were held constant throughout
the data set. Monitoring of subjects consisted of continu-
ous heart rate recordings at every stage of exercise as well
as rating of perceived exertion (Borg 6–20 scale) at each
stage.
The following variables were collected continuously
throughout the duration of the exercise test: ventilated
oxygen (VO2
ml•kg-1
•min-1
), ventilated carbon dioxide
4. Ventilatory Slope and CVD Risk
10 Journal of Cardiovascular Disease Research Vol. 5 / Issue 1 Jan–Mar, 2014
(VCO2
L•min-1
), and minute ventilation (VE
L•min-1
).
Highest achieved VO2
was expressed as the highest
15-second average value obtained during the last stage of
the exercise test. It should be noted that values of peak
VO2
(for the moderate risk group) are not, by definition,
representative of true peak VO2
or VO2
max as test dura-
tion was limited by the aforementioned termination pro-
tocol and a plateau in the rate of oxygen consumption
was not observed for all subjects. However, values for
both risk groups will subsequently be referred to as VO2
throughout the remainder of the results and discussion.
The slope of VE
/VCO2
was obtained using the propri-
etary software provided on the Parvo Medics metabolic
cart and was defined as the rise in VE
(L∙min-1
BTPS (body
temperature and pressure saturated)) to the increase in
VCO2
(L∙min-1
STPD (standard temperature and pressure
dry)) throughout the entire exercise session.
Statistical Analysis
Results were expressed as mean plus or minus the stan-
dard error of the mean (mean±SE) with significance set
at an alpha level of less than 0.05 (p≤0.05). All statisti-
cal analysis was performed using the Statistical Package
for the Social Sciences (SPSS) version 18 (IBM, Wont-
auk, NY). Subjects were initially divided into two groups
(low risk vs. moderate risk) based on the number of risk
factors present and according to the ACSM logic model
for risk stratification. Group differences between total
number of risk factors, age, BMI, systolic and diastolic
blood pressure, total cholesterol, HDL-C, LDL-C, fasting
glucose, and VE
/VCO2
slope were analyzed with an inde-
pendent T-test. Pearson product moment correlation was
used to determine which risk factors were associated with
the ventilator efficiency slope.
Groups were then combined into one “asymptomatic at-
risk” group for analysis. Stepwise linear regression model-
ing was used to determine which CVD risk factors were
constant predictor variables for the ventilatory efficiency
slope. All quantified risk factors were included, indepen-
dent of significant Pearson correlation, in the predictive
modeling. Following analysis, the predictive model was
assessed for co-linearity with the excluded variables of
the linear regression in the model using beta coefficients.
Results
Low and Moderate Risk Participant Groups
Subjects were divided into low (LR n=7) and moderate
risk (MR n=22) categories based on the total number of
clinically relevant ACSM CVD risk factors obtained via
direct measurement and a self-report questionnaire in
accordance with the logic model provided by the ACSM4
.
Data was analyzed for normal distribution and deter-
mined to be acceptable for parametric analysis. Group
differences were analyzed with a 2-tailed independent
samples t-test and reported in Table 1. There were no
significant differences in group characteristics of age
Table 1 Low vs. Moderate Risk Group Characteristic Comparisons with an Independent samples T-test.
Variable Low Risk (n=7) Moderate Risk (n=22) Significance (p=)
Age (years)
Male
Female
40.6±4.2
n=3
n=4
48.6±2.1
n=6
n=16
0.079
BMI (kg/m2
)† 31.7±1.4 37.3±1.7 0.080
Systolic Blood Pressure(mmHg)† 126.9±3.3 133.3±2.4 0.176
Diastolic Blood Pressure(mmHg)† 82.3±3.6 89.6±1.4* 0.028*
Total Cholesterol (mg·dL-1
) †
170.7 ±8.9 164.6±8.0 0.678
HDL-C (mg·dL-1
) 49.4±4.0 45.7±2.2 0.435
LDL-C (mg·dL-1
)† 106.0±10.2 91.7±8.1 0.378
Fasting Glucose (mg·dL-1
)† 75.6±2.4 99.3±4.3* 0.004*
Total Risk Factors† 1.0 ±0.0 3.9±0.3* 0.001*
Peak VO2
(ml·kg-1
·min-1
) 37.2±3.9 20.7±1.2* 0.001**
VE
/VCO2
Slope¥ 30.1±1.8 29.2±0.9 0.636
Data presented as Mean ± Standard Error, Significance p≤0.05. Body mass index (BMI), High density lipoprotein-cholesterol (HDL-C), low
density lipoprotein-cholesterol, peak maximal oxygen uptake (Peak VO2
), ventilatory efficiency slope (VE
/VCO2
Slope).
*Difference between Low and Moderate Risk Groups
**Different CPET termination criteria
†
Independent variable in regression model
¥ Dependent variable in regression model
5. Ventilatory Slope and CVD Risk
Journal of Cardiovascular Disease Research Vol. 5 / Issue 1 Jan–Mar, 2014 11
(p=0.079) or BMI (p=0.080) between either group. There
were group difference in the positive risk factors of dia-
stolic blood pressure (p=0.028),fasting glucose (p=0.004),
and total number of risk factors (p=0.001).In contrast,
both groups had similar systolic blood pressure (p=0.176),
total cholesterol (p=0.678), HDL-C (p=0.435), LDL-C
(p=0.378), and ventilatory efficiency slope (p=0.636). As
we controlled for exercise intensity termination as a factor
of risk category we did not analyze for statistical differ-
ences in highest achieved VO2
.
Relationships amongst the dependent variable and inde-
pendent variables were determined through the Pearson
Product Moment correlation statistic. There were no sig-
nificant relationships between the ventilatory efficiency
slope and BMI, HDL-C, LDL-C, total cholesterol, total
number of risk factors, fasting blood glucose, and sys-
tolic blood pressure. There were significant relationships
between the ventilatory efficiency slop and diastolic blood
pressure (r= 0.429, p=0.01) and age (r=0.403, p=0.02).
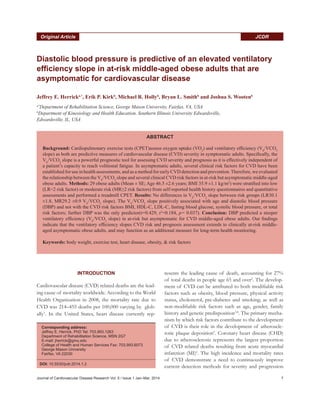
Prediction modeling was performed using quantified
clinically relevant risk factors, which included age, total
number of risk factors, systolic blood pressure, diastolic
blood pressure, BMI, LDL-C, HDL-C, and fasting glu-
cose as independent variables of interest to predict the
variance in the dependent variable (the VE
/VCO2
slope).
With VE
/VCO2
as the dependent variable, diastolic blood
pressure was the only independent variable able to pre-
dict the dependent variable (r=0.429, r2
=0.184, p= 0.037)
(Figure 1). Co-linearity was assessed with the excluded
independent variables within the prediction model using
beta coefficients, and no significant effect size was pres-
ent (Table 2).
Figure 1: Data spread ofthe predictive variable resting diastolic blood
pressure (mmHg) and ventilatoryefficiency slope (VE
/VCO2
).
Table 2 Regression model Beta Coefficients testing for co-linearity with the excluded independent variables and the
dependent variable ventilatory efficiency (VE
/VCO2
Slope).
Independent Variables** Beta Coefficient Significance (p =)
Diastolic Blood Pressure (mmHg)* 0.429 0.037*
Systolic Blood Pressure (mmHg) 0.082 0.696
HDL-C (mg·dL-1
) -0.203 0.308
LDL-C (mg·dL-1
) 0.168 0.395
Fasting Blood Glucose (mg·dL-1
) -0.089 0.657
Body Mass Index (kg/m2
) 0.055 0.801
Age (years) -0.075 0.736
Total Risk Factors -0.147 0.494
Body mass index (BMI), High density lipoprotein-c (HDL-C), low density lipoprotein-C
*Significant predictor for the dependent variable
**Dependent variable is the ventilatory efficiency slope (VE
/VCO2
Slope).
Model Summary (R= 0.429, r2
=0.184, p=0.037)
6. Ventilatory Slope and CVD Risk
12 Journal of Cardiovascular Disease Research Vol. 5 / Issue 1 Jan–Mar, 2014
Discussion
This study compared the relationship between the car-
diopulmonary exercise test (CPET) derived ventilatory
efficiency slope and quantified clinically relevant car-
diovascular disease (CVD) risk factors in asymptomatic
middle-aged obese adults. We found that the ventilatory
efficiency slope was highest in older patients with elevated
diastolic blood pressure suggesting the potential for the
measure to differentiate CVD risk in obese middle-aged
adults that are at-risk but asymptomatic for cardiovascular
disease. In addition, no other single or any combination
of clinically relevant risk factors was predictive of the
ventilatory efficiency slope values in our study. Our find-
ings are significant, as the ventilatory efficiency slope is an
independent measure that may be used for further deter-
mination of CVD prognosis and risk severity in symp-
tomatic adults and its usefulness may extend furtherin
identifying risk in middle-aged at-risk but asymptomatic
obese adults.
Use of the CPET derived ventilatory efficiency slope is
increasing in clinical practice as both a prognostic and
diagnostic tool in heart disease patients. Despite formally
established clinical parametersa clear threshold appears to
exist as CVD patients with slope values of 30 or greater
are at a significant risk for experiencing a cardiac event and
slope values of 34 or greater are associated with a worsen-
ing prognosis, re-hospitalization, and sudden death9,10,16
.
In addition, 10 year normative age ranges for adults 21
to over 60 years of age were from 22.9 to 27.5 respec-
tively, with our population’s age range of 41–50 years old
at 25.219
. However, in adults that are undiagnosed with
CVD, but who are still at-risk as a result of the presence of
clinically relevant characteristics, such as our middle-aged
obese population in this study, the ventilatory efficiency
slope may still retain clinical significance for clarifying
CVD risk progression. Elevated diastolic blood pressure
alongside with age has been shown to be the strongest
predictive measure of CHD in adults below 50 years19
as
represented in this sample (LR 40.6±4.2 years and MR
48.6±2.1 years). In addition, elevated diastolic blood pres-
sure and age appear to increase risk for CVD20
. According
to The Seventh Report of the Joint National Committee
on Prevention, Detection, Evaluation, and Treatment of
High Blood Pressure, for individuals 40 to 70 years of
age each increment of 10mmHg in diastolic blood pres-
sure doubles the risk of CVD across the diastolic blood
pressure range of 75mmHg-115mmHg21
. In addition,
hypertension has long been linked to vascular trauma and
damage to the intimae of systemic blood vessels5,6
, often
resulting in the progression of atherosclerosis, increased
vascular resistance, and ultimately heart disease 3,22–24
. The
predictive relationship between the ventilatory efficiency
slope and diastolic blood pressure underscores its use as a
measure of CVD risk and may provide insight to underly-
ing health of the cardiovascular system in patients absent
of signs and symptoms of heart disease.
One possible explanation of the predictive relationship
between ventilatory efficiency slope and diastolic blood
pressure may be attributed to increased pulmonary ven-
tilation-perfusion mismatch as a result of increased vas-
cular pressure in the lung9,16
. The increased pulmonary
pressure affects gas exchange dynamics by altering partial
pressures of oxygen and carbon dioxide in the lung25,26
.
In addition, research on ventilatory changes in obese
populations have documented shifts in the regional dis-
tribution of pulmonary ventilation from upper to lower
lung regions27
and significant decreases in pulmonary gas
exchange as a result of added fat-mass in the morbidly
obese28
. Since ventilation-perfusion mismatching is the
primary proposed mechanism in the production of a
steep ventilatory efficiency slope, and shifts in pulmonary
ventilation and decreases in pulmonary gas exchange effi-
ciency have been documented in the obese and attributed
to increased vascular resistance in the lung, it is reason-
able to theorize that the elevated vascular resistance as
assessed with diastolic blood pressure in addition to ven-
tilatory adaptations in obesity have significantly contrib-
uted to the steeper slope values exhibited in both the low
and moderate risk groups analyzed in this study (30.1±1.8
and 29.2±0.9, respectively). The use of the ventilatory
efficiency slope to grade the severity of cardiovascular
impairment in diseased populations9,10,16
and an increased
risk of CVD attributable to diastolic hypertension (≥90
mmHg)20
provide evidence that the existing relationship
between diastolic blood pressureis an accurate depiction
of risk for CVD in asymptomatic obese adults.
Presently, peak or highest achieved relative VO2
derived
from CPET is the most commonly used measure in clini-
cal practice to determine functional capacity, grade the risk
severity for CVD, and to stratify patients overall health to
population based norms8
. The strength of peak VO2
as a
measure of the severity of heart disease and cardiac func-
tion arises primarily from the Fick equation and the con-
tribution of cardiac output to peak VO2
. Outside of heart
disease patients, peak VO2
has been evaluated primarily as
an index of cardiorespiratory fitness and aerobic capacity
and the relationship between cardiorespiratory fitness and
health has been enumerated and is reflected in the rec-
ommendations and guidelines for daily physical activity
and the promotion of health and longevity exhibited by
7. Ventilatory Slope and CVD Risk
Journal of Cardiovascular Disease Research Vol. 5 / Issue 1 Jan–Mar, 2014 13
nearly all governing health organizations4
. Low levels of
functional capacity (cardiorespiratory fitness) are associ-
ated with an increased risk of premature death from all
causes, specifically CVD29–31
. However, as an independent
measure in classifying adult health and disease risk, VO2
is
susceptible to the individual capacity to complete a CPET
to near maximal capacity and the inability to reach voli-
tional exhaustion do to conditions outside of functional
capacity may erroneously effect result interpretation. In
contrast, the VE
/VCO2
slopes predictive capacity in CVD
patients is protected from individual effort and may serve
as a more consistent measure of risk over a period of
time. The VE
/VCO2
slope may not be as precise a mea-
sure of cardiac output as VO2
, as it is potentially moder-
ated by pulmonary ventilation-perfusion mismatching and
chemoreceptor sensitivity in addition to cardiac stroke
volume26
. Regardless, as an independent CPET derived
measure the VE
/VCO2
slope may add additional insight
into the underlying health of the cardiopulmonary sys-
tem and particularly in at-risk asymptomatic adults may
be beneficial for long term health monitoring. From our
evidence, and in accordance with work in the CVD popu-
lation, regular CPET testing and measurement of the VE
/
VCO2
slope in addition to VO2
in at-risk asymptomatic
adults may provide an early indication of potential health
risks and aid in early detection. Further investigation into
the efficacy of the VE
/VCO2
slope as a potential indica-
tor of cardiovascular health in at-risk asymptomatic obese
adults is warranted.
There are a few study limitations that should be consid-
ered in regard to our work. First, although we screened
and excluded subjects with any form of cardiopulmonary
disease, there is the chance that a subject has undiagnosed
lung disease which would elevate the ventilatory effi-
ciency slope independent of cardiac output. Second, the
generalizability of our findings are limited by our small
homogenous sample size, and although we report sig-
nificant relationships between ventilatory efficiency and
diastolic blood pressure in obese middle-age adults, such
a relationships may not be valid in every sub-population
of adults. Therefore, larger scale studies are warranted to
extend on our preliminary findings and confirm the use
of the ventilatory efficiency slope as an indicator of heart
disease risk in at-risk asymptomatic adults.
In conclusion, we report a significant predictive relation-
ship between the CPET derived ventilatory efficiency
slope and diastolic blood pressure in at-risk asymptomatic
middle-aged obese adults. In addition to diastolic blood
pressure, age was the only other potential risk factor that
was positively associated with the ventilatory efficiency
slope in our study. Our findings may suggest that sub-
maximal or maximal CPET derived ventilatory efficiency
slopesmay contribute to the early detection of advanced
risk for CVD in asymptomatic middle-aged obese adults
and provide a potential measure for long term health mon-
itoring. Further, the capacity of the ventilatory efficiency
slope to retain predictive capacity in un-diagnosed adults
that are at-risk for CVD provides clinicians and exercise
professionals with a valuable tool to further understand a
patients risk and track their health over a course of care.
Disclosure
The authors of this manuscript report no real or per-
ceived conflicts of interest in regard to the findings or
methods employed within this project.
REFERENCES
1. World statistics 2009. http://www.who.int/whosis/whostat/2008/es/index.
html
2. Kochanek, KD, Xu JQ, Murphy, SL, et al. Deaths: Preliminary data for
National vital statistics reports. 2009; (2011); 59 (4). Hyattsville, MD:
National Center for health Statistics.
3. Soler E, Ruiz V. Epidemiology and Risk Factors of Cerebral Ischemia and
Ischemic Heart Diseases: Similarities and Differences. Current Cardiology
Reviews. 2010; 6(3): 138–49.
4. Thompson WR, Gordon NF, and Pescatello LS. ACSM’s Guidelines for
Exercise Testing and Prescription 8th Edition. Philadelphia, PA: Lippincott
Williams Wilkins. 2009.
5. White, HD, Chew, DP. Acute myocardial infarction. Lancet. 2008;
372(9638): 570–84.
6. Libby P P. The molecular mechanisms of the thrombotic complications of
atherosclerosis. J Int Med. 2008; 263(5): 517–27.
7. “Cardiovascular diseases (cvds): key facts.” Cardiovascular diseases
(CVDs). WHO, 2011. Web. 16 Jan 2012.
8. Mancini DM, Eisen H, Kussmaul W, Mull R, Edmunds LH Jr, Wilson JR.
Value of peak exercise oxygen consumption for optimal timing of cardiac
transplantation in ambulatory patients with heart failure. Circulation. 1991;
83: 778–86.
9. Arena R, Myers J, Aslam SS, Varughese EB, Peberdy MA. Peak VO2 and
VE/VCO2
slope in patients with heart failure: a prognostic comparison. Am
Heart J. 2004; 147: 2, 354–60.
10. Corrà U, Mezzani A, Bosimini E, Scapellato F, Imparato A, Giannuzzi P.
Ventilatory response to exercise improves risk stratification in patients
with chronic heart failure and intermediate functional capacity. Am Heart
J. 2002; 143: 418–26.
11. Mudge GH, Goldstein S, Addonizio LJ, Caplan A, Mancini D, Levine TB,
Ritsch ME Jr, Stevenson LW.. 24th Bethesda conference: Cardiac
transplantation. Task Force 3: Recipient guidelines/prioritization. J Am Coll
Cardiol. 1993; 22(1): 21–31.
12. Weber KT, Janicki JS, Shroff SG, Likoff MJ. The cardiopulmonary unit.
The body’s gas transport system. Clinics in Chest Medicine. 1983; 4(2):
101–10.
13. Milani RV, Lavie CJ, Mehra MR, Ventura HO. Understanding the basics
of cardiopulmonary exercise testing. Mayo Clinic Proceedings. Mayo
Clinic. 2006; 81(12): 1603–11.
14. Wasserman, K. Diagnosing cardiovascular and lung pathophysiology from
exercise gas exchange. Chest. 1997; 112:1091–101.
15. Arena R, Myers J, Abella J, Peberdy MA, Bensimhon D, Chase P, Guazzi
M. Development of a ventilatory classification system in patients with heart
failure. Circulation. 2007; 115: 2410–7.
16. Francis DP, Shamim W, Davies LC, et al. Cardiopulmonary exercise
testing for prognosis in chronic heart failure: continuous and independent
prognostic value from VE/VCO2 slope and peak VO2. Eur Heart J. 2000;
21: 154–61.
8. Ventilatory Slope and CVD Risk
14 Journal of Cardiovascular Disease Research Vol. 5 / Issue 1 Jan–Mar, 2014
17. Opasich C, Pinna GD, Bobbio M, et al. Peak oxygen consumption in
chronic heart failure: toward efficient use in the individual patient. J A Coll
Cardiol. 1998; 31: 766–75.
18. Myers J, Gullestad L, Vagelos R, et al. Cardiopulmonary exercise testing
and prognosis in severe heart failure: 14 mL/kg/min revisted. Am Heart J.
1998; 139: 78–84.
19. Sun XG, Hansen, JE, Garatcha, N, Storer TW, Wasserman, K. Ventilatory
Efficiency during exercise in healthy subjects. Am J Respir Crit Care Med.
2002; 166: 1443–8.
20. Franklin SS, Larson MG, Khan SA, Wong ND, Leip EP, Kannel WB, Levy
D. Does the Relation of Blood Pressure to Coronary Heart Disease Risk
Change With Aging? The Framingham Heart Study. Circulation. 2001;
103:1245–9.
21. Chobanian, AV, Bakris, GL, Black, HR, Cushman, WC, Green, LA, Izzo,
JL, Jones, DW, Materson, BJ, Opraril, S, Wright, JT, Roccella, EJ. National
High Blood Pressure Education Program. The Seventh Report of the Joint
National Committee on Prevention, Detection, Evaluation, and Treatment
of High Blood Pressure (JNC7). Washington, DC. 2003; 03–5233.
22. Lorgis LL, Zeller MM, Beer JC, Lagrost AC, Buffet PP, L’Huiller II, Cottin
YY. Epidemiologie du syndrome coronaireaigu en Europe. (French).
Annales De Cardiologie D’angeiologie. 2007; 56S2–S7.
23. Bello, N, Mosca, L, Epidemiology of coronary heart disease in women,
Progress in Cardiovascular Diseases. 2004; 46(4): 287–95.
24. Zile MR and Brutsaert DL. New concepts in diastolic dysfunction and
diastolic heart failure: Part II: Causal Mechanisms and Treatment.
Circulation. 2002; 105: 1503–8.
25. Guazzi M, Myers J, Arena R. Cardiopulmonary exercise testing in the
clinical and prognostic assessment of diastolic heart failure. J Am Coll
Cardiol. 2005; 46: 1883–90.
26. Mancini D and Le Jemtel TH. Isventilatory classification preferable to peak
oxygen consumption for risk stratification in heart failure? Circulation.
2007; 115: 2376–8.
27. Holley HS, Milic-Emili J, Becklake MR, Bates DV. Regional distribution of
pulmonary ventilation and perfusion in obesity. J Clin Invest. 1967; 46(4):
475–81.
28. Zavorsky GS and Hoffman SL.. Pulmonary gas exchange in the morbidly
obese. Obesity reviews. 2008; 326–9.
29. Blair SN, Kohl HW, Barlow CE. Physical fitness and all-cause mortality: a
prospective study of health and unhealthy men. JAMA. 1995; 273:1093–8.
30. Blair SN, Kohl HW, Paffenbarger Jr RS. Physical fitness and all-cause
mortality: a prospective study of healthy men and women. JAMA. 1989;
262: 2395–401.
31. Belardinelli R, Georgiou D, Scocco V, et al. Low intensity exercise training
in patients with chronic heart failure. J Am Coll Cardiol. 1995; 26: 975–82.