NECSI Workshop Project Summer 2013

This study uses complexity theory to examine the local response to the San Francisco earthquake of 1906. The aim is to reveal how the structure and dynamical behavior of the central city’s primary sub-systems at a small and large scale both enhanced and inhibited relief efforts. Not only does this provide a (comparative) basis for re-evaluating the causes of the relative successes and failings of more recent disaster recovery efforts, e.g. Hurricane Katrina, it also may highlight how the structure other contemporary cities may or may not be well matched to the complexity and scale of natural disasters. One of the significant focuses in the study of complex systems is in the description of the complexity profile. Complexity profile places emphasis on the scale at which a given behavior of a system is observable and the extent of the impact on its environment. According to Bar-Yam (1997), the complexity profile counts the number of independent behaviors that are visible at a particular scale and includes all of the behaviors that have impact on larger scales. A formal definition of scale considers the spatial extent, time duration, momentum and energy of a behavior. In other words, Scale refers to the size of a system or property or to the precision of observation or description. In the second step, we decided the interrelationships of the agents. As shown in figure 1, agents were considered as nodes and interrelationships were considered as links. We connected the agents by an arrow if they interdependent. In the next step, we agreed upon the scale at which we were interested in describing complexity (or Shannon entropy/information) of the system/city. Scale in our study was restricted to aggregate behavior of each of the agents. References Bar-Yam, Yaneer, 1997, Dynamics of Complex Systems, Westview Press, 864 pp. James, William, 1911, Memories and studies, New York, Longmans, Green. San Francisco Board of Supervisors, 1907, Municipal Reports on THE SAN FRANCISCO EARTHQUAKE AND FIRE OF APRIL 18,1906.

Recommended
More Related Content
Recently uploaded
Recently uploaded (20)
Featured
Featured (20)
NECSI Workshop Project Summer 2013
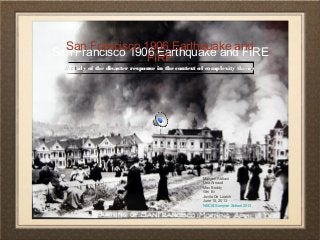
- 1. San Francisco 1906 Earthquake and FIRE San Francisco 1906 Earthquake and FIRE A study of the disaster response in the context of complexity theoryA study of the disaster response in the context of complexity theory Maisam Abbasi Lisa Arnaud Max Boddy Wei Bi Jovita De Loatch June 15, 2013 NECSI Summer School 2013
- 2. The Disaster Dead - More than 3,000 • A report of U.S. Army relief operations (Greely, 1906) recorded: ◦ 498 deaths in San Francisco ◦ 64 deaths in Santa Rosa ◦ 102 deaths in and near San Jose • A 1972 NOAA report suggested that 700-800 was a reasonable figure. • Gladys Hansen and Emmet Condon, after extensive research, estimated that over 3000 deaths were caused directly or indirectly by the catastrophe. The population of San Francisco at the time was about 400,000. Homeless - 225,000 • 225,000 from a population of about 400,000. Buildings Destroyed - 28,000 • "The 3-day conflagration following the earthquake caused substantially more damage than did the earthquake. The area of the burned district covered 4.7 square mile..." (NOAA report). By one count: ◦ Wood buildings lost = 24,671 Brick buildings lost = 3,168
- 3. Copyright: Laura Hartman Maestro
- 4. Defining the Complexity Profile Scale Scale -Cluster of agents (divided by occupation) Miners (M) Sailors/Argonauts (A) Providers of illicit services (I) Bankers (B) Port officials/workers (P) Food producers (Farmers/Fishers) (F) Commodity providers (e.g. equipment, materials) (D) Tradespeople working in the building and construction industry (C), Members of government US Federal (U) and SF local (G).
- 5. System components Fine scale description of the network Fine scale description of the network Miners (M) geographical remoteness and small size, mining colonies were linked into a vast transportation, communications, demographic, and economic network on a national and international scale (Hardesty 1988:1). As a collective, highly connected to other industries including banking, personal (illicit) services, port operations and commodity retailers. Formed a highly flexible, adaptable and self-organising network, with minimal legal structures and absence of practical enforcement mechanisms.
- 6. System components Fine scale description of the network Fine scale description of the network Sailors/Argonauts(A), The famous Barbary Coast of the mid to late 1800s and its associated saloons, boarding houses, and gambling parlors was the home to a shifting population of stevedores, sailors, merchant marines, etc. Mariners themselves upon leaving their vessels were not subject to the same level of regulation, allowing for more random and frequent interactions with other agents/sub- systems, particularly the service providers and miners. Outside of the shipping company regime, sailors were almost completely independent, with extensive freedom in their activities. The Port (P) as an industry was naturally a central hub of the city and its operations would have been subject to considerable coordination.
- 7. System components Fine scale description of the network Fine scale description of the network Providers of Illicit Services(I), Nearly all drinking and dancing establishments in the area were destroyed in the fire that followed the 1906 earthquake. Prior to the quake their activities they sought extensive freedom in their activities of prostitution, and gambling. However, in response to the calamity the banded together and within months a dozen or so were rebuilt and back in business.
- 8. System components Fine scale description of the network Fine scale description of the network Food producers (farmers and fishermen)(F), were highly independent and diversified
- 9. System components Fine scale description of the network Fine scale description of the network Commodity providers (e.g. equipment, materials) (D) and Tradespeople (C) working in the building and construction industry were highly independent and diversified.
- 10. System components Fine scale description of the network Fine scale description of the network Bankers (B), The 1906 San Francisco earthquake shook the financial markets of the West Coast and briefly shut down the Pacific Stock Exchange. They were also highly independent and diversified of each other but were hiearchically organized by their funding source.
- 11. System components Fine scale description of the network Fine scale description of the network Government (G), the army was brought in to control the fires (which they did with dynamite and even artillery barrages) and stop the looting. In all, 500 presumed looters were shot. Some destruction and loss of life occurred outside San Francisco, but the bulk of the 3.000 casualties were to be regretted in the Golden Gate city itself. Three quarters of its population of 400.000 were made homeless. Half of those fled across the Bay to Oakland and Berkeley, others took up residence in massive camps of shacks and tents at Golden Gate Park and the Presidio, among other places.
- 12. Disaster Response At large scale – •Minimal organization/low complexity •8 member committee appointed; federal gvt funding •Under-resourced city emergency services •Federal govt – funding and army services. •Fires caused by failed army response! Fine scale – •highly self-organising, high complexity •Citizens required to work in cooperation ; communal soup kitchens •Citizens response was rapid and directly responded to diverse needs (shelter, food) •BUT: Looting and riots; racism (Chinese excluded from city/community efforts)
- 13. Recovery not Transformation Return to (semi) equilibrium ∀ 2 years for major recovery effort – city system weakened but no collapse ∀ Strategic objective - fast return to “Bus. As usual” ∀ Strategic ‘cover up’ process - minimize loss of investment ∀ Building standards relaxed – short term goals prioritized ∀ Engineered resilience (return to equilibrium ASAP) ∀ System stays in same basin of attraction, but future vulnerability
- 14. How complex is the system? Shannon Entropy - Impact on the City -We looked upon the interrelationships
- 15. LABOR - Before the Earthquake
- 16. LABOR - The Earthquake
- 17. labor - During the Fire
- 18. labor - Beginning the Recovery
- 19. labor - Restoration from the Earthquake
- 20. Economy - Before the Earthquake
- 21. Economy - During the Earthquake
- 22. Economy - During the Fire
- 23. Economy - Beginning the Restoration