Austria vs France David Alaba Switches Position to Defender in Austria's Euro...
Fly genetics lab experiments show dominant and recessive traits
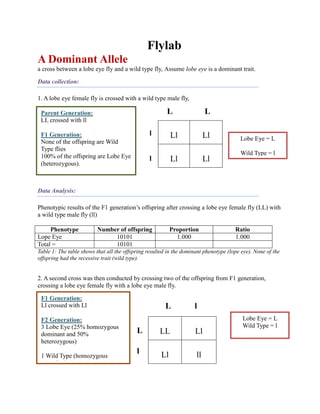
1. Flylab<br />A Dominant Allele<br />a cross between a lobe eye fly and a wild type fly, Assume lobe eye is a dominant trait.<br />Data collection:<br />1. A lobe eye female fly is crossed with a wild type male fly,<br />L LParent Generation:LL crossed with llF1 Generation:None of the offspring are Wild Type flies100% of the offspring are Lobe Eye (heterozygous). <br />LlLlLlLl <br />ll<br />Lobe Eye = LWild Type = l<br />Data Analysis:<br />Phenotypic results of the F1 generation’s offspring after crossing a lobe eye female fly (LL) with a wild type male fly (ll)<br />PhenotypeNumber of offspringProportionRatioLope Eye101011.0001.000Total =10101<br />Table 1: The table shows that all the offspring resulted in the dominant phenotype (lope eye). None of the offspring had the recessive trait (wild type). <br />2. A second cross was then conducted by crossing two of the offspring from F1 generation, crossing a lobe eye female fly with a lobe eye male fly. <br />LLLlLlll <br />L lF1 Generation:Ll crossed with LlF2 Generation:3 Lobe Eye (25% homozygous dominant and 50% heterozygous)1 Wild Type (homozygous recessive)<br />Wild Type = S Shaven Bristle = s<br />Lobe Eye = L Wild Type = l<br />Ll<br />Data analysis:<br />Phenotypic results of the offspring in the F2 generation after crossing two heterozygous genotype, lobe eye flies (Ll) from the F1 generation<br />PhenotypeNumber of offspringProportionRatioWild type24540.24871.000Lobe Eye74150.75133.022Total = 9896<br />Table 2: The table shows the results of the phenotypes of F2 generation after crossing a heterozygous female and male lobe eye from F1 generation. The numbers of offspring that are lobe eye are more than offspring that are wild type, the ratio of being 3:1.<br />Chi-Square Analysis:<br />A Chi-Square showing the relationship of the data collected from the number of offspring in the F2 generation to what is expected/ suppose to happen<br />PhenotypeObservedHypothesisExpectedChi-Square TermWild type24542500.00002467.25000.0712Shaven Bristle74157500.00007401.75000.0237Total =989610000.00009869.00000.0949<br />Table 3: The table shows the number of offspring produced in the F2 generation as the observed. The hypothesis is the number of offspring predicted. The chi-square total was then calculated using the chi-square formula. The numbers from the expected and the hypothesis is used to determine the significance of the data. <br />Overall results of the Chi-Square test:<br />Chi-Squared Test Statistic = 0.0949<br />Degrees of Freedom = 1<br />Level of Significance = 0.7581<br />Recommendation: Do not reject your hypothesis<br />Conclusion:<br />According to the punnett squares conducted, none of the offspring should have the homozygous recessive phenotype due to the crossing of a homozygous dominant with a homozygous recessive genotype (SS x ss). In the F2 generation, the punnett square demonstrates a ratio of 3:1, as the results. In the F2 generation the ratio 3.022 to 1.000 which if rounded is the ratio 3:1. For that reason, the Chi-Square was then conducted to prove whether the 3:1 ratio supported the ratio of the number of offspring produced in the experiment. The recommendation is to not reject the hypothesis. In conclusion, a 3:1 ratio, dominant to recessive, in the F2 generation as illustrate in table. The hypothesis was supported and lobe eye fly is a dominant allele.<br />A Recessive Allelea cross between a shaven bristle fly and a wild type fly, Assume shaven bristle is a recessive trait.<br />Data collection:<br />1. A shaven bristle female fly is crossed with a wild type male fly, <br />Parent Generation:SS crossed with ssF1 Generation:None of the offspring are Shaven Bristle flies100% of the offspring are Wild Type (heterozygous).S S <br />SsSsSsSs <br />ss<br />Wild Type = S Shaven Bristle = s<br />Data Analysis:<br />Phenotypic results of the F1 generation’s offspring after crossing a shaven bristle female fly (ss) with a wild type male fly (SS)<br />PhenotypeNumber of offspringProportionRatioWild type99431.0001.000Total =9943<br />Table 1: The table shows that all the offspring resulted in the dominant phenotype (wild type). None of the offspring had the recessive trait (shaven bristle). <br />2. A second cross was then conducted by crossing two of the offspring from the F1 generation, crossing a wild type female fly with a wild type male fly. <br />SSSsSsss <br />S sF1 Generation:Ss crossed with SsF2 Generation:3 Wild Type (25% homozygous dominant and 50% heterozygous)1 Shaven Bristle (homozygous recessive)<br />Wild Type = S Shaven Bristle = s<br />Wild Type = S Shaven Bristle = s<br />Ss<br />Data analysis:<br />Phenotypic results of the offspring in the F2 generation after crossing two heterozygous genotype, wild type flies (Ss) from the F1 generation<br />PhenotypeNumber of offspringProportionRatioWild type75990.75713.117Shaven Bristle24380.24291.000Total = 10037<br />Table 2: The table shows the results of the phenotypes of F2 generation after crossing a heterozygous female and male wild type from F1 generation. The numbers of offspring that are shaven bristle are less than offspring that are wild type, the ratio of being 3:1.<br />Chi-Square Analysis:<br />A Chi-Square showing the relationship of the data collected from the number of offspring in the F2 generation to what is expected/ suppose to happen<br />PhenotypeObservedHypothesisExpectedChi-Square TermWild type75997500.00007527.75000.6744Shaven Bristle24382500.00002509.25002.0231Total =1003710000.000010037.00002.6975<br />Table 3: The table shows the number of offspring produced in the F2 generation as the observed. The hypothesis is the number of offspring predicted. The chi-square total was then calculated using the chi-square formula. The numbers from the expected and the hypothesis is used to determine the significance of the data. <br />Overall results of the Chi-Square test:<br />Chi-Squared Test Statistic = 2.6975<br />Degrees of Freedom = 1<br />Level of Significance = 0.1005<br />Recommendation: Do not reject your hypothesis<br />Conclusion:<br />According to the punnett squares conducted, none of the offspring should have the homozygous recessive phenotype due to the crossing of a homozygous dominant with a homozygous recessive genotype (SS x ss). In the F2 generation, the punnett square demonstrates a ratio of 3:1, as the results. In the F2 generation the ratio 3.117 to 1.000 which if rounded is the ratio 3:1. For that reason, the Chi-Square was then conducted to prove whether the 3:1 ratio supported the ratio of the number of offspring produced in the experiment. The recommendation is to not reject the hypothesis. In conclusion, a 3:1 ratio, dominant to recessive, in the F2 generation as illustrate in table. The hypothesis was supported and shaven bristle fly is a recessive allele. <br />A Dominant Sex-Linked Allelea cross between a bar eye fly and a wild type fly, Assume bar eye is a dominant sex-linked allele.<br />Data collection:<br />1. A Bar Eye female fly is crossed with a Wild Type male fly, <br />Parent Generation:XBXB crossed with XbY F1 Generation:4 or 100% Bar Eyes female and maleXB XB <br />XBXbXBXbXBYXBY<br />Bar Eye = XBWild Type = Xb Xb Y<br />Data Analysis:<br />Phenotypic results of the F1 generation’s offspring after crossing a Bar Eye female fly (XBXB) with a Wild Type male fly (XbY)<br />PhenotypeNumber of offspringProportionRatioFemale: Bar Eye50350.50231.009Male: Bar Eye49880.29771.000Total = 10023<br />Table 1: The table shows a dominant sex-linked allele of a cross between a Bar Eye female and a Wild Type male which shows that, 100% of the offspring, have bar eyes.<br /> 2. A second cross was then conducted by crossing two of the offspring from F1 generation, crossing a Bar Eye female fly and a Bar Eye male fly. <br />XBXBXBXbXBYXbY <br />F1 generation:XBXb crossed with XBYF2 generation:2 Bar Eye female (100% for female)1 Bar Eye male (50% for male)1 Wild Type male (50% for male)3:1 ratio: Bar Eye, dominant over recessiveXB Xb<br />Bar Eye = XBWild Type = XbXBY<br />Data analysis:<br />Phenotypic results of the offspring from the F1 generation after crossing a female with Bar Eye (XBXb) with a Wild Type male (XBY)<br />PhenotypeNumber of offspringProportionRatioFemale: Bar Eye49110.49551.000Male: Bar Eye25050.25271.968Male: Wild Type24950.25171.004Total =9911<br />Table 2: The table shows the offspring of the F1 generation after crossing a Bar Eye female fly with Bar Eye male demonstrating a dominant sex-linked allele.<br />Chi-Square Analysis:<br />A Chi-Square showing the relationship of the data collected from the number of offspring in the F2 generation to what is expected/ suppose to happen <br />PhenotypeObservedHypothesisExpectedChi-Square TermWild Type24953000.00002477.75000.1201Bar Eyes74167000.00007433.25000.0400Total = 991110000.00009911.00000.1601<br />Table 3: The table shows the number of offspring produced in the F2 generation as the observed. The hypothesis is the number of offspring predicted. The chi-square total was then calculated using the chi-square formula. The numbers from the expected and the hypothesis is used to determine the significance of the data. <br />Overall results of the Chi-Square test:<br />Chi-Squared Test Statistic = 0.1601<br />Degrees of Freedom = 1<br />Level of Significance = 0.6890<br />Recommendation: Do not reject your hypothesis<br />Conclusion:<br />The hypothesis was supported. The punnett grids prove that the trait for bar eyes is a dominant sex-linked because first of all, the female parent started with bar eyes, homozygous dominant, that means all the offspring would have the trait even if the male parent was a wild type. Secondly, the dominant sex-linked trait acts like a dominant trait, therefore, the F2 generation should show a 3:1 ratio, which is what is shown above with the Chi-Square. The results of the Chi-Square suggest that the data collected is significant and that the predicted ratio of 3:1 is relevant to the number of offspring produced in the F2 generation. The numbers of offspring complement the punnett squares conducted in the data collection and follows what was expected as accordingly to the evidence in the punnett squares. Bar eyes is a dominant sex-linked allele.<br />A Recessive Sex-Linked Allelea cross between a Sable Body Color fly and a Wild Type fly, Assume Sable Body Color is a recessive sex-linked allele.<br />Data collection:<br />1. A Sable Body Color female fly is crossed with a Wild Type male fly, <br />Parent Generation:XsXs crossed with XSY F1 Generation:2 Wide Type Female (carrier)2 Sable Body Color MaleXs Xs <br />XS XsXS XsXs YXs Y<br />Wild Type = XSSable Body Color= Xs XS Y<br />Data Analysis:<br />Phenotypic results of the F1 generation’s offspring after crossing a sable color body female fly (XS Xs) with a wild type male fly (Xs Y)<br />PhenotypeNumber of offspringProportionRatioFemale: Wild Type49730.50011.000Male: Sable Body Color49710.49991.000Total = 9944<br />Table 1: The table shows a recessive sex-linked allele which shows that approximately half of the offspring were sable body color, and the other half is wild type. <br /> <br />2. A second cross was then conducted by crossing two of the offspring from the F1 generation, crossing a wild type female fly which is a carrier with a sable body color male fly. <br />XSXsXsXsXSYXsY <br />F1 Generation:XSXs crossed with Xs YF2 Generation:1 Wild Type Female (carrier)1 Sable Body Color Female 1 Wild Type Male1 Sable Body Color MaleXS Xs<br />Wild Type = S Shaven Bristle = s<br />Wild Type = XSSable Body Color= XsXsY<br />Data analysis:<br />Phenotypic results of the offspring from the F1 generation after crossing a female with Sable Body Color (XS Xs ) with a Wild Type male (Xs Y)<br />PhenotypeNumber of offspringProportionRatioFemale: Wild type24810.24891.004Male: Wild type25050.25131.014Female: Sable Body Color24710.24791.000Male: Sable Body Color25100.25181.016Total =9967<br />Table 2: The table shows the number offspring as the result of crossing a female Wild Type with a Sable Body Color male, thus the ratio is 1:1:1:1.<br />Chi-Square Analysis:<br />A Chi-Square showing the relationship of the data collected from the number of offspring in the F2 generation to what is expected/ suppose to happen <br />PhenotypeObservedHypothesisExpectedChi-Square TermFemale: Wild type24812500.00002491.75000.0464Male: Wild type25052500.00002491.75000.0705Female: Tan body24712500.00002491.75000.1728Male: Tan body25102500.00002491.75000.1337Total =99671000.00009967.00000.4233<br />Table 3: The table shows the number of offspring produced in the F2 generation as the observed. The hypothesis is the number of offspring predicted. The chi-square total was then calculated using the chi-square formula. The numbers from the expected and the hypothesis is used to determine the significance of the data. <br />Overall results of the Chi-Square test:<br />Chi-Squared Test Statistic = 0.4233<br />Degrees of Freedom = 3<br />Level of Significance = 0.9354<br />Recommendation: Do not reject your hypothesis<br />Conclusion:<br />According to the experiment results for the F1 and F2 generations, F1 generation had a ratio of 2:2. The number of offspring was approximately half of the total (9944) for the female and the male phenotypes. The F2 generation resulted in a ratio of 1:1:1:1. The numbers of offspring produced in the generation were somewhat close. The Chi-Square was then carry out to determine the significance of the data and if the expected results supported the actual numbers. 2500 was entered as the hypothesis because of the 1:1:1:1 ratio since the total is 10000 offspring. The Chi-Square recommended to not rejecting the hypothesis. As a result, the hypothesis was supported; Sable Body Color is a recessive sex-linked trait.<br />A Dominant Lethal Allelea cross between an Aristapedia Antenna and a Wild Type fly, Assume Aristapedia Antenna is a dominant lethal allele.<br />Data collection:<br />1. An Aristapedia Antenna female fly is crossed with a Wild Type male fly, <br />A AParent Generation:AA crossed with aa F1 Generation:2 Aristapedia Antennae female (50%)2 Wild Type male (50%) <br />AaAaAaAa<br />Aristapedia Antenna = AWild Type = a a a<br />Data Analysis:<br />Phenotypic results of the F1 generation’s offspring after crossing an Aristapedia Antenna female fly (XBXB) with a Wild Type male fly (XbY)<br />PhenotypeNumber of offspringProportionRatioWild Type50970.50381.015Aristapedia Antenna50210.49621.000Total = 10118<br />Table 1: The table shows a dominant sex-linked allele of a cross between a Bar Eye female and a Wild Type male which shows that, 100% of the offspring, have bar eyes.<br /> 2. A second cross was then conducted by crossing two of the offspring from F1 generation, crossing a Bar Eye female fly and a Bar Eye male fly. <br />AAAaAaaa <br />F1 generation:Aa crossed with AaF2 generation:AA is lethal.2 aristapedia : 1 wild typeA a<br />Aristapedia Antenna = AWild Type = aAa<br />Data analysis:<br />Phenotypic results of the offspring from the F1 generation after crossing a female with Bar Eye (XBXb) with a Wild Type male (XBY)<br />PhenotypeNumber of offspringProportionRatioAristapedia Antenna65620.33571.000Wild Type 33160.66431.979Total =9878<br />Table 2: The table shows the offspring of the F1 generation after crossing a Bar Eye female fly with Bar Eye male demonstrating a dominant sex-linked allele.<br />Chi-Square Analysis:<br />A Chi-Square showing the relationship of the data collected from the number of offspring in the F2 generation to what is expected/ suppose to happen <br />PhenotypeObservedHypothesisExpectedChi-Square TermWild Type33161.00003292.66670.1654Aristapedia Antenna65622.00006585.33330.0827Total = 98783.00009878.00000.2480<br />Table 3: The table shows the number of offspring produced in the F2 generation as the observed. The hypothesis is the number of offspring predicted. The chi-square total was then calculated using the chi-square formula. The numbers from the expected and the hypothesis is used to determine the significance of the data. <br />Overall results of the Chi-Square test:<br />Chi-Squared Test Statistic = 0.2480<br />Degrees of Freedom = 1<br />Level of Significance = 0.6185<br />Recommendation: Do not reject your hypothesis<br />Conclusion:<br />The hypothesis was supported. The punnett grids prove that the trait for bar eyes is a dominant sex-linked because first of all, the female parent started with bar eyes, homozygous dominant, that means all the offspring would have the trait even if the male parent was a wild type. Secondly, the dominant sex-linked trait acts like a dominant trait, therefore, the F2 generation should show a 3:1 ratio, which is what is shown above with the Chi-Square. The results of the Chi-Square suggest that the data collected is significant and that the predicted ratio of 3:1 is relevant to the number of offspring produced in the F2 generation. The numbers of offspring complement the punnett squares conducted in the data collection and follows what was expected as accordingly to the evidence in the punnett squares. Bar eyes is a dominant sex-linked allele.<br />