SlideShare une entreprise Scribd logo
1  sur  8
A Reanalysis of the Ancient Mitochondrial DNA Sequences Recovered from
Neandertal Bones
Gabriel Gutierrez,* Diego Sanchez,† and Antonio Marın*
            ´              ´                       ´
*Departamento de Genetica, Universidad de Sevilla, Spain; and †Instituto de Biologıa y Genetica Molecular,
                      ´                                                           ´       ´
Universidad de Valladolid, Spain

       Recent reports analyzing mitochondrial DNA sequences from Neandertal bones have claimed that Neandertals and
       modern humans are different species. The phylogenetic analyses carried out in these articles did not take into
       account the high substitution rate variation among sites observed in the human mitochondrial D-loop region and
       also lack an estimation of the parameters of the nucleotide substitution model. The separate phylogenetic position
       of Neandertals is not supported when these factors are considered. Our analysis shows that Neandertal-Human and
       Human-Human pairwise distance distributions overlap more than what previous studies suggested. We also show
       that the most ancient Neandertal HVI region is the most divergent when compared with modern human sequences.
       However, the opposite would be expected if the sequence had not been modified since the death of the specimen.
       Such incongruence is discussed in the light of diagenetic modifications in ancient Neandertal DNA sequences.

Introduction
      The classical view emerging from anatomical and                        tide substitution nor estimated the model parameters (ta-
archeological studies places Neandertals as a different                      ble 1). An abundant literature (Yang, Goldman, and Fri-
species from Homo sapiens. This is in agreement with                         day 1994; Swofford et al. 1996; Huelsenbeck and Ran-
the Out-of-Africa hypothesis (Cann, Stoneking, and Wil-                      nala 1997; Brocchieri 2001; Posada and Crandall 2001)
son 1987), which predicts that Neandertals coexisted                         emphasizes the need for an accurate estimation of the
without mating with modern humans who originated in                          nucleotide substitution model and parameters, correction
Africa from 100,000 to 200,000 years ago (Stringer and                       for among-site rate variation, taxa sampling, and selec-
Andrews 1988). Instead, recent anatomical and paleon-                        tion of the outgroup to attain a correct tree
tological research (Wolpoff et al. 2001) supports the                        reconstruction.
multiregional hypothesis, which propounds that some                                The purpose of this article is to reanalyze the avail-
populations of archaic Homo evolved into modern hu-                          able Neandertal DNA sequence data. After selecting the
man populations in many regions. Consequently, Nean-                         appropriate extant human D-loop data sets, we used the
dertals could have contributed to the genetic pool of                        maximum-likelihood principle for model selection and
present-day Europeans.                                                       parameter estimation to perform a novel phylogenetic
      Studies about modern human genetic diversity                           reconstruction.
(Foley 1998; Jorde et al. 2000) assume that Neandertals
were not related to modern humans, although such as-                         Data and Methods
sumptions have been extensively debated (Nordborg                            Sequences and Data Sets
1998; Hawks and Wolpoff 2001; Relethford 2001).
      Five mitochondrial DNA D-loops have been recov-                             We have used the MOUSE 1.0 database (Burchardt,
ered from Neandertal bones (Krings et al. 1997; Krings                       von Haeseler, and Meyer 1999), an aligned compilation
et al. 1999; Krings et al. 2000; Ovchinnikov et al. 2000).                   of mtDNA control regions of primate species that con-
Henceforth, we will refer to these research groups as the                    tained the Feldhofer Neandertal sequences. An earlier
Neandertal sequencing groups (NSGs). The phylogenet-                         version of this database (HvrBase) was used by the
ic analyses of these sequences located Neandertal DNA                        NSG. Other Neandertal sequences were retrieved from
at the base of modern human diversity (fig. 2C), sug-                         GenBank (table 1) and manually aligned to our
gesting that the Neandertal genes probably did not con-                      MOUSE-selected data sets.
tribute to the modern human genetic pool.                                         We carried out two analyses: the first analysis con-
      However, the human D-loop region shows an ex-                          cerns the HVI region and includes three Neandertal se-
treme variation in the substitution rate among sites (Ex-                    quences. The second analysis concerns the HVI plus
coffier and Yang 1999; Meyer, Weiss, and von Haeseler                         HVII regions including two Neandertal sequences. The
1999) and a high amount of parallel mutations (Tamura                        HVII region of the Mezmaiskaya specimen has not been
and Nei 1993) that complicate phylogenetic reconstruc-                       recovered.
tions (Maddison, Ruvolo and Swofford 1992; Ingman et                              In the first analysis (HVI region) we included hu-
al. 2000). Moreover, from a phylogenetic point of view,                      man entries containing at least positions 16056 to 16378
the NSG neither selected for the best model of nucleo-                       of the Anderson et al. (1981) reference sequence (fig.
                                                                             1). This segment covers the minimal region common to
     Key words: Neandertal, ancient DNA, D-loop.                             the three Neandertal entries. Human sequences, dupli-
                                                                             cated or ambiguous, were deleted. This selection ren-
     Address for correspondence and reprints: Gabriel Gutierrez, De-
                                                           ´
partamento de Genetica. Universidad de Sevilla, Apartado 1095, 41080
                   ´                                                         dered 1,905 human sequences (328 Africans, 471
Sevilla, Spain. E-mail: ggpozo@us.es.                                        Asians, 211 Australians-Oceanians, 475 Europeans, and
Mol. Biol. Evol. 19(8):1359–1366. 2002                                       420 Americans). Three Pan paniscus and three Pan
  2002 by the Society for Molecular Biology and Evolution. ISSN: 0737-4038   troglodytes sequences were added as outgroup. Also, we

                                                                                                                                    1359
1360      Gutierrez et al.
              ´

Table 1
Reported Neandertal Mitochondrial DNA Sequences and Methods Used for Phylogenetic Analysis
                      Sequence                                                    Tree          Model of nucleotide
Paper Data             Recov-             Sequence           Geographic       Reconstruction     Substitution and
Set Studied             ered Length      Boundariesa          Region             Method           Program Used                Branch Support
Krings et al.      HVI         379      16023–16400        Feldhofer, Ger-    Neighbor-join-   Maximum-likelihood dis-     Likelihood mapping
  1997 . . . . . .                                           many               ing              tances (PHYLIP)             (TREE-PUZZLE)
                                                                                               F84 model
  HVI . . . . . . .                                                                            TS/TV ratio 20 (not esti-
                                                                                                 mated)
                                                                                               No gamma
Krings et al.      HVII        345          57–398         Feldhofer, Ger-    Neighbor-join-   Maximum-likelihood dis-     Likelihood mapping
  1999 . . . . . .                                           many               ing              tances (PHYLIP)             (TREE-PUZZLE)
                                                                                               F84 model
  HVI
   HVII . . . .                                                                                TS/TV ratio estimated
                                                                                                 with TREE-PUZZLE
                                                                                               No gamma
Ovchinnikov        HVI         345      16056–16399        Mezmaiskaya,       Neighbor-join-   Corrected distances     Bootstrap (PAUP*)
  et al.                                                    Northern            ing, Maxi-     Tamura-Nei model with
  2000 . . . . . .                                          Caucasus            mum parsi-       program defaults
                                                                                mony           Gamma with a shape val-
                                                                                                 ue 0.4
  HVI . . . . . . .                                                                            (PAUP*)
Krings et al.       HVI        357      16023–16378        Vindija, Croatia   Neighbor-join-   Maximum-likelihood dis- Likelihood mapping
  2000 . . . . . .                                                              ing              tances (PHYLIP)         (TREE-PUZZLE)
                    HVII       288          57–343                                             F84 model
  HVI
    HVII . . . .                                                                               TS/TV ratio estimated
                                                                                                 with TREE-PUZZLE
                                                                                               No gamma
    a   Taking the sequence shown in Anderson et al. (1981) as a reference.


discarded alignment columns where one sequence                                  correspond to the longest Neandertal sequence (fig. 1).
showed an insertion, whereas the rest did not show any                          In the second analysis we included individuals where
insertion. The final alignment contains 3 Neandertal,                            both HVI and HVII regions were sequenced at least
1,905 human, and 6 chimpanzee sequences. The range                              from positions 16056–16378 and 57–343, respectively
used for analysis covers positions 16023–16400, that                            (fig. 1). These ranges cover the region common to the


      FIG. 1.—Minimum ranges required for human HVI and HVII sequences to be selected. The minimum range covers the common region of
three HVI or two HVII Neandertal sequences. The maximum range covers the longest Neandertal HVI or HVII sequence. The maximum range
settles the alignment length. The numbers correspond to the ranges covered by the MOUSE database according to the Anderson et al. (1981)
reference sequence.
Neandertal mtDNA Phylogeny     1361

Table 2
Parameter Estimation of the Tamura-Nei Model by the Maximum-Likelihood method
                                                                                                               RATE HETEROGENEITY
                                                                                                                  PARAMETERS
                                  BASE COMPOSITION                           RATE MATRIX
                                                                                                           Gamma Shape Proportion of
        DATA SET              A       C        G       T      A↔C A↔G A↔T C↔G               C↔T G↔T         Parametera Invariable Sites
1,914 HVI sequences
   1,905 Humans . . . . . 0.34       0.36    0.11     0.20       1   21.78     1      1      28.73     1       0.70           0.27
   3 Neandertals . . . . .
   3 Pan troglodytes . .
   3 Pan paniscus . . . .
385 HVI    HVII sequences
  377 Humans . . . . . . 0.32        0.35    0.14     0.19       1   16.30     1      1      29.62     1       0.40           0.26
  2 Neandertals . . . . .
  3 Pan troglodytes . .
  3 Pan paniscus . . . .
    a   Four categories were used for discrete gamma distribution.


two Neandertal sequences. Repeated or ambiguous en-                          Results and Discussion
tries were deleted. A total of 377 human entries was                         Selection of Best Model of Nucleotide Substitution,
selected (79 Africans, 59 Asians, 84 Australians-Ocean-                      and Maximum-Likelihood Estimation of the Model
ians, 123 Europeans, and 32 Americans). The final                             Parameters
alignment contains 2 Neandertal, 377 human, and 6
                                                                                  The best model fitting the HVI and HVI          HVII
chimpanzee sequences that cover positions 16023–
                                                                             sets is the Tamura-Nei with a gamma distribution for
16400 and 57–343. We deleted alignment columns
                                                                             rate heterogeneity and a proportion of invariable sites,
where most sequences showed a gap.
                                                                             out of the 56 different models implemented in the MO-
                                                                             DELTEST program. Actually, this model was developed
Model Testing                                                                for the primate D-loop region (Tamura and Nei 1993).
                                                                             The advantage of applying a correction for rate variation
      In order to select the best model of nucleotide sub-
                                                                             among sites in this region has also been reported (Ta-
stitution fitting each sequence set, we have followed the
                                                                             mura and Nei 1993; Wakeley 1993; Excoffier and Yang
procedure described by Posada and Crandall (1998), im-
                                                                             1999; Meyer, Weiss, and von Haeseler 1999). It has been
plemented in the MODELTEST program. This approach
                                                                             shown that correction for rate variation among sites and
first obtains a neighbor-joining tree (Saitou and Nei
                                                                             consideration of invariable sites improve phylogenetic
1987), using the Jukes-Cantor model of nucleotide sub-
                                                                             reconstruction in cases where a long branch attraction
stitution (Jukes and Cantor 1969) and then uses a like-
                                                                             (LBA) artifact exists (Philippe and Laurent 1998). As
lihood ratio test statistic to select the best model and
                                                                             we will show later, chimpanzee sequences can attract the
estimate its parameters, keeping the same tree topology.
                                                                             Neandertal ones.
                                                                                  The parameters estimated in our work (table 2) are
Pairwise Distances                                                           similar to those obtained by other authors (Excoffier and
                                                                             Yang 1999; Meyer, Weiss, and von Haeseler 1999).
     Uncorrected and maximum-likelihood pairwise dis-
                                                                             There is a strong difference between transitions and
tances have been computed using PAUP* 4.0 (Swofford
                                                                             transversions, and a low value for the gamma distribu-
1998). Maximum-likelihood distances were calculated
                                                                             tion shape parameter, which indicates a strong hetero-
using the best model fitting the data.
                                                                             geneity in the substitution rate among sites. The value
                                                                             of the shape parameter estimated here is greater than
Phylogenetic Analysis and Bootstrapping                                      other estimations (Excoffier and Yang 1999; Meyer,
                                                                             Weiss, and von Haeseler 1999) because we have intro-
     Phylogenetic analyses were carried out using
                                                                             duced a parameter for the proportion of invariable sites.
PAUP* 4.0 (Swofford 1998). For each data set the pro-
cedure was: (1) the sequence order was randomized, (2)
                                                                             Phylogenetic Reconstruction and Bootstrap
the maximum-likelihood distances (using the selected
model and the best parameters) were computed, and (3)                             Schematic representations of the bootstrap tree to-
a neighbor-joining tree (Saitou and Nei 1987) was con-                       pologies derived from our HVI and HVI        HVII data
structed for 100 bootstrap replicates (Felsenstein 1985).                    sets are shown in figure 2A and B. The detailed topol-
Interior branch tests (Sitnikova, Rzhetsky, and Nei                          ogies, including 1,914 and 385 sequences, respectively,
1995) were carried out with the program PHYLTEST                             are not shown here, but are available upon request.
2.0 (Kumar 1996) using the most complex model avail-                         Bootstrap values were not significant for most nodes.
able in this program: the Kimura two-parameter model                         Although the three Neandertal sequences clustered to-
(Kimura 1980) with gamma correction.                                         gether, we obtained no support for a branch separating
1362   Gutierrez et al.
           ´


     FIG. 2.—Phylogenetic relationships of Neandertals. Chimpanzee sequences are used as outgroup. (A) The bootstrap majority rule consensus
tree derived from the HVI data set was obtained when considering the best-fit model of nucleotide substitution and best estimation of model
parameters (see table 2). (B) The same as in (A) for the HVI       HVII data set. In (C) we show a representation of the trees and branch support
obtained by, Krings et al. (1997), Krings et al. (1999), Krings et al. (2000), and Ovchinnikov et al. (2000). NSG, Neandertal sequencing groups.


the Neandertal cluster from the human sequences. Our                      strate that Neandertals are outside of modern human D-
HVI tree (fig. 2A) is similar to the NSG one, but branch                   loop variability. In particular, Krings et al. (1997) stated
support is not significant. The HVI         HVII tree (fig.                 that ‘a total of 0.002% of the pairwise comparisons be-
2B) places 10 Africans sequences as outgroup of Nean-                     tween human mtDNA sequences were larger than the
dertals and other humans, but again, the bootstrap value                  smallest difference between the Neandertal and the hu-
is not significant. Therefore, our results suggest that the                mans.’ We think that this point merits further analysis.
Neandertal sequences cannot be considered an outgroup                     The current database is biased because of the overrep-
for modern humans. This result is in contrast to the tree                 resentation of some populations and the underrepresen-
obtained by the NSG, where the Neandertal sequences                       tation of others. For instance, the MOUSE database con-
appear basal to modern humans when using chimpanzee                       tains 6,012 entries for the HVI region, but 31% of the
sequences as outgroup (fig. 2C).                                           entries belong to only 20 populations out of 206 popu-
      Given that neither the bootstrap method (Felsen-                    lations represented (10% of the total of populations).
stein 1985) nor the likelihood mapping method used by                     The extreme cases are 306 Koreans, 126 Yaps, 120 Cay-
Krings et al. (1997, 1999, 2000) have statistical mean-                   apa Amerindians, 119 Mandeka, 115 Palau, and 100
ing, we performed the interior branch test. It has been                   white British. There are also 1,417 entries of undeter-
shown that the confidence value of this test is the com-                   mined population (40% of them are from North America
plement of the P values in the standard statistical test                  and 23% European, but only 9% are from Africa). Thus,
(Sitnikova, Rzhetsky, and Nei 1995). We divided our                       African populations containing the most ancient lineages
data sets into four clusters: (1) chimpanzees, (2) Nean-                  and the highest variation are underrepresented in the
dertals, (3) extant human sequences located at the base                   database.
of the HVI      HVII tree (fig. 2B) that correspond to 10                        Because of the database overrepresentation of some
!Kung entries of the MOUSE database, and (4) the rest                     human populations, the distribution of pairwise distanc-
of humans. We then determined whether the lengths of                      es is biased. A large part of pairwise comparisons are
the interior branches of the three possible trees for the                 made between individuals belonging to the same pop-
four sequence clusters are significantly different from 0.                 ulation. Likewise, it is expected that most individuals
The result of this test is not significant for either the
                                                                          from a single population will show similar distances to
HVI or HVI        HVII regions. Thus, like the bootstrap
                                                                          a given outgroup (Neandertal, in this case). To overcome
analyses, the interior branch test suggests that a poly-
                                                                          this problem, we considered another sample of the hu-
tomy is the best representation for the evolutionary tree
                                                                          man variation. We first sorted the HVI sequences in our
relating Neandertal and extant humans.
                                                                          data set according to its uncorrected distance to the ref-
                                                                          erence sequence (Anderson et al. 1981). Then we
Pairwise Distances
                                                                          grouped them into 171 classes, containing equidistant
    The NSG reported that the pairwise comparisons                        sequences (considering four decimals), and chose one
between the Neandertal and human sequences demon-                         sequence at random from each class. The computation
Neandertal mtDNA Phylogeny      1363


     FIG. 3.—The three possible quartets between the HVI sequence from the Feldhofer Neandertal, a chimpanzee, and two humans. The human
A is one of the most divergent sequences with respect to the reference sequence (Anderson et al. 1981), and the human B is one of the less
divergent. Quartets were evaluated with the program TREE-PUZZLE under the F84 model (the transition-transversion ratio was 20). Their
respective log-likelihoods are shown below them.


of pairwise distances between the 171 randomly selected               best nucleotide substitution model for a given data set
sequences and the Neandertals rendered 1.6% of human-                 (Huelsenbeck and Hillis 1993; Sullivan and Swofford
human comparisons larger than the smallest difference                 1997; Cunningham, Zhu, and Hillis 1998). The same
between Neandertals and humans. Likewise, 27% of the                  considerations apply to the choice of the branch support
comparisons are lower than the largest human-human                    method. The bootstrap method has some caveats (Cum-
difference. This result suggests that Neandertals se-                 mings, Otto, and Wakeley 1995), and the quartet puz-
quences are not so different from those of extant hu-                 zling (likelihood mapping) has also been criticized for
mans, in contrast to the NSG claims.                                  overestimating branch support values (Cao, Adachi, and
                                                                      Hasegawa 1998).
Final Considerations                                                       Secondly, we believe that the likelihood mapping
                                                                      values supporting Neandertals as a different species
      A main conclusion can be extracted from our anal-
                                                                      might be artifactually increased. To illustrate this point,
yses: the phylogenetic position of the ancient DNA se-
quences recovered from Neandertal bones is sensitive to               we took two human HVI sequences showing maximal
the phylogenetic methods employed. It depends on the                  divergence between them, a chimpanzee, and the Feld-
model of nucleotide substitution, the branch support                  hofer Neandertal. The three possible quartets were eval-
method, and the set of data used. Adcock et al. (2001)                uated with the program TREE-PUZZLE (Strimmer and
recovered HVI sequences of archaic human bones from                   von Haeseler 1996) with the same model and parameter
Australia, and their phylogenetic analysis showed that                used by Krings et al. (1997). It can be seen (fig. 3) that
two of the specimens were outgroups even for the most                 the chimpanzee branch is very long, and that the Ne-
ancient African lineages. They concluded that this is an              andertal branch is longer than the two humans, opening
evidence supporting the multiregional hypothesis. How-                the possibility of a LBA artifact. It has been reported
ever, a second analysis carried out by Cooper et al.                  that quartet methods are very prone to LBA (Huelsen-
(2001) that took into account the heterogeneity of rates              beck 1998). Thus, the best-scored topology is usually
between sites and a large sample of modern humans,                    the one joining long branches in exhaustive quartet eval-
showed that both HVI sequences are located among ex-                  uations. Another issue relates to the significance of the
tant humans. This case illustrates the influence of the                log-likelihood values. In the trees drawn in figure 3, the
nucleotide substitution model on the phylogenetic re-                 best score is for the tree that joins Neandertal and chim-
construction of the human D-loop region.                              panzee sequences. However, the log-likelihoods are very
      The NSG studies used poor parameter models of                   similar between the alternative topologies. The Kishino-
nucleotide substitution for their analyses, whereas we                Hasegawa test (Kishino and Hasegawa 1989) yielded no
opted for complex (parameter rich) models following the               significant differences between them at the 5% level.
likelihood ratio test. Both alternatives have pros and                This example illustrates that likelihood mapping can se-
cons. Yang (1997) and Posada and Crandall (2001) en-                  lect as the best topology one that is not significantly
courage the use of the best-fit model, although they re-               better than the other two. A third argument against the
ported some examples where simple models can recover                  use of likelihood mapping in this study has to do with
the true phylogenetic tree better than complex models.                the database population bias mentioned earlier. It is not
Several authors highlight the importance of using the                 advisable to perform likelihood mapping with a database
1364      Gutierrez et al.
              ´


     FIG. 4.—Comparison between ancient DNA sequences of two Neandertal specimens and extant humans. Neandertal specimen A (the most
ancient) would be expected to show a mean distance to humans shorter than the most recent one (Neandertal B) if DNA had suffered no damage.


where most human sequences are very similar among                               quences to determine the phylogenetic position of Nean-
themselves.                                                                     dertals because no tree topology is favored. In part, this
     Ovchinnikov et al. (2000) also obtained a high                             is caused by short sequences with a high proportion of
bootstrap value (95%) for the Neandertal clade, segre-                          invariable sites. Ingman et al. (2000) noted that the D-
gating them from modern humans. When we used the                                loop region, in spite of its wide use for human phylo-
same phylogenetic procedures, i.e., corrected Tamura-                           genetic analysis, is not an appropriate region of the mi-
Nei distances with a gamma distribution of 0.4, we ob-                          tochondrial genome for answering phylogenetic
tained a lower bootstrap value (62%). An explanation                            questions.
for this discrepancy could be that Ovchinikov et al. did                              Another interesting issue is the possibility that the
not select human sequences by length and did not elim-                          Neandertal sequences were artifactual. Caldararo and
inate sequences with ambiguities. Missing data are a                            Gabow (2000) noticed that some of the nucleotide sub-
common nuisance factor in phylogenetic analysis                                 stitutions found in the Feldhofer Neandertal sequence
(Wiens 1998). Although we obtained a lower bootstrap                            matched those found in other human ancient HVI se-
value, we think that 62% is still a high bootstrap value                        quences. They attributed these similarities to diagenetic
compared with the ones obtained when maximum-like-                              changes that occurred in fossil DNA. Hansen et al.
lihood distances are used (fig. 2A and B). It has been                           (2001) studied different clones of ancient DNA ampli-
shown that maximum-likelihood distances have some                               fications and concluded that PCR can introduce errors
advantages over corrected distances, reducing sampling                          caused by the miscoding lesions of ancient DNA. In the
variances of the transition-transversion ratio estimations                      absence of diagenetic changes, the mean distance be-
(Swofford et al. 1996). Meyer, Weiss, and von Haeseler                          tween an ancient sequence and an extant one ought to
(1999) estimated a transition-transversion ratio of 15.55                       be larger than the distance between a more ancient se-
for the HVI region. This points to an underestimation                           quence and the extant one. So, the more ancient a se-
by Ovchinnikov et al. (2000) of the number of substi-                           quence, the shorter its distance to the extant sequences
tutions along the tree branches.                                                (fig. 4). We tested this prediction by computing the av-
     The low bootstrap values obtained in our work in-                          erage distances between each Neandertal HVI sequence
dicate the lack of resolution of the HVI and HVII se-                           and our data set of extant HVI human sequences (table
                                                                                3). It can be seen that the most recent specimen (Mez-
Table 3                                                                         maiskaya) shows a shorter distance than the oldest one
Mean Distances Between Neandertal and 1905 Modern                               (Feldhofer). This result can be explained by a different
Human HVI Sequences                                                             nucleotide substitution rate among Neandertal lineages
                                                                                (populations) or by miscoding DNA lesions in Nean-
                                                             Maximum-
     Neandertal                                              Likelihood         dertal fossils. Had DNA damage increased the differ-
     Sequence                    Datea        p Distance     Distanceb          ences between Neandertal and modern humans, Nean-
Feldhofer . . . . . . . .    40,000–100,000      0.0801        0.1050
                                                                                dertals would be more akin to modern humans than what
Mezmaiskaya . . . .              29,195          0.0689        0.0898           recent claims suggest.
Vindija. . . . . . . . . .       42,000          0.0677        0.0869
                                                                                Acknowledgments
     a Years before present.
     b Under the best model, Tamura-Nei with gamma for rate heterogeneity and        We thank G. Gutierrez-Prieto and two anonymous
                                                                                                       ´
the model parameters shown in table 2.                                          referees for helpful comments on the manuscript. This
Neandertal mtDNA Phylogeny    1365


work was supported in part by the DGICYT BIO-1999-                    of mitochondrial, autosomal, and Y-chromosome data. Am.
065-C02-02 of the Spanish Government.                                 J. Hum. Genet. 66:979–988.
                                                                   JUKES, T. H., and C. R. CANTOR. 1969. Evolution of protein
                                                                      molecules. Pp. 21–132 in H. N. MUNRO, ed. Mammalian
LITERATURE CITED                                                      protein metabolism. Academic Press, New York.
                                                                   KIMURA, M. 1980. A simple method for estimating evolution-
ADCOCK, G. J., E. S. DENNIS, S. EASTEAL, G. A. HUTTLEY, L.
                                                                      ary rates of base substitutions through comparative studies
   S. JERMIIN, W. J. PEACOCK, and A. THORNE. 2001. Mito-
                                                                      of nucleotide sequences. J. Mol. Evol. 16:111–120.
   chondrial DNA sequences in ancient Australians: implica-
                                                                   KISHINO, H., and M. HASEGAWA. 1989. Evaluation of the max-
   tions for modern human origins. Proc. Natl. Acad. Sci. USA
   98:537–542.                                                        imum likelihood estimation of the evolutionary tree topol-
ANDERSON, S., A. T. BANKIER, B. G. BARRELL et al. (14 co-             ogies from DNA sequence data, and the branching order in
   authors). 1981. Sequence and organization of the human             Hominoidea. J. Mol. Evol. 29:170–179.
   mitochondrial genome. Nature 290:457–465.                       KRINGS, M., C. CAPELLI, F. TSCHENTSCHER, H. GEISERT, S.
BROCCHIERI, L. 2001. Phylogenetic inferences from molecular           MEYER, A. VON HAESELER, K. GROSSSCHMIDT, G. POS-
                                                                                                       ¨ ¨
                                                                      SNERT, M. PAUNOVIC, and S. PAABO. 2000. A view of Ne-
   sequences: review and critique. Theor. Popul. Biol. 59:27–
   40.                                                                andertal genetic diversity. Nat. Genet. 26:144–145.
BURCHARDT, F., A. VON HAESELER, and S. MEYER. 1999.                KRINGS, M., H. GEISERT, R. W. SCHMITZ, H. KRAINITZKI, and
                                                                           ¨ ¨
                                                                      S. PAABO. 1999. DNA sequence of the mitochondrial hy-
   HvrBase: compilation of mtDNA control region sequences
   from primates. Nucleic Acids Res. 27:138–142.                      pervariable region II from the Neandertal type specimen.
CALDARARO, N., and S. GABOW. 2000. Mitohondrial DNA                   Proc. Natl. Acad. Sci. USA 96:5581–5585.
   analysis and the place of Neandertals in Homo. Ancient          KRINGS, M., A. STONE, R. W. SCHMITZ, H. KRAINITZKI, M.
   Biomol. 3:135–158.                                                                       ¨ ¨
                                                                      STONEKING, and S. PAABO. 1997. Neandertal DNA sequenc-
CANN, R. L., M. STONEKING, and A. C. WILSON. 1987. Mito-              es and the origin of modern humans. Cell 90:19–30.
   chondrial DNA and human evolution. Nature 325:31–36.            KUMAR, S. 1996. PHYLTEST: phylogenetic hypothesis testing
CAO, Y., J. ADACHI, and M. HASEGAWA. 1998. Comment on                 software. Version 2.0. Pennsylvania State University, Uni-
   the quartet method for finding maximum-likelihood tree to-          versity Park, Pa.
   pologies. Mol. Biol. Evol. 15:87–89.                            MADDISON, D. R., M. RUVOLO, and D. L. SWOFFORD. 1992.
COOPER, A., A. RAMBAUT, V. MACAULAY, E. WILLERSLEV, A.                Geographic origins of human mitochondrial DNA: phylo-
   J. HANSEN, and C. STRINGER. 2001. Human origins and an-            genetic evidence from control region sequences. Syst. Biol.
   cient human DNA. Science 292:1655–1656.                            41:111–124.
CUMMINGS, M. P., S. P. OTTO, and J. WAKELEY. 1995. Sam-            MEYER, S., G. WEISS, and A. VON HAESELER. 1999. Pattern of
   pling properties of DNA sequence data in phylogenetic              nucleotide substitution and rate heterogeneity in the hyper-
   analysis. Mol. Biol. Evol. 12:814–822.                             variable regions I and II of human mtDNA. Genetics 152:
CUNNINGHAM, C. W., H. ZHU, and D. M. HILLIS. 1998. Best-              1103–1110.
   fit maximum-likelihood models for phylogenetic inference:        NORDBORG, M. 1998. On the probability of Neanderthal an-
   empirical tests with known phylogenies. Evolution 52:978–          cestry. Am. J. Hum. Genet. 63:1237–1240.
   987.                                                                                         ¨         ¨
                                                                   OVCHINNIKOV, I. V., A. GOTHERSTROM, G. O. ROMANOVA, V.
EXCOFFIER, L., and Z. YANG. 1999. Substitution rate variation                                     ´
                                                                      M. KHARITONOV, K. LIDEN, and W. GOODWIN. 2000. Mo-
   among sites in mitochondrial hypervarible region I of hu-          lecular analysis of Neanderhal DNA from the northern Cau-
   mans and chimpanzees. Mol. Biol. Evol. 16:1357–1368.               casus. Nature 404:490–493.
FELSENSTEIN, J. 1985. Confidence limits on phylogenies: an          PHILIPPE, H., and J. LAURENT. 1998. How good are deep phy-
   approach using the bootstrap. Evolution 39:783–791.                logenetic trees? Curr. Opin. Genet. Dev. 8:616–623.
FOLEY, R. 1998. The context of human genetic evolution. Ge-        POSADA, D., and K. A. CRANDALL. 1998. MODELTEST: test-
   nome Res. 8:339–347.                                               ing the model of DNA substitution. Bioinformatics 14:817–
HANSEN, A. J., E. WILLERSLEV, C. WIUF, T. MOURIER, and P.             818.
   ARCTANDER. 2001. Statistical evidence for miscoding le-         ———. 2001. Simple (wrong) models for complex trees: a
   sions in ancient DNA templates. Mol. Biol. Evol. 18:262–
                                                                      case from retroviridae. Mol. Biol. Evol. 18:271–275.
   265.
                                                                   RELETHFORD, J. H. 2001. Absence of regional affinities of Ne-
HAWKS, J., and M. WOLPOFF. 2001. Paleoanthropology and the
                                                                      andertal DNA with living humans does not reject multire-
   population genetics of ancient genes. Am. J. Phys. Anthro-
   pol. 114:269–272.                                                  gional evolution. Am. J. Phys. Anthropol. 115:95–98.
HUELSENBECK, J. P. 1998. Systematic bias in phylogenetic           SAITOU, N., and M. NEI. 1987. The neighbor-joining method:
   analysis: is the Strepsiptera problem solved? Syst. Biol. 47:      a new method for reconstructing phylogenetic trees. Mol.
   519–537.                                                           Biol. Evol. 4:406–425.
HUELSENBECK, J. P., and D. M. HILLIS. 1993. Success of phy-        SITNIKOVA, T., A. RZHETSKY, and M. NEI. 1995. Interior-
   logenetic methods in the four-taxon case. Syst. Biol. 42:          branch and bootstrap tests of phylogenetic trees. Mol. Evol.
   247–264.                                                           Biol. 12:319–333.
HUELSENBECK, J. P., and B. RANNALA. 1997. Phylogenetic             STRIMMER, K., and A. VON HAESELER. 1996. Quartet puzzling:
   methods come of age: testing hypothesis in an evolutionary         a quartet maximum likelihood method for reconstructing
   context. Science 276:227–232.                                      tree topologies. Mol. Biol. Evol. 13:964–969.
                                     ¨ ¨
INGMAN, M., H. KAESSMANN, S. PAABO, and U. GYLLENSTEN.             STRINGER, C. B., and P. ANDREWS. 1988. Genetic and fossil
   2000. Mitochondrial genome variation and the origin of             evidence for the origin of modern humans. Science 239:
   modern humans. Nature 408:708–713.                                 1263–1268.
JORDE, L. B., W. S. WATKINS, M. J. BAMSHAD, M. E. DIXON,           SULLIVAN, J., and D. L. SWOFFORD. 1997. Are guinea pigs
   C. E. RICKER, M. T. SEIELTAD, and M. A. BATZER. 2000.              rodents? The importance of adequate models in molecular
   The distribution of human genetic diversity: a comparison          phylogenetics. J. Mamm. Evol. 4:77–86.
1366   Gutierrez et al.
           ´

SWOFFORD, D. L. 1998. PAUP*: phylogenetic analysis using        WIENS, J. J. 1998. Combining data sets with different phylo-
  parsimony (*and other methods). Version 4. Sinauer Asso-        genetic histories. Syst. Biol. 47:568–581.
  ciates, Sunderland, Mass.                                     WOLPOFF, M. H., J. HAWKS, D. W. FRAYER, and K. HUNLEY.
SWOFFORD, D. L., G. J. OLSEN, P. J. WADDELL, and D. M.            2001. Modern human ancestry at the peripheries: a test of
  HILLIS. 1996. Phylogenetic inference. Pp. 407–514 in D. M.      the replacement theory. Science 291:293–297.
  HILLIS, C. MORITZ, and B. K. MABLE, eds. Molecular sys-       YANG, Z. 1997. How often do wrong models produce better
                                                                  phylogenies? Mol. Biol. Evol. 14:105–108.
  tematics. Sinauer, Sunderland, Mass.
                                                                YANG, Z., N. GOLDMAN, and A. FRIDAY. 1994. Comparison of
TAMURA, K., and M. NEI. 1993. Estimation of the number of         models for nucleotide substitution used in maximum-like-
  nucleotide substitutions in the control region of mitochon-     lihood phylogenetic estimation. 1994. Mol. Biol. Evol. 11:
  drial DNA in humans and chimpanzees. Mol. Biol. Evol.           316–324.
  10:512–526.
WAKELEY, J. 1993. Substitution rate variation among sites in    MANOLO GOUY, reviewing editor
  hypervariable region 1 of human mitochondrial DNA. J.
  Mol. Evol. 37:613–623.                                        Accepted April 15, 2002

Contenu connexe

En vedette

PDF in print
PDF in printPDF in print
PDF in print
Ch Rao
 
Online Article
Online ArticleOnline Article
Online Article
Ch Rao
 
A cranium for the earliest europeans: phylogenetic position of the hominid fr...
A cranium for the earliest europeans: phylogenetic position of the hominid fr...A cranium for the earliest europeans: phylogenetic position of the hominid fr...
A cranium for the earliest europeans: phylogenetic position of the hominid fr...
Kristian Pedersen
 
ACA Reinsurance & High Risk Pool March 2014
ACA Reinsurance & High Risk Pool March 2014ACA Reinsurance & High Risk Pool March 2014
ACA Reinsurance & High Risk Pool March 2014
Richard Popper
 

En vedette (20)

Smw mumbai 2015 post event report
Smw mumbai 2015 post event report Smw mumbai 2015 post event report
Smw mumbai 2015 post event report
 
Lima surco distrito emblematico y verde
Lima surco distrito emblematico y verdeLima surco distrito emblematico y verde
Lima surco distrito emblematico y verde
 
Ieee Projects For Ece Eee Trichy
Ieee Projects For Ece Eee TrichyIeee Projects For Ece Eee Trichy
Ieee Projects For Ece Eee Trichy
 
project training center Trichy
project training center Trichyproject training center Trichy
project training center Trichy
 
David escudero sonido_taller
David escudero sonido_tallerDavid escudero sonido_taller
David escudero sonido_taller
 
PDF in print
PDF in printPDF in print
PDF in print
 
Resume2016
Resume2016Resume2016
Resume2016
 
Online Article
Online ArticleOnline Article
Online Article
 
Ieee Projects For Ece Eee Namakkal
Ieee Projects For Ece Eee NamakkalIeee Projects For Ece Eee Namakkal
Ieee Projects For Ece Eee Namakkal
 
A cranium for the earliest europeans: phylogenetic position of the hominid fr...
A cranium for the earliest europeans: phylogenetic position of the hominid fr...A cranium for the earliest europeans: phylogenetic position of the hominid fr...
A cranium for the earliest europeans: phylogenetic position of the hominid fr...
 
final year project titles for computer science thanjavur
final year project titles for computer science thanjavurfinal year project titles for computer science thanjavur
final year project titles for computer science thanjavur
 
NOVARTIS
NOVARTIS NOVARTIS
NOVARTIS
 
Exposicion residuos solidos en el peru
Exposicion residuos solidos en el peruExposicion residuos solidos en el peru
Exposicion residuos solidos en el peru
 
Kevin silva 10 8
Kevin silva 10 8Kevin silva 10 8
Kevin silva 10 8
 
Palabras sobre emprendimiento
Palabras sobre emprendimientoPalabras sobre emprendimiento
Palabras sobre emprendimiento
 
The Power of the Factories
The Power of the FactoriesThe Power of the Factories
The Power of the Factories
 
Arbitration In India
Arbitration In IndiaArbitration In India
Arbitration In India
 
ACA Reinsurance & High Risk Pool March 2014
ACA Reinsurance & High Risk Pool March 2014ACA Reinsurance & High Risk Pool March 2014
ACA Reinsurance & High Risk Pool March 2014
 
Hoja de control genérica para evaluar fiabilidad de las fuentes
Hoja de control genérica para evaluar fiabilidad de las fuentesHoja de control genérica para evaluar fiabilidad de las fuentes
Hoja de control genérica para evaluar fiabilidad de las fuentes
 
02-Manual de Electrotécnia
02-Manual de Electrotécnia02-Manual de Electrotécnia
02-Manual de Electrotécnia
 

Similaire à A reanalysis of the ancient mitochondrial dna sequences (guitiã©rrez et al.)

Gutell 076.curr.genetics.2001.40.0082
Gutell 076.curr.genetics.2001.40.0082Gutell 076.curr.genetics.2001.40.0082
Gutell 076.curr.genetics.2001.40.0082
Robin Gutell
 
Detecting ancient admixture in humans using sequence polymorphism data (wall)
Detecting ancient admixture in humans using sequence polymorphism data (wall)Detecting ancient admixture in humans using sequence polymorphism data (wall)
Detecting ancient admixture in humans using sequence polymorphism data (wall)
Kristian Pedersen
 
Whats Beyond The Finished Human Genome Sequence
Whats Beyond The Finished Human Genome SequenceWhats Beyond The Finished Human Genome Sequence
Whats Beyond The Finished Human Genome Sequence
John Morgan
 
Presentation - Final Draft
Presentation - Final DraftPresentation - Final Draft
Presentation - Final Draft
Seth D. Nelson
 
Sequencing y chromosomes resolves discrepancy in time to common ancestor of m...
Sequencing y chromosomes resolves discrepancy in time to common ancestor of m...Sequencing y chromosomes resolves discrepancy in time to common ancestor of m...
Sequencing y chromosomes resolves discrepancy in time to common ancestor of m...
Carlos Bella
 
What_have_the_revelations_about_Neanderthal_DNA_re.pdf
What_have_the_revelations_about_Neanderthal_DNA_re.pdfWhat_have_the_revelations_about_Neanderthal_DNA_re.pdf
What_have_the_revelations_about_Neanderthal_DNA_re.pdf
BraydenStoch2
 
1999 microfluidic devices for dna analysis
1999  microfluidic devices for dna analysis1999  microfluidic devices for dna analysis
1999 microfluidic devices for dna analysis
고려대학
 
Validating and improving the D. melanogaster reference genome sequence using ...
Validating and improving the D. melanogaster reference genome sequence using ...Validating and improving the D. melanogaster reference genome sequence using ...
Validating and improving the D. melanogaster reference genome sequence using ...
Casey Bergman
 
Density and distribution of chimpanzee (Pan troglodytes verus, Schwarz 1934) ...
Density and distribution of chimpanzee (Pan troglodytes verus, Schwarz 1934) ...Density and distribution of chimpanzee (Pan troglodytes verus, Schwarz 1934) ...
Density and distribution of chimpanzee (Pan troglodytes verus, Schwarz 1934) ...
Open Access Research Paper
 

Similaire à A reanalysis of the ancient mitochondrial dna sequences (guitiã©rrez et al.) (20)

Rym kefi (1)
Rym kefi (1)Rym kefi (1)
Rym kefi (1)
 
Randomized Algorithms in Linear Algebra & the Column Subset Selection Problem
Randomized Algorithms in Linear Algebra & the Column Subset Selection ProblemRandomized Algorithms in Linear Algebra & the Column Subset Selection Problem
Randomized Algorithms in Linear Algebra & the Column Subset Selection Problem
 
A SNP array for human population genetics studies
A SNP array for human population genetics studiesA SNP array for human population genetics studies
A SNP array for human population genetics studies
 
Gutell 076.curr.genetics.2001.40.0082
Gutell 076.curr.genetics.2001.40.0082Gutell 076.curr.genetics.2001.40.0082
Gutell 076.curr.genetics.2001.40.0082
 
Detecting ancient admixture in humans using sequence polymorphism data (wall)
Detecting ancient admixture in humans using sequence polymorphism data (wall)Detecting ancient admixture in humans using sequence polymorphism data (wall)
Detecting ancient admixture in humans using sequence polymorphism data (wall)
 
Whats Beyond The Finished Human Genome Sequence
Whats Beyond The Finished Human Genome SequenceWhats Beyond The Finished Human Genome Sequence
Whats Beyond The Finished Human Genome Sequence
 
Jcb 2005-12-1103
Jcb 2005-12-1103Jcb 2005-12-1103
Jcb 2005-12-1103
 
9_1_Human_Genome_Project.pptx
9_1_Human_Genome_Project.pptx9_1_Human_Genome_Project.pptx
9_1_Human_Genome_Project.pptx
 
Presentation - Final Draft
Presentation - Final DraftPresentation - Final Draft
Presentation - Final Draft
 
Rnaseq forgenefinding
Rnaseq forgenefindingRnaseq forgenefinding
Rnaseq forgenefinding
 
SIR WASIQ dna sequence ppt.pptx
SIR WASIQ dna sequence ppt.pptxSIR WASIQ dna sequence ppt.pptx
SIR WASIQ dna sequence ppt.pptx
 
Sequencing y chromosomes resolves discrepancy in time to common ancestor of m...
Sequencing y chromosomes resolves discrepancy in time to common ancestor of m...Sequencing y chromosomes resolves discrepancy in time to common ancestor of m...
Sequencing y chromosomes resolves discrepancy in time to common ancestor of m...
 
Genome Exploration in A-T G-C space (mk1)
Genome Exploration in A-T G-C space (mk1)Genome Exploration in A-T G-C space (mk1)
Genome Exploration in A-T G-C space (mk1)
 
What_have_the_revelations_about_Neanderthal_DNA_re.pdf
What_have_the_revelations_about_Neanderthal_DNA_re.pdfWhat_have_the_revelations_about_Neanderthal_DNA_re.pdf
What_have_the_revelations_about_Neanderthal_DNA_re.pdf
 
Journal.pone.0010419
Journal.pone.0010419Journal.pone.0010419
Journal.pone.0010419
 
1999 microfluidic devices for dna analysis
1999  microfluidic devices for dna analysis1999  microfluidic devices for dna analysis
1999 microfluidic devices for dna analysis
 
Hgp
HgpHgp
Hgp
 
Validating and improving the D. melanogaster reference genome sequence using ...
Validating and improving the D. melanogaster reference genome sequence using ...Validating and improving the D. melanogaster reference genome sequence using ...
Validating and improving the D. melanogaster reference genome sequence using ...
 
Density and distribution of chimpanzee (Pan troglodytes verus, Schwarz 1934) ...
Density and distribution of chimpanzee (Pan troglodytes verus, Schwarz 1934) ...Density and distribution of chimpanzee (Pan troglodytes verus, Schwarz 1934) ...
Density and distribution of chimpanzee (Pan troglodytes verus, Schwarz 1934) ...
 
Seminar2015
Seminar2015Seminar2015
Seminar2015
 

Plus de Kristian Pedersen

The vikings, lecture 1 (2011)
The vikings, lecture 1 (2011)The vikings, lecture 1 (2011)
The vikings, lecture 1 (2011)
Kristian Pedersen
 
Close correspondence between quantitative and molecular-genetic divergence t...
Close correspondence between quantitative  and molecular-genetic divergence t...Close correspondence between quantitative  and molecular-genetic divergence t...
Close correspondence between quantitative and molecular-genetic divergence t...
Kristian Pedersen
 
Anterior tooth growth periods in neandertals were comparable to those of mode...
Anterior tooth growth periods in neandertals were comparable to those of mode...Anterior tooth growth periods in neandertals were comparable to those of mode...
Anterior tooth growth periods in neandertals were comparable to those of mode...
Kristian Pedersen
 
Ancient dna. would the real neandertal please stand up (cooper et al.)
Ancient dna. would the real neandertal please stand up (cooper et al.)Ancient dna. would the real neandertal please stand up (cooper et al.)
Ancient dna. would the real neandertal please stand up (cooper et al.)
Kristian Pedersen
 
A re appraisal of ceprano calvaria affinities (ascenzi et al.)
A re appraisal of ceprano calvaria affinities (ascenzi et al.)A re appraisal of ceprano calvaria affinities (ascenzi et al.)
A re appraisal of ceprano calvaria affinities (ascenzi et al.)
Kristian Pedersen
 
A modern human pattern of dental development in lower pleistocene hominids fr...
A modern human pattern of dental development in lower pleistocene hominids fr...A modern human pattern of dental development in lower pleistocene hominids fr...
A modern human pattern of dental development in lower pleistocene hominids fr...
Kristian Pedersen
 
A calvarium of late homo erectus from ceprano, italy (ascenzi et al.)
A calvarium of late homo erectus from ceprano, italy (ascenzi et al.)A calvarium of late homo erectus from ceprano, italy (ascenzi et al.)
A calvarium of late homo erectus from ceprano, italy (ascenzi et al.)
Kristian Pedersen
 
The feeding biomechanics and dietary ecology of australopithecus africanus (s...
The feeding biomechanics and dietary ecology of australopithecus africanus (s...The feeding biomechanics and dietary ecology of australopithecus africanus (s...
The feeding biomechanics and dietary ecology of australopithecus africanus (s...
Kristian Pedersen
 
The carbon isotope ecology and diet of australopithecus africanus at sterkfon...
The carbon isotope ecology and diet of australopithecus africanus at sterkfon...The carbon isotope ecology and diet of australopithecus africanus at sterkfon...
The carbon isotope ecology and diet of australopithecus africanus at sterkfon...
Kristian Pedersen
 
Ontogeny of australopithecines and early homo: evidence from carnial capacity...
Ontogeny of australopithecines and early homo: evidence from carnial capacity...Ontogeny of australopithecines and early homo: evidence from carnial capacity...
Ontogeny of australopithecines and early homo: evidence from carnial capacity...
Kristian Pedersen
 
Cosmogenic Nuclide Dating Of Sahelanthropus Tchadensis And Australopiethcus B...
Cosmogenic Nuclide Dating Of Sahelanthropus Tchadensis And Australopiethcus B...Cosmogenic Nuclide Dating Of Sahelanthropus Tchadensis And Australopiethcus B...
Cosmogenic Nuclide Dating Of Sahelanthropus Tchadensis And Australopiethcus B...
Kristian Pedersen
 

Plus de Kristian Pedersen (20)

Vikings, lecture 4
Vikings, lecture 4Vikings, lecture 4
Vikings, lecture 4
 
Vikings, lecture 3
Vikings, lecture 3Vikings, lecture 3
Vikings, lecture 3
 
Vikings, lecture 2
Vikings, lecture 2Vikings, lecture 2
Vikings, lecture 2
 
The vikings, lecture 1 (2011)
The vikings, lecture 1 (2011)The vikings, lecture 1 (2011)
The vikings, lecture 1 (2011)
 
Close correspondence between quantitative and molecular-genetic divergence t...
Close correspondence between quantitative  and molecular-genetic divergence t...Close correspondence between quantitative  and molecular-genetic divergence t...
Close correspondence between quantitative and molecular-genetic divergence t...
 
Anterior tooth growth periods in neandertals were comparable to those of mode...
Anterior tooth growth periods in neandertals were comparable to those of mode...Anterior tooth growth periods in neandertals were comparable to those of mode...
Anterior tooth growth periods in neandertals were comparable to those of mode...
 
Ancient dna. would the real neandertal please stand up (cooper et al.)
Ancient dna. would the real neandertal please stand up (cooper et al.)Ancient dna. would the real neandertal please stand up (cooper et al.)
Ancient dna. would the real neandertal please stand up (cooper et al.)
 
A re appraisal of ceprano calvaria affinities (ascenzi et al.)
A re appraisal of ceprano calvaria affinities (ascenzi et al.)A re appraisal of ceprano calvaria affinities (ascenzi et al.)
A re appraisal of ceprano calvaria affinities (ascenzi et al.)
 
A modern human pattern of dental development in lower pleistocene hominids fr...
A modern human pattern of dental development in lower pleistocene hominids fr...A modern human pattern of dental development in lower pleistocene hominids fr...
A modern human pattern of dental development in lower pleistocene hominids fr...
 
A calvarium of late homo erectus from ceprano, italy (ascenzi et al.)
A calvarium of late homo erectus from ceprano, italy (ascenzi et al.)A calvarium of late homo erectus from ceprano, italy (ascenzi et al.)
A calvarium of late homo erectus from ceprano, italy (ascenzi et al.)
 
The feeding biomechanics and dietary ecology of australopithecus africanus (s...
The feeding biomechanics and dietary ecology of australopithecus africanus (s...The feeding biomechanics and dietary ecology of australopithecus africanus (s...
The feeding biomechanics and dietary ecology of australopithecus africanus (s...
 
The carbon isotope ecology and diet of australopithecus africanus at sterkfon...
The carbon isotope ecology and diet of australopithecus africanus at sterkfon...The carbon isotope ecology and diet of australopithecus africanus at sterkfon...
The carbon isotope ecology and diet of australopithecus africanus at sterkfon...
 
Ontogeny of australopithecines and early homo: evidence from carnial capacity...
Ontogeny of australopithecines and early homo: evidence from carnial capacity...Ontogeny of australopithecines and early homo: evidence from carnial capacity...
Ontogeny of australopithecines and early homo: evidence from carnial capacity...
 
Cosmogenic Nuclide Dating Of Sahelanthropus Tchadensis And Australopiethcus B...
Cosmogenic Nuclide Dating Of Sahelanthropus Tchadensis And Australopiethcus B...Cosmogenic Nuclide Dating Of Sahelanthropus Tchadensis And Australopiethcus B...
Cosmogenic Nuclide Dating Of Sahelanthropus Tchadensis And Australopiethcus B...
 
Neanderthals, Lecture 9
Neanderthals, Lecture 9Neanderthals, Lecture 9
Neanderthals, Lecture 9
 
Lecture6 7
Lecture6 7Lecture6 7
Lecture6 7
 
Lecture5
Lecture5Lecture5
Lecture5
 
Lecture4
Lecture4Lecture4
Lecture4
 
Lecture3
Lecture3Lecture3
Lecture3
 
Lecture2
Lecture2Lecture2
Lecture2
 

Dernier

Artificial Intelligence: Facts and Myths
Artificial Intelligence: Facts and MythsArtificial Intelligence: Facts and Myths
Artificial Intelligence: Facts and Myths
Joaquim Jorge
 
CNv6 Instructor Chapter 6 Quality of Service
CNv6 Instructor Chapter 6 Quality of ServiceCNv6 Instructor Chapter 6 Quality of Service
CNv6 Instructor Chapter 6 Quality of Service
giselly40
 

Dernier (20)

Raspberry Pi 5: Challenges and Solutions in Bringing up an OpenGL/Vulkan Driv...
Raspberry Pi 5: Challenges and Solutions in Bringing up an OpenGL/Vulkan Driv...Raspberry Pi 5: Challenges and Solutions in Bringing up an OpenGL/Vulkan Driv...
Raspberry Pi 5: Challenges and Solutions in Bringing up an OpenGL/Vulkan Driv...
 
The Role of Taxonomy and Ontology in Semantic Layers - Heather Hedden.pdf
The Role of Taxonomy and Ontology in Semantic Layers - Heather Hedden.pdfThe Role of Taxonomy and Ontology in Semantic Layers - Heather Hedden.pdf
The Role of Taxonomy and Ontology in Semantic Layers - Heather Hedden.pdf
 
Understanding Discord NSFW Servers A Guide for Responsible Users.pdf
Understanding Discord NSFW Servers A Guide for Responsible Users.pdfUnderstanding Discord NSFW Servers A Guide for Responsible Users.pdf
Understanding Discord NSFW Servers A Guide for Responsible Users.pdf
 
Data Cloud, More than a CDP by Matt Robison
Data Cloud, More than a CDP by Matt RobisonData Cloud, More than a CDP by Matt Robison
Data Cloud, More than a CDP by Matt Robison
 
How to Troubleshoot Apps for the Modern Connected Worker
How to Troubleshoot Apps for the Modern Connected WorkerHow to Troubleshoot Apps for the Modern Connected Worker
How to Troubleshoot Apps for the Modern Connected Worker
 
08448380779 Call Girls In Friends Colony Women Seeking Men
08448380779 Call Girls In Friends Colony Women Seeking Men08448380779 Call Girls In Friends Colony Women Seeking Men
08448380779 Call Girls In Friends Colony Women Seeking Men
 
Axa Assurance Maroc - Insurer Innovation Award 2024
Axa Assurance Maroc - Insurer Innovation Award 2024Axa Assurance Maroc - Insurer Innovation Award 2024
Axa Assurance Maroc - Insurer Innovation Award 2024
 
Artificial Intelligence: Facts and Myths
Artificial Intelligence: Facts and MythsArtificial Intelligence: Facts and Myths
Artificial Intelligence: Facts and Myths
 
What Are The Drone Anti-jamming Systems Technology?
What Are The Drone Anti-jamming Systems Technology?What Are The Drone Anti-jamming Systems Technology?
What Are The Drone Anti-jamming Systems Technology?
 
GenAI Risks & Security Meetup 01052024.pdf
GenAI Risks & Security Meetup 01052024.pdfGenAI Risks & Security Meetup 01052024.pdf
GenAI Risks & Security Meetup 01052024.pdf
 
Presentation on how to chat with PDF using ChatGPT code interpreter
Presentation on how to chat with PDF using ChatGPT code interpreterPresentation on how to chat with PDF using ChatGPT code interpreter
Presentation on how to chat with PDF using ChatGPT code interpreter
 
Evaluating the top large language models.pdf
Evaluating the top large language models.pdfEvaluating the top large language models.pdf
Evaluating the top large language models.pdf
 
ProductAnonymous-April2024-WinProductDiscovery-MelissaKlemke
ProductAnonymous-April2024-WinProductDiscovery-MelissaKlemkeProductAnonymous-April2024-WinProductDiscovery-MelissaKlemke
ProductAnonymous-April2024-WinProductDiscovery-MelissaKlemke
 
Boost Fertility New Invention Ups Success Rates.pdf
Boost Fertility New Invention Ups Success Rates.pdfBoost Fertility New Invention Ups Success Rates.pdf
Boost Fertility New Invention Ups Success Rates.pdf
 
Boost PC performance: How more available memory can improve productivity
Boost PC performance: How more available memory can improve productivityBoost PC performance: How more available memory can improve productivity
Boost PC performance: How more available memory can improve productivity
 
How to Troubleshoot Apps for the Modern Connected Worker
How to Troubleshoot Apps for the Modern Connected WorkerHow to Troubleshoot Apps for the Modern Connected Worker
How to Troubleshoot Apps for the Modern Connected Worker
 
A Domino Admins Adventures (Engage 2024)
A Domino Admins Adventures (Engage 2024)A Domino Admins Adventures (Engage 2024)
A Domino Admins Adventures (Engage 2024)
 
Finology Group – Insurtech Innovation Award 2024
Finology Group – Insurtech Innovation Award 2024Finology Group – Insurtech Innovation Award 2024
Finology Group – Insurtech Innovation Award 2024
 
2024: Domino Containers - The Next Step. News from the Domino Container commu...
2024: Domino Containers - The Next Step. News from the Domino Container commu...2024: Domino Containers - The Next Step. News from the Domino Container commu...
2024: Domino Containers - The Next Step. News from the Domino Container commu...
 
CNv6 Instructor Chapter 6 Quality of Service
CNv6 Instructor Chapter 6 Quality of ServiceCNv6 Instructor Chapter 6 Quality of Service
CNv6 Instructor Chapter 6 Quality of Service
 

A reanalysis of the ancient mitochondrial dna sequences (guitiã©rrez et al.)

  • 1. A Reanalysis of the Ancient Mitochondrial DNA Sequences Recovered from Neandertal Bones Gabriel Gutierrez,* Diego Sanchez,† and Antonio Marın* ´ ´ ´ *Departamento de Genetica, Universidad de Sevilla, Spain; and †Instituto de Biologıa y Genetica Molecular, ´ ´ ´ Universidad de Valladolid, Spain Recent reports analyzing mitochondrial DNA sequences from Neandertal bones have claimed that Neandertals and modern humans are different species. The phylogenetic analyses carried out in these articles did not take into account the high substitution rate variation among sites observed in the human mitochondrial D-loop region and also lack an estimation of the parameters of the nucleotide substitution model. The separate phylogenetic position of Neandertals is not supported when these factors are considered. Our analysis shows that Neandertal-Human and Human-Human pairwise distance distributions overlap more than what previous studies suggested. We also show that the most ancient Neandertal HVI region is the most divergent when compared with modern human sequences. However, the opposite would be expected if the sequence had not been modified since the death of the specimen. Such incongruence is discussed in the light of diagenetic modifications in ancient Neandertal DNA sequences. Introduction The classical view emerging from anatomical and tide substitution nor estimated the model parameters (ta- archeological studies places Neandertals as a different ble 1). An abundant literature (Yang, Goldman, and Fri- species from Homo sapiens. This is in agreement with day 1994; Swofford et al. 1996; Huelsenbeck and Ran- the Out-of-Africa hypothesis (Cann, Stoneking, and Wil- nala 1997; Brocchieri 2001; Posada and Crandall 2001) son 1987), which predicts that Neandertals coexisted emphasizes the need for an accurate estimation of the without mating with modern humans who originated in nucleotide substitution model and parameters, correction Africa from 100,000 to 200,000 years ago (Stringer and for among-site rate variation, taxa sampling, and selec- Andrews 1988). Instead, recent anatomical and paleon- tion of the outgroup to attain a correct tree tological research (Wolpoff et al. 2001) supports the reconstruction. multiregional hypothesis, which propounds that some The purpose of this article is to reanalyze the avail- populations of archaic Homo evolved into modern hu- able Neandertal DNA sequence data. After selecting the man populations in many regions. Consequently, Nean- appropriate extant human D-loop data sets, we used the dertals could have contributed to the genetic pool of maximum-likelihood principle for model selection and present-day Europeans. parameter estimation to perform a novel phylogenetic Studies about modern human genetic diversity reconstruction. (Foley 1998; Jorde et al. 2000) assume that Neandertals were not related to modern humans, although such as- Data and Methods sumptions have been extensively debated (Nordborg Sequences and Data Sets 1998; Hawks and Wolpoff 2001; Relethford 2001). Five mitochondrial DNA D-loops have been recov- We have used the MOUSE 1.0 database (Burchardt, ered from Neandertal bones (Krings et al. 1997; Krings von Haeseler, and Meyer 1999), an aligned compilation et al. 1999; Krings et al. 2000; Ovchinnikov et al. 2000). of mtDNA control regions of primate species that con- Henceforth, we will refer to these research groups as the tained the Feldhofer Neandertal sequences. An earlier Neandertal sequencing groups (NSGs). The phylogenet- version of this database (HvrBase) was used by the ic analyses of these sequences located Neandertal DNA NSG. Other Neandertal sequences were retrieved from at the base of modern human diversity (fig. 2C), sug- GenBank (table 1) and manually aligned to our gesting that the Neandertal genes probably did not con- MOUSE-selected data sets. tribute to the modern human genetic pool. We carried out two analyses: the first analysis con- However, the human D-loop region shows an ex- cerns the HVI region and includes three Neandertal se- treme variation in the substitution rate among sites (Ex- quences. The second analysis concerns the HVI plus coffier and Yang 1999; Meyer, Weiss, and von Haeseler HVII regions including two Neandertal sequences. The 1999) and a high amount of parallel mutations (Tamura HVII region of the Mezmaiskaya specimen has not been and Nei 1993) that complicate phylogenetic reconstruc- recovered. tions (Maddison, Ruvolo and Swofford 1992; Ingman et In the first analysis (HVI region) we included hu- al. 2000). Moreover, from a phylogenetic point of view, man entries containing at least positions 16056 to 16378 the NSG neither selected for the best model of nucleo- of the Anderson et al. (1981) reference sequence (fig. 1). This segment covers the minimal region common to Key words: Neandertal, ancient DNA, D-loop. the three Neandertal entries. Human sequences, dupli- cated or ambiguous, were deleted. This selection ren- Address for correspondence and reprints: Gabriel Gutierrez, De- ´ partamento de Genetica. Universidad de Sevilla, Apartado 1095, 41080 ´ dered 1,905 human sequences (328 Africans, 471 Sevilla, Spain. E-mail: ggpozo@us.es. Asians, 211 Australians-Oceanians, 475 Europeans, and Mol. Biol. Evol. 19(8):1359–1366. 2002 420 Americans). Three Pan paniscus and three Pan 2002 by the Society for Molecular Biology and Evolution. ISSN: 0737-4038 troglodytes sequences were added as outgroup. Also, we 1359
  • 2. 1360 Gutierrez et al. ´ Table 1 Reported Neandertal Mitochondrial DNA Sequences and Methods Used for Phylogenetic Analysis Sequence Tree Model of nucleotide Paper Data Recov- Sequence Geographic Reconstruction Substitution and Set Studied ered Length Boundariesa Region Method Program Used Branch Support Krings et al. HVI 379 16023–16400 Feldhofer, Ger- Neighbor-join- Maximum-likelihood dis- Likelihood mapping 1997 . . . . . . many ing tances (PHYLIP) (TREE-PUZZLE) F84 model HVI . . . . . . . TS/TV ratio 20 (not esti- mated) No gamma Krings et al. HVII 345 57–398 Feldhofer, Ger- Neighbor-join- Maximum-likelihood dis- Likelihood mapping 1999 . . . . . . many ing tances (PHYLIP) (TREE-PUZZLE) F84 model HVI HVII . . . . TS/TV ratio estimated with TREE-PUZZLE No gamma Ovchinnikov HVI 345 16056–16399 Mezmaiskaya, Neighbor-join- Corrected distances Bootstrap (PAUP*) et al. Northern ing, Maxi- Tamura-Nei model with 2000 . . . . . . Caucasus mum parsi- program defaults mony Gamma with a shape val- ue 0.4 HVI . . . . . . . (PAUP*) Krings et al. HVI 357 16023–16378 Vindija, Croatia Neighbor-join- Maximum-likelihood dis- Likelihood mapping 2000 . . . . . . ing tances (PHYLIP) (TREE-PUZZLE) HVII 288 57–343 F84 model HVI HVII . . . . TS/TV ratio estimated with TREE-PUZZLE No gamma a Taking the sequence shown in Anderson et al. (1981) as a reference. discarded alignment columns where one sequence correspond to the longest Neandertal sequence (fig. 1). showed an insertion, whereas the rest did not show any In the second analysis we included individuals where insertion. The final alignment contains 3 Neandertal, both HVI and HVII regions were sequenced at least 1,905 human, and 6 chimpanzee sequences. The range from positions 16056–16378 and 57–343, respectively used for analysis covers positions 16023–16400, that (fig. 1). These ranges cover the region common to the FIG. 1.—Minimum ranges required for human HVI and HVII sequences to be selected. The minimum range covers the common region of three HVI or two HVII Neandertal sequences. The maximum range covers the longest Neandertal HVI or HVII sequence. The maximum range settles the alignment length. The numbers correspond to the ranges covered by the MOUSE database according to the Anderson et al. (1981) reference sequence.
  • 3. Neandertal mtDNA Phylogeny 1361 Table 2 Parameter Estimation of the Tamura-Nei Model by the Maximum-Likelihood method RATE HETEROGENEITY PARAMETERS BASE COMPOSITION RATE MATRIX Gamma Shape Proportion of DATA SET A C G T A↔C A↔G A↔T C↔G C↔T G↔T Parametera Invariable Sites 1,914 HVI sequences 1,905 Humans . . . . . 0.34 0.36 0.11 0.20 1 21.78 1 1 28.73 1 0.70 0.27 3 Neandertals . . . . . 3 Pan troglodytes . . 3 Pan paniscus . . . . 385 HVI HVII sequences 377 Humans . . . . . . 0.32 0.35 0.14 0.19 1 16.30 1 1 29.62 1 0.40 0.26 2 Neandertals . . . . . 3 Pan troglodytes . . 3 Pan paniscus . . . . a Four categories were used for discrete gamma distribution. two Neandertal sequences. Repeated or ambiguous en- Results and Discussion tries were deleted. A total of 377 human entries was Selection of Best Model of Nucleotide Substitution, selected (79 Africans, 59 Asians, 84 Australians-Ocean- and Maximum-Likelihood Estimation of the Model ians, 123 Europeans, and 32 Americans). The final Parameters alignment contains 2 Neandertal, 377 human, and 6 The best model fitting the HVI and HVI HVII chimpanzee sequences that cover positions 16023– sets is the Tamura-Nei with a gamma distribution for 16400 and 57–343. We deleted alignment columns rate heterogeneity and a proportion of invariable sites, where most sequences showed a gap. out of the 56 different models implemented in the MO- DELTEST program. Actually, this model was developed Model Testing for the primate D-loop region (Tamura and Nei 1993). The advantage of applying a correction for rate variation In order to select the best model of nucleotide sub- among sites in this region has also been reported (Ta- stitution fitting each sequence set, we have followed the mura and Nei 1993; Wakeley 1993; Excoffier and Yang procedure described by Posada and Crandall (1998), im- 1999; Meyer, Weiss, and von Haeseler 1999). It has been plemented in the MODELTEST program. This approach shown that correction for rate variation among sites and first obtains a neighbor-joining tree (Saitou and Nei consideration of invariable sites improve phylogenetic 1987), using the Jukes-Cantor model of nucleotide sub- reconstruction in cases where a long branch attraction stitution (Jukes and Cantor 1969) and then uses a like- (LBA) artifact exists (Philippe and Laurent 1998). As lihood ratio test statistic to select the best model and we will show later, chimpanzee sequences can attract the estimate its parameters, keeping the same tree topology. Neandertal ones. The parameters estimated in our work (table 2) are Pairwise Distances similar to those obtained by other authors (Excoffier and Yang 1999; Meyer, Weiss, and von Haeseler 1999). Uncorrected and maximum-likelihood pairwise dis- There is a strong difference between transitions and tances have been computed using PAUP* 4.0 (Swofford transversions, and a low value for the gamma distribu- 1998). Maximum-likelihood distances were calculated tion shape parameter, which indicates a strong hetero- using the best model fitting the data. geneity in the substitution rate among sites. The value of the shape parameter estimated here is greater than Phylogenetic Analysis and Bootstrapping other estimations (Excoffier and Yang 1999; Meyer, Weiss, and von Haeseler 1999) because we have intro- Phylogenetic analyses were carried out using duced a parameter for the proportion of invariable sites. PAUP* 4.0 (Swofford 1998). For each data set the pro- cedure was: (1) the sequence order was randomized, (2) Phylogenetic Reconstruction and Bootstrap the maximum-likelihood distances (using the selected model and the best parameters) were computed, and (3) Schematic representations of the bootstrap tree to- a neighbor-joining tree (Saitou and Nei 1987) was con- pologies derived from our HVI and HVI HVII data structed for 100 bootstrap replicates (Felsenstein 1985). sets are shown in figure 2A and B. The detailed topol- Interior branch tests (Sitnikova, Rzhetsky, and Nei ogies, including 1,914 and 385 sequences, respectively, 1995) were carried out with the program PHYLTEST are not shown here, but are available upon request. 2.0 (Kumar 1996) using the most complex model avail- Bootstrap values were not significant for most nodes. able in this program: the Kimura two-parameter model Although the three Neandertal sequences clustered to- (Kimura 1980) with gamma correction. gether, we obtained no support for a branch separating
  • 4. 1362 Gutierrez et al. ´ FIG. 2.—Phylogenetic relationships of Neandertals. Chimpanzee sequences are used as outgroup. (A) The bootstrap majority rule consensus tree derived from the HVI data set was obtained when considering the best-fit model of nucleotide substitution and best estimation of model parameters (see table 2). (B) The same as in (A) for the HVI HVII data set. In (C) we show a representation of the trees and branch support obtained by, Krings et al. (1997), Krings et al. (1999), Krings et al. (2000), and Ovchinnikov et al. (2000). NSG, Neandertal sequencing groups. the Neandertal cluster from the human sequences. Our strate that Neandertals are outside of modern human D- HVI tree (fig. 2A) is similar to the NSG one, but branch loop variability. In particular, Krings et al. (1997) stated support is not significant. The HVI HVII tree (fig. that ‘a total of 0.002% of the pairwise comparisons be- 2B) places 10 Africans sequences as outgroup of Nean- tween human mtDNA sequences were larger than the dertals and other humans, but again, the bootstrap value smallest difference between the Neandertal and the hu- is not significant. Therefore, our results suggest that the mans.’ We think that this point merits further analysis. Neandertal sequences cannot be considered an outgroup The current database is biased because of the overrep- for modern humans. This result is in contrast to the tree resentation of some populations and the underrepresen- obtained by the NSG, where the Neandertal sequences tation of others. For instance, the MOUSE database con- appear basal to modern humans when using chimpanzee tains 6,012 entries for the HVI region, but 31% of the sequences as outgroup (fig. 2C). entries belong to only 20 populations out of 206 popu- Given that neither the bootstrap method (Felsen- lations represented (10% of the total of populations). stein 1985) nor the likelihood mapping method used by The extreme cases are 306 Koreans, 126 Yaps, 120 Cay- Krings et al. (1997, 1999, 2000) have statistical mean- apa Amerindians, 119 Mandeka, 115 Palau, and 100 ing, we performed the interior branch test. It has been white British. There are also 1,417 entries of undeter- shown that the confidence value of this test is the com- mined population (40% of them are from North America plement of the P values in the standard statistical test and 23% European, but only 9% are from Africa). Thus, (Sitnikova, Rzhetsky, and Nei 1995). We divided our African populations containing the most ancient lineages data sets into four clusters: (1) chimpanzees, (2) Nean- and the highest variation are underrepresented in the dertals, (3) extant human sequences located at the base database. of the HVI HVII tree (fig. 2B) that correspond to 10 Because of the database overrepresentation of some !Kung entries of the MOUSE database, and (4) the rest human populations, the distribution of pairwise distanc- of humans. We then determined whether the lengths of es is biased. A large part of pairwise comparisons are the interior branches of the three possible trees for the made between individuals belonging to the same pop- four sequence clusters are significantly different from 0. ulation. Likewise, it is expected that most individuals The result of this test is not significant for either the from a single population will show similar distances to HVI or HVI HVII regions. Thus, like the bootstrap a given outgroup (Neandertal, in this case). To overcome analyses, the interior branch test suggests that a poly- this problem, we considered another sample of the hu- tomy is the best representation for the evolutionary tree man variation. We first sorted the HVI sequences in our relating Neandertal and extant humans. data set according to its uncorrected distance to the ref- erence sequence (Anderson et al. 1981). Then we Pairwise Distances grouped them into 171 classes, containing equidistant The NSG reported that the pairwise comparisons sequences (considering four decimals), and chose one between the Neandertal and human sequences demon- sequence at random from each class. The computation
  • 5. Neandertal mtDNA Phylogeny 1363 FIG. 3.—The three possible quartets between the HVI sequence from the Feldhofer Neandertal, a chimpanzee, and two humans. The human A is one of the most divergent sequences with respect to the reference sequence (Anderson et al. 1981), and the human B is one of the less divergent. Quartets were evaluated with the program TREE-PUZZLE under the F84 model (the transition-transversion ratio was 20). Their respective log-likelihoods are shown below them. of pairwise distances between the 171 randomly selected best nucleotide substitution model for a given data set sequences and the Neandertals rendered 1.6% of human- (Huelsenbeck and Hillis 1993; Sullivan and Swofford human comparisons larger than the smallest difference 1997; Cunningham, Zhu, and Hillis 1998). The same between Neandertals and humans. Likewise, 27% of the considerations apply to the choice of the branch support comparisons are lower than the largest human-human method. The bootstrap method has some caveats (Cum- difference. This result suggests that Neandertals se- mings, Otto, and Wakeley 1995), and the quartet puz- quences are not so different from those of extant hu- zling (likelihood mapping) has also been criticized for mans, in contrast to the NSG claims. overestimating branch support values (Cao, Adachi, and Hasegawa 1998). Final Considerations Secondly, we believe that the likelihood mapping values supporting Neandertals as a different species A main conclusion can be extracted from our anal- might be artifactually increased. To illustrate this point, yses: the phylogenetic position of the ancient DNA se- quences recovered from Neandertal bones is sensitive to we took two human HVI sequences showing maximal the phylogenetic methods employed. It depends on the divergence between them, a chimpanzee, and the Feld- model of nucleotide substitution, the branch support hofer Neandertal. The three possible quartets were eval- method, and the set of data used. Adcock et al. (2001) uated with the program TREE-PUZZLE (Strimmer and recovered HVI sequences of archaic human bones from von Haeseler 1996) with the same model and parameter Australia, and their phylogenetic analysis showed that used by Krings et al. (1997). It can be seen (fig. 3) that two of the specimens were outgroups even for the most the chimpanzee branch is very long, and that the Ne- ancient African lineages. They concluded that this is an andertal branch is longer than the two humans, opening evidence supporting the multiregional hypothesis. How- the possibility of a LBA artifact. It has been reported ever, a second analysis carried out by Cooper et al. that quartet methods are very prone to LBA (Huelsen- (2001) that took into account the heterogeneity of rates beck 1998). Thus, the best-scored topology is usually between sites and a large sample of modern humans, the one joining long branches in exhaustive quartet eval- showed that both HVI sequences are located among ex- uations. Another issue relates to the significance of the tant humans. This case illustrates the influence of the log-likelihood values. In the trees drawn in figure 3, the nucleotide substitution model on the phylogenetic re- best score is for the tree that joins Neandertal and chim- construction of the human D-loop region. panzee sequences. However, the log-likelihoods are very The NSG studies used poor parameter models of similar between the alternative topologies. The Kishino- nucleotide substitution for their analyses, whereas we Hasegawa test (Kishino and Hasegawa 1989) yielded no opted for complex (parameter rich) models following the significant differences between them at the 5% level. likelihood ratio test. Both alternatives have pros and This example illustrates that likelihood mapping can se- cons. Yang (1997) and Posada and Crandall (2001) en- lect as the best topology one that is not significantly courage the use of the best-fit model, although they re- better than the other two. A third argument against the ported some examples where simple models can recover use of likelihood mapping in this study has to do with the true phylogenetic tree better than complex models. the database population bias mentioned earlier. It is not Several authors highlight the importance of using the advisable to perform likelihood mapping with a database
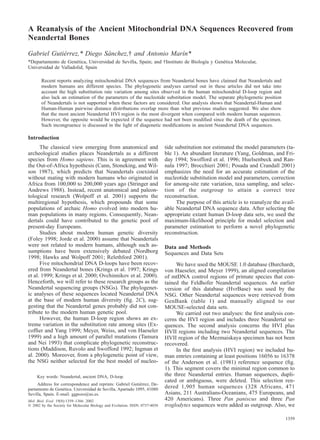
  • 6. 1364 Gutierrez et al. ´ FIG. 4.—Comparison between ancient DNA sequences of two Neandertal specimens and extant humans. Neandertal specimen A (the most ancient) would be expected to show a mean distance to humans shorter than the most recent one (Neandertal B) if DNA had suffered no damage. where most human sequences are very similar among quences to determine the phylogenetic position of Nean- themselves. dertals because no tree topology is favored. In part, this Ovchinnikov et al. (2000) also obtained a high is caused by short sequences with a high proportion of bootstrap value (95%) for the Neandertal clade, segre- invariable sites. Ingman et al. (2000) noted that the D- gating them from modern humans. When we used the loop region, in spite of its wide use for human phylo- same phylogenetic procedures, i.e., corrected Tamura- genetic analysis, is not an appropriate region of the mi- Nei distances with a gamma distribution of 0.4, we ob- tochondrial genome for answering phylogenetic tained a lower bootstrap value (62%). An explanation questions. for this discrepancy could be that Ovchinikov et al. did Another interesting issue is the possibility that the not select human sequences by length and did not elim- Neandertal sequences were artifactual. Caldararo and inate sequences with ambiguities. Missing data are a Gabow (2000) noticed that some of the nucleotide sub- common nuisance factor in phylogenetic analysis stitutions found in the Feldhofer Neandertal sequence (Wiens 1998). Although we obtained a lower bootstrap matched those found in other human ancient HVI se- value, we think that 62% is still a high bootstrap value quences. They attributed these similarities to diagenetic compared with the ones obtained when maximum-like- changes that occurred in fossil DNA. Hansen et al. lihood distances are used (fig. 2A and B). It has been (2001) studied different clones of ancient DNA ampli- shown that maximum-likelihood distances have some fications and concluded that PCR can introduce errors advantages over corrected distances, reducing sampling caused by the miscoding lesions of ancient DNA. In the variances of the transition-transversion ratio estimations absence of diagenetic changes, the mean distance be- (Swofford et al. 1996). Meyer, Weiss, and von Haeseler tween an ancient sequence and an extant one ought to (1999) estimated a transition-transversion ratio of 15.55 be larger than the distance between a more ancient se- for the HVI region. This points to an underestimation quence and the extant one. So, the more ancient a se- by Ovchinnikov et al. (2000) of the number of substi- quence, the shorter its distance to the extant sequences tutions along the tree branches. (fig. 4). We tested this prediction by computing the av- The low bootstrap values obtained in our work in- erage distances between each Neandertal HVI sequence dicate the lack of resolution of the HVI and HVII se- and our data set of extant HVI human sequences (table 3). It can be seen that the most recent specimen (Mez- Table 3 maiskaya) shows a shorter distance than the oldest one Mean Distances Between Neandertal and 1905 Modern (Feldhofer). This result can be explained by a different Human HVI Sequences nucleotide substitution rate among Neandertal lineages (populations) or by miscoding DNA lesions in Nean- Maximum- Neandertal Likelihood dertal fossils. Had DNA damage increased the differ- Sequence Datea p Distance Distanceb ences between Neandertal and modern humans, Nean- Feldhofer . . . . . . . . 40,000–100,000 0.0801 0.1050 dertals would be more akin to modern humans than what Mezmaiskaya . . . . 29,195 0.0689 0.0898 recent claims suggest. Vindija. . . . . . . . . . 42,000 0.0677 0.0869 Acknowledgments a Years before present. b Under the best model, Tamura-Nei with gamma for rate heterogeneity and We thank G. Gutierrez-Prieto and two anonymous ´ the model parameters shown in table 2. referees for helpful comments on the manuscript. This
  • 7. Neandertal mtDNA Phylogeny 1365 work was supported in part by the DGICYT BIO-1999- of mitochondrial, autosomal, and Y-chromosome data. Am. 065-C02-02 of the Spanish Government. J. Hum. Genet. 66:979–988. JUKES, T. H., and C. R. CANTOR. 1969. Evolution of protein molecules. Pp. 21–132 in H. N. MUNRO, ed. Mammalian LITERATURE CITED protein metabolism. Academic Press, New York. KIMURA, M. 1980. A simple method for estimating evolution- ADCOCK, G. J., E. S. DENNIS, S. EASTEAL, G. A. HUTTLEY, L. ary rates of base substitutions through comparative studies S. JERMIIN, W. J. PEACOCK, and A. THORNE. 2001. Mito- of nucleotide sequences. J. Mol. Evol. 16:111–120. chondrial DNA sequences in ancient Australians: implica- KISHINO, H., and M. HASEGAWA. 1989. Evaluation of the max- tions for modern human origins. Proc. Natl. Acad. Sci. USA 98:537–542. imum likelihood estimation of the evolutionary tree topol- ANDERSON, S., A. T. BANKIER, B. G. BARRELL et al. (14 co- ogies from DNA sequence data, and the branching order in authors). 1981. Sequence and organization of the human Hominoidea. J. Mol. Evol. 29:170–179. mitochondrial genome. Nature 290:457–465. KRINGS, M., C. CAPELLI, F. TSCHENTSCHER, H. GEISERT, S. BROCCHIERI, L. 2001. Phylogenetic inferences from molecular MEYER, A. VON HAESELER, K. GROSSSCHMIDT, G. POS- ¨ ¨ SNERT, M. PAUNOVIC, and S. PAABO. 2000. A view of Ne- sequences: review and critique. Theor. Popul. Biol. 59:27– 40. andertal genetic diversity. Nat. Genet. 26:144–145. BURCHARDT, F., A. VON HAESELER, and S. MEYER. 1999. KRINGS, M., H. GEISERT, R. W. SCHMITZ, H. KRAINITZKI, and ¨ ¨ S. PAABO. 1999. DNA sequence of the mitochondrial hy- HvrBase: compilation of mtDNA control region sequences from primates. Nucleic Acids Res. 27:138–142. pervariable region II from the Neandertal type specimen. CALDARARO, N., and S. GABOW. 2000. Mitohondrial DNA Proc. Natl. Acad. Sci. USA 96:5581–5585. analysis and the place of Neandertals in Homo. Ancient KRINGS, M., A. STONE, R. W. SCHMITZ, H. KRAINITZKI, M. Biomol. 3:135–158. ¨ ¨ STONEKING, and S. PAABO. 1997. Neandertal DNA sequenc- CANN, R. L., M. STONEKING, and A. C. WILSON. 1987. Mito- es and the origin of modern humans. Cell 90:19–30. chondrial DNA and human evolution. Nature 325:31–36. KUMAR, S. 1996. PHYLTEST: phylogenetic hypothesis testing CAO, Y., J. ADACHI, and M. HASEGAWA. 1998. Comment on software. Version 2.0. Pennsylvania State University, Uni- the quartet method for finding maximum-likelihood tree to- versity Park, Pa. pologies. Mol. Biol. Evol. 15:87–89. MADDISON, D. R., M. RUVOLO, and D. L. SWOFFORD. 1992. COOPER, A., A. RAMBAUT, V. MACAULAY, E. WILLERSLEV, A. Geographic origins of human mitochondrial DNA: phylo- J. HANSEN, and C. STRINGER. 2001. Human origins and an- genetic evidence from control region sequences. Syst. Biol. cient human DNA. Science 292:1655–1656. 41:111–124. CUMMINGS, M. P., S. P. OTTO, and J. WAKELEY. 1995. Sam- MEYER, S., G. WEISS, and A. VON HAESELER. 1999. Pattern of pling properties of DNA sequence data in phylogenetic nucleotide substitution and rate heterogeneity in the hyper- analysis. Mol. Biol. Evol. 12:814–822. variable regions I and II of human mtDNA. Genetics 152: CUNNINGHAM, C. W., H. ZHU, and D. M. HILLIS. 1998. Best- 1103–1110. fit maximum-likelihood models for phylogenetic inference: NORDBORG, M. 1998. On the probability of Neanderthal an- empirical tests with known phylogenies. Evolution 52:978– cestry. Am. J. Hum. Genet. 63:1237–1240. 987. ¨ ¨ OVCHINNIKOV, I. V., A. GOTHERSTROM, G. O. ROMANOVA, V. EXCOFFIER, L., and Z. YANG. 1999. Substitution rate variation ´ M. KHARITONOV, K. LIDEN, and W. GOODWIN. 2000. Mo- among sites in mitochondrial hypervarible region I of hu- lecular analysis of Neanderhal DNA from the northern Cau- mans and chimpanzees. Mol. Biol. Evol. 16:1357–1368. casus. Nature 404:490–493. FELSENSTEIN, J. 1985. Confidence limits on phylogenies: an PHILIPPE, H., and J. LAURENT. 1998. How good are deep phy- approach using the bootstrap. Evolution 39:783–791. logenetic trees? Curr. Opin. Genet. Dev. 8:616–623. FOLEY, R. 1998. The context of human genetic evolution. Ge- POSADA, D., and K. A. CRANDALL. 1998. MODELTEST: test- nome Res. 8:339–347. ing the model of DNA substitution. Bioinformatics 14:817– HANSEN, A. J., E. WILLERSLEV, C. WIUF, T. MOURIER, and P. 818. ARCTANDER. 2001. Statistical evidence for miscoding le- ———. 2001. Simple (wrong) models for complex trees: a sions in ancient DNA templates. Mol. Biol. Evol. 18:262– case from retroviridae. Mol. Biol. Evol. 18:271–275. 265. RELETHFORD, J. H. 2001. Absence of regional affinities of Ne- HAWKS, J., and M. WOLPOFF. 2001. Paleoanthropology and the andertal DNA with living humans does not reject multire- population genetics of ancient genes. Am. J. Phys. Anthro- pol. 114:269–272. gional evolution. Am. J. Phys. Anthropol. 115:95–98. HUELSENBECK, J. P. 1998. Systematic bias in phylogenetic SAITOU, N., and M. NEI. 1987. The neighbor-joining method: analysis: is the Strepsiptera problem solved? Syst. Biol. 47: a new method for reconstructing phylogenetic trees. Mol. 519–537. Biol. Evol. 4:406–425. HUELSENBECK, J. P., and D. M. HILLIS. 1993. Success of phy- SITNIKOVA, T., A. RZHETSKY, and M. NEI. 1995. Interior- logenetic methods in the four-taxon case. Syst. Biol. 42: branch and bootstrap tests of phylogenetic trees. Mol. Evol. 247–264. Biol. 12:319–333. HUELSENBECK, J. P., and B. RANNALA. 1997. Phylogenetic STRIMMER, K., and A. VON HAESELER. 1996. Quartet puzzling: methods come of age: testing hypothesis in an evolutionary a quartet maximum likelihood method for reconstructing context. Science 276:227–232. tree topologies. Mol. Biol. Evol. 13:964–969. ¨ ¨ INGMAN, M., H. KAESSMANN, S. PAABO, and U. GYLLENSTEN. STRINGER, C. B., and P. ANDREWS. 1988. Genetic and fossil 2000. Mitochondrial genome variation and the origin of evidence for the origin of modern humans. Science 239: modern humans. Nature 408:708–713. 1263–1268. JORDE, L. B., W. S. WATKINS, M. J. BAMSHAD, M. E. DIXON, SULLIVAN, J., and D. L. SWOFFORD. 1997. Are guinea pigs C. E. RICKER, M. T. SEIELTAD, and M. A. BATZER. 2000. rodents? The importance of adequate models in molecular The distribution of human genetic diversity: a comparison phylogenetics. J. Mamm. Evol. 4:77–86.
  • 8. 1366 Gutierrez et al. ´ SWOFFORD, D. L. 1998. PAUP*: phylogenetic analysis using WIENS, J. J. 1998. Combining data sets with different phylo- parsimony (*and other methods). Version 4. Sinauer Asso- genetic histories. Syst. Biol. 47:568–581. ciates, Sunderland, Mass. WOLPOFF, M. H., J. HAWKS, D. W. FRAYER, and K. HUNLEY. SWOFFORD, D. L., G. J. OLSEN, P. J. WADDELL, and D. M. 2001. Modern human ancestry at the peripheries: a test of HILLIS. 1996. Phylogenetic inference. Pp. 407–514 in D. M. the replacement theory. Science 291:293–297. HILLIS, C. MORITZ, and B. K. MABLE, eds. Molecular sys- YANG, Z. 1997. How often do wrong models produce better phylogenies? Mol. Biol. Evol. 14:105–108. tematics. Sinauer, Sunderland, Mass. YANG, Z., N. GOLDMAN, and A. FRIDAY. 1994. Comparison of TAMURA, K., and M. NEI. 1993. Estimation of the number of models for nucleotide substitution used in maximum-like- nucleotide substitutions in the control region of mitochon- lihood phylogenetic estimation. 1994. Mol. Biol. Evol. 11: drial DNA in humans and chimpanzees. Mol. Biol. Evol. 316–324. 10:512–526. WAKELEY, J. 1993. Substitution rate variation among sites in MANOLO GOUY, reviewing editor hypervariable region 1 of human mitochondrial DNA. J. Mol. Evol. 37:613–623. Accepted April 15, 2002