Top Rated Bangalore Call Girls Richmond Circle ⟟ 9332606886 ⟟ Call Me For Ge...
Donor Funding for Health
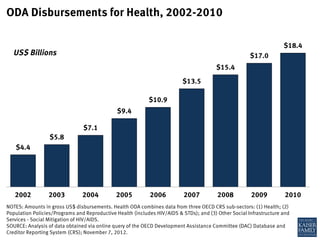
1. $4.4
$5.8
$7.1
$9.4
$10.9
$13.5
$15.4
$17.0
$18.4
2002 2003 2004 2005 2006 2007 2008 2009 2010
NOTES: Amounts in gross US$ disbursements. Health ODA combines data from three OECD CRS sub-sectors: (1) Health; (2)
Population Policies/Programs and Reproductive Health (includes HIV/AIDS & STDs); and (3) Other Social Infrastructure and
Services - Social Mitigation of HIV/AIDS.
SOURCE: Analysis of data obtained via online query of the OECD Development Assistance Committee (DAC) Database and
Creditor Reporting System (CRS); November 7, 2012.
ODA Disbursements for Health, 2002-2010
US$ Billions
2. $54.8
$68.3
$78.6
$111.2
$154.1
$113.7
$132.7 $136.3
$147.4
2002 2003 2004 2005* 2006* 2007 2008 2009 2010
* ODA in 2005 and 2006 was higher than previous and subsequent years due to scheduled and significant additional debt
relief transactions.
NOTES: Amounts in gross US$ disbursements. Health ODA combines data from three OECD CRS sub-sectors: (1) Health; (2)
Population Policies/Programs and Reproductive Health (includes HIV/AIDS & STDs); and (3) Other Social Infrastructure and
Services - Social Mitigation of HIV/AIDS.
SOURCE: Analysis of data obtained via online query of the OECD Development Assistance Committee (DAC) Database and
Creditor Reporting System (CRS); November 7, 2012.
Total ODA Disbursements, 2002-2010
US$ Billions
3. 2002 2003 2004 2005* 2006* 2007 2008 2009 2010
Debt Relief
Unspecified
Multisector/Other
Emergency Assistance
Commodity Aid
Production
Economic Infrastructure
Government/Civil Society
Education
Water
Health
* Debt relief ODA in 2005 and 2006 was higher than previous and subsequent years due to scheduled and significant
additional debt relief transactions.
NOTES: Amounts in gross US$ disbursements. Health ODA combines data from three OECD CRS sub-sectors: (1) Health; (2)
Population Policies/Programs and Reproductive Health (includes HIV/AIDS & STDs); and (3) Other Social Infrastructure and
Services - Social Mitigation of HIV/AIDS.
SOURCE: Analysis of data obtained via online query of the OECD Development Assistance Committee (DAC) Database and
Creditor Reporting System (CRS); November 7, 2012.
Total ODA Disbursements by Sector, 2002-2010
4. 8.1%
8.5%
9.0%
8.5%
7.1%
11.9% 11.6%
12.5% 12.5%
2002 2003 2004 2005 2006 2007 2008 2009 2010
NOTES: Amounts in gross US$ disbursements. Health ODA combines data from three OECD CRS sub-sectors: (1) Health; (2)
Population Policies/Programs and Reproductive Health (includes HIV/AIDS & STDs); and (3) Other Social Infrastructure and
Services - Social Mitigation of HIV/AIDS.
SOURCE: Analysis of data obtained via online query of the OECD Development Assistance Committee (DAC) Database and
Creditor Reporting System (CRS); November 7, 2012.
ODA Disbursements for Health as a Percentage of Total ODA,
2002-2010
US$ Billions
5. $4.4
$5.8
$7.1
$9.4
$10.9
$13.5
$15.4
$17.0
$18.4
32%
22%
32%
16%
23%
14%
10% 8%
2002 2003 2004 2005 2006 2007 2008 2009 2010
NOTES: Amounts in gross US$ disbursements. Health ODA combines data from three OECD CRS sub-sectors: (1) Health; (2)
Population Policies/Programs and Reproductive Health (includes HIV/AIDS & STDs); and (3) Other Social Infrastructure and
Services - Social Mitigation of HIV/AIDS.
SOURCE: Analysis of data obtained via online query of the OECD Development Assistance Committee (DAC) Database and
Creditor Reporting System (CRS); November 7, 2012.
Annual ODA Disbursements for Health & Year-to-Year
Percent Change, 2002-2010
US$ Billions
6. United States
31.7%
World Bank
21.2%
United
Kingdom
9.5%
UNFPA
5.9%Netherlands
3.5%France
3.0%
UNICEF
2.8%
Japan
2.7%
Germany
2.2%
Norway
1.9%
All Other DAC
12.8%
All Other
Multilaterals
2.8%
NOTES: Amounts in gross US$ disbursements. Health ODA combines data from three OECD CRS sub-sectors: (1) Health; (2)
Population Policies/Programs and Reproductive Health (includes HIV/AIDS & STDs); and (3) Other Social Infrastructure and
Services - Social Mitigation of HIV/AIDS.
SOURCE: Analysis of data obtained via online query of the OECD Development Assistance Committee (DAC) Database and
Creditor Reporting System (CRS); November 7, 2012.
Top 10 Donors for Health ODA, 2002 &2010
2002
Total = $4.4 billion
United States
34.6%
Global Fund
16.5%
United
Kingdom
6.6%
World Bank
5.1%GAVI
3.8%
EU Institutions
2.6%Germany
2.6%
Canada
2.5%
France
2.3%
Japan
2.1%
All Other DAC
12.1%
All Other
Multilaterals
8.8%
Non-DAC
0.4%
2010
Total = $18.4 billion
7. 8.0%
8.7%
9.7%
10.7%
11.4%
14.5%
15.1%
18.6%
19.2%
23.3%
Denmark
Italy
New Zealand
Australia
Canada
United Kingdom
Korea
Ireland
Luxembourg
United States
NOTES: Amounts in gross US$ disbursements. Health ODA combines data from three OECD CRS sub-sectors: (1) Health; (2)
Population Policies/Programs and Reproductive Health (includes HIV/AIDS & STDs); and (3) Other Social Infrastructure and
Services - Social Mitigation of HIV/AIDS.
SOURCE: Analysis of data obtained via online query of the OECD Development Assistance Committee (DAC) Database and
Creditor Reporting System (CRS); November 7, 2012.
Top 10 Donor Governments by Health ODA as a Percentage
of Total ODA, 2010
US$ Billions
9. 2002 2003 2004 2005 2006 2007 2008 2009 2010
Oceania
Europe
Middle East
South/Central Asia
Far East Asia
South America
North/Central America
Sub-Saharan Africa
North Africa
Regional
Unspecified
NOTES: Amounts in gross US$ disbursements. Health ODA combines data from three OECD CRS sub-sectors: (1) Health; (2)
Population Policies/Programs and Reproductive Health (includes HIV/AIDS & STDs); and (3) Other Social Infrastructure and
Services - Social Mitigation of HIV/AIDS.
SOURCE: Analysis of data obtained via online query of the OECD Development Assistance Committee (DAC) Database and
Creditor Reporting System (CRS); November 7, 2012.
Health ODA Disbursements by Region, 2002-2010
10. HIV/AIDS
19.1%
Basic Health &
Medical Care
19.3%
Management/
Workforce
26.4%
FP/RH
19.4%
Malaria
0.6%
Other
Infectious
Diseases
12.5%
TB
0.3%
Nutrition
2.4%
NOTES: Amounts in gross US$ disbursements. Health ODA combines data from three OECD CRS sub-sectors: (1) Health; (2)
Population Policies/Programs and Reproductive Health (includes HIV/AIDS & STDs); and (3) Other Social Infrastructure and
Services - Social Mitigation of HIV/AIDS.
SOURCE: Analysis of data obtained via online query of the OECD Development Assistance Committee (DAC) Database and
Creditor Reporting System (CRS); November 7, 2012.
Major Sub-Sector Share of Health ODA, 2002 & 2010
2002
Total = $4.4 billion
HIV/AIDS
40.2%
Basic Health &
Medical Care
14.8%
Management/
Workforce
13.2%
FP/RH
11.0%
Malaria
8.7%
Other
Infectious
Diseases
5.8%
TB
4.3%
Nutrition
2.0%
2010
Total = $18.4 billion
11. 2002 2003 2004 2005 2006 2007 2008 2009 2010
Management/Workforce
Basic Health & Medical Care
Nutrition
FP/RH
Other Infectious Diseases
Malaria
TB
HIV/AIDS
NOTES: Amounts in gross US$ disbursements. Health ODA combines data from three OECD CRS sub-sectors: (1) Health; (2)
Population Policies/Programs and Reproductive Health (includes HIV/AIDS & STDs); and (3) Other Social Infrastructure and
Services - Social Mitigation of HIV/AIDS.
SOURCE: Analysis of data obtained via online query of the OECD Development Assistance Committee (DAC) Database and
Creditor Reporting System (CRS); November 7, 2012.
Health ODA Disbursements by Major Sub-Sector, 2002-2010
12. -$0.17 (-14%)
-$0.03 (-8%)
$0.08 (3%)
$0.08 (4%)
$0.13 (9%)
$0.30 (60%)
$0.42 (18%)
$0.59 (9%)
Management/Workforce
FP/RH
Malaria
TB
Basic Health & Medical Care
HIV/AIDS
NOTE: Amounts in gross US$ disbursements. Health ODA combines data from three OECD CRS sub-sectors: (1) Health; (2)
Population Policies/Programs and Reproductive Health (includes HIV/AIDS & STDs); and (3) Other Social Infrastructure and
Services - Social Mitigation of HIV/AIDS.
SOURCE: Analysis of data obtained via online query of the OECD Development Assistance Committee (DAC) Database and
Creditor Reporting System (CRS); November 7, 2012.
Change in Health ODA Disbursements by Major Sub-Sector,
2009-2010
US$ Billions
Nutrition
Other Infectious Diseases
13. $1.4
$1.9
$2.4
$3.9 $3.9 $4.0
$5.5 $5.6
$6.2
2002 2003 2004 2005 2006 2007 2008 2009 2010
NOTES: Amounts in gross US$ disbursements. Health ODA combines data from three OECD CRS sub-sectors: (1) Health; (2)
Population Policies/Programs and Reproductive Health (includes HIV/AIDS & STDs); and (3) Other Social Infrastructure and
Services - Social Mitigation of HIV/AIDS.
SOURCE: Analysis of data obtained via online query of the OECD Development Assistance Committee (DAC) Database and
Creditor Reporting System (CRS); November 7, 2012.
ODA Disbursements for Water, 2002-2010
US$ Billions