Kalman Graffi - Monitoring and Management of P2P Systems - 2010
•
1 like•574 views

This is the long presentation of the contributions made in the dissertation of Dr.-Ing. Kalman Graffi - Monitoring and Management of P2P Systems. The talk was given at 29. Sept. 2009 in Madrid / Spain.

Recommended
Recommended
More Related Content
Viewers also liked
Viewers also liked (9)
Similar to Kalman Graffi - Monitoring and Management of P2P Systems - 2010
Similar to Kalman Graffi - Monitoring and Management of P2P Systems - 2010 (20)
More from Kalman Graffi
More from Kalman Graffi (18)
Recently uploaded
Recently uploaded (20)
Kalman Graffi - Monitoring and Management of P2P Systems - 2010
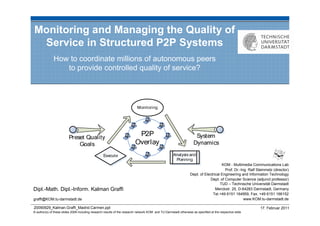
- 1. Monitoring and Managing the Quality of Service in Structured P2P Systems How to coordinate millions of autonomous peers to provide controlled quality of service? KOM - Multimedia Communications Lab Prof. Dr.-Ing. Ralf Steinmetz (director) Dept. of Electrical Engineering and Information Technology Dept. of Computer Science (adjunct professor) TUD – Technische Universität Darmstadt Dipl.-Math. Dipl.-Inform. Kalman Graffi Merckstr. 25, D-64283 Darmstadt, Germany Tel.+49 6151 164959, Fax. +49 6151 166152 graffi@KOM.tu-darmstadt.de www.KOM.tu-darmstadt.de 20090929_Kalman.Graffi_Madrid.Carmen.ppt 17. Februar 2011 © author(s) of these slides 2008 including research results of the research network KOM and TU Darmstadt otherwise as specified at the respective slide
- 2. Outline Motivation for Quality of Service On Influencing Quality in P2P Systems Overview on my Solution Management of P2P Systems through Monitoring and Automated Self-Configuration Monitoring in Structured P2P Systems Monitoring System- and Peer-specific Information Evaluation of the Monitoring Solution “SkyEye.KOM” Management of Structured P2P Systems A Self-Configuration Framework for P2P Systems Evaluation of the Self-Configuration Cycle Conclusion KOM – Multimedia Communications Lab 2
- 3. Outline Motivation for Quality of Service On Influencing Quality in P2P Systems Overview on my Solution Management of P2P Systems through Monitoring and Automated Self-Configuration Monitoring in Structured P2P Systems Monitoring System- and Peer-specific Information Evaluation of the Monitoring Solution “SkyEye.KOM” Management of Structured P2P Systems A Self-Configuration Framework for P2P Systems Evaluation of the Self-Configuration Cycle Conclusion KOM – Multimedia Communications Lab 3
- 4. The Peer-to-Peer Paradigm Peer-to-peer systems H(„ my data“ ) Users build infrastructure = 3107 1008 1622 2011 709 2207 Service is provided from users to users ? Peer-to-peer overlays 611 3485 2906 Connecting all peers, providing new functionality 12.5.7.31 E.g. Distributed Hash Tables, keyword-based search berkeley.edu planet-lab.org peer-to-peer.info 89.11.20.15 95.7.6.10 86.8.10.18 7.31.10.25 Evolution of applications / QoS demands File sharing Low Quality of Service (QoS) requirements Voice over IP Real-time requirements Video-on-demand Real-time and bandwidth requirements In the future: online community platforms Potential for high user interaction See: K. Graffi, AsKo, et al. “Peer-to-Peer Forschung - Überblick und Herausforderungen” KOM – Multimedia Communications Lab 4 In: it - Information Technology (Methods and Applications of Informatics and Information Technology), vol. 46, no. 5, p. 272-279, July 2007
- 5. Dynamics in P2P System Challenges for providing quality in p2p systems: Various scenarios User Distributed storage Content delivery Application Manage- Discovery and contacting of users ment Overlay Dynamics over time Network size Devices Churn Network Peer heterogeneity Peer capacities Connectivity Create a new overlay for every case? No, reuse existing overlays Goal: Monitor and manage the quality of service of the p2p systems KOM – Multimedia Communications Lab 5
- 6. Quality of Service in P2P Overlays Quality of Service “The well-defined and controllable behavior of a system with respect to quantitative parameters” Can we control the p2p system in a way that it fulfills our demands on a defined metric set? Quality of a system is described in metrics regarding performance and costs E.g. quality classes: Metric intervals, e.g. hop count [7; 10], data availability [97%; 99.9%] Application specific requirements Management in p2p systems Provider defines quality of service goals System adapts automatically, reaches and holds predefined metric intervals KOM – Multimedia Communications Lab 6
- 7. The Vision: An Example of Automatic Adaption of P2P Overlays to our Needs We want: P2P overlay Managment Fast storage, fast lookup! layer achieves what we want! 1622 2011 1008 2207 709 2507 2682 BUT: we do not 678 want to know what 659 611 3485 2906 is in the ‘black-box’ KOM – Multimedia Communications Lab 7
- 8. Resulting System… We want: P2P overlay Fast storage, fast lookup! PEER: Prioritize e.g. messages! 2 log( N ) 1622 2011 10 1008 2207 709 2507 1 log( N ) 7 2 OVERLAY: 2682 More Hop count connections 678 659 2906 200 ms 611 3485 UNDERLAY: Chose closer 50 ms contacts Duration of a hop KOM – Multimedia Communications Lab 8
- 9. Steps between… We want: P2P overlay e.g. for N=10K 2 log( N ) 10 1 log( N ) 2 7 1622 2011 1008 2207 Hop count 709 2507 2682 678 659 2906 611 3485 1. Hop count now? 2. What can fix hop count? 3. Fix hop count 4. Hold it fixed! KOM – Multimedia Communications Lab 9
- 10. Outline Motivation for Quality of Service On Influencing Quality in P2P Systems Overview on my Solution Management of P2P Systems through Monitoring and Automated Self-Configuration Monitoring in Structured P2P Systems Monitoring System- and Peer-specific Information Evaluation of the Monitoring Solution “SkyEye.KOM” Management of Structured P2P Systems A Self-Configuration Framework for P2P Systems Evaluation of the Self-Configuration Cycle Conclusion KOM – Multimedia Communications Lab 10
- 11. On Influencing Metrics in P2P Systems Management in p2p systems Provider defines quality of service goals System adapts automatically, reaches and holds predefined metric intervals Requirements on a solution Minimal invasive Applicability on various overlays How can we influence metrics in p2p systems? On various levels: peer, overlay, network Varying monitoring scope: local, partial global, global KOM – Multimedia Communications Lab 11
- 12. Using only Local Knowledge: Coordinated Bandwidth Utilization Towards QoS for overlay flows Delay, Loss Types of flows in P2P systems Layer 4 traffic flows Direct P2P communication Focus: Overlay flows Multi-hop: maintenance, user queries… Many, small messages (mice) Varying relevance for system Provide QoS to overlay flow according to its relevance KOM – Multimedia Communications Lab 12
- 13. Overlay Bandwidth Management Novel substrate “Network Wrapper” Controls delay and loss per “flow” Design decision based on observations Kademlia in PeerfactSim.KOM, 10.000 Peers Overlay and traditional flows differ significantly Stateless scheduler needed QoS requirements stored in messages HiPNOS.KOM: Highest Priority First, No Starvation 1. Queue Management Before: Introduce message priorities for loss and delay After: AQM: Drop message with lowest loss priority Queue Limit Scheduling:Send message with highest delay priority 2. Message Scheduling Avoid starvation: Periodically increase delay priority Before: of queued messages After: K. Graffi et al. “Taxonomy of Active Queue Management Strategies in Context of Peer-to-Peer Scenarios” KOM-TR-2007-01 KOM – Multimedia Communications Lab 13 K. Graffi et al. “Taxonomy of Message Scheduling Strategies in Context of Peer-to-Peer Scenarios” KOM-TR-2007-02
- 14. Overlay Bandwidth Management Results Results Proportional relations HiPNOS.KOM Regarding delay and loss According to chosen priorities General principle: QoS can be influenced by parameterization Limitations of the local view? If QoS demand changes, how to adopt? Not all metrics can be addressed HiPNOS.KOM E.g. Load balancing, support old peers How to pick the priorities? Global effects cannot be observed See: K. Graffi et al., “Overlay Bandwidth Management: Scheduling and Active Queue Management ofKOM – Multimedia Communications Lab 14 Overlay Flows” In: IEEE Local Computer Networks '07 (IEEE LCN’07), October 2007.
- 15. Motivation for Partial Global Knowledge Lessons learned Using only local information for management Parameters (of bandwidth allocation) influence on quality of service System-wide metrics cannot be considered / controlled Next step Investigate controlling of system-wide metrics (e.g. load balancing) From allocation of local resources to resources in the p2p network Extend the view on more peers swarm Scenario Generalized content delivery / multimedia P2P streaming Idea of swarms per chunk / file Providers and consumer of resources build a swarm KOM – Multimedia Communications Lab 15
- 16. Task / Load Allocation in the P2P Network Goal: Optimized allocation of tasks Maintainer stores according to specific criteria pointers on providers System wide metric: Load balancing and peer specific DHT information Heterogeneity: peer related information parameters Peers interested Resources offered in the res. ask for Allocated tasks for the system (AT) providing peers Provider Estimation of local tasks / load (LT) dispatching Bandwidth quality of the peer (Bq) with focus on Online time of the peer (OT) load balancing … easily extendable cs ( p, t ) : Peers × Time → R Scoring function determines most cs ( p, t ) = a1 ⋅ I P (t ) + a2 ⋅ I P (t ) + a3 ⋅ I P (t ) + a4 ⋅ I P (t ) AT LT Bq OT suitable provider according to optimization goal ai = weights for optimization goals See: K. Graffi et al. “Load Balancing for Multimedia Streaming in Heterogeneous Peer-to-Peer Systems”. – Multimedia Communications Lab 16 KOM In: 18th Int. Workshop on Network and Operating Systems Support for Digital Audio and Video (NOSSDAV '08), ACM SIGMM, May 2008.
- 17. Task / Load Allocation in the P2P Network Evaluation: Parameterized scoring function vs. random Load derivation decreased by up to 53% Up to 109% better results in comparison to random task assignment Conclusion Parametrizable scoring function: QoS demand can be adjusted during runtime System-wide metrics optimized Load balancing Bandwidth load balancing Online time Gain in Load comp. to deviation Limitation: random Effect limited to scope of the maintainer Need for global view on P2P system On system specific information On peer specific information See: K. Graffi et al. “Load Balancing for Multimedia Streaming in Heterogeneous Peer-to-Peer Systems”. – Multimedia Communications Lab 17 KOM In: 18th Int. Workshop on Network and Operating Systems Support for Digital Audio and Video (NOSSDAV '08), ACM SIGMM, May 2008.&
- 18. Conclusion on Influencing Metrics in P2P Systems Key question: Peer level How can I influence a system metric? 1008 1622 2011 709 2207 2507 Peer level Overlay level 2682 Schedule bandwidth, CPU, (…) usage 678 659 2906 Overlay level 611 3485 Underlay/ Tasks to heterogeneous peer capacities network level Network level Neighborhood selection Answer: Through setting “right” parameters 10 Derived requirements 7 Which metrics should be changed? Monitoring How to manage the p2p system? (Automated) self-configuration Hop count K. Graffi et al. “Overlay Bandwidth Management: Scheduling and Active Queue Management of Overlay Flows” IEEE LCN 2007 Communications Lab 18 KOM – Multimedia K. Graffi et al. “Load Balancing for Multimedia Streaming in Heterogeneous P2P Systems” ACM NOSSDAV 2008
- 19. Outline Motivation for Quality of Service On Influencing Quality in P2P Systems Overview on my Solution Management of P2P Systems through Monitoring and Automated Self-Configuration Monitoring in Structured P2P Systems Monitoring System- and Peer-specific Information Evaluation of the Monitoring Solution “SkyEye.KOM” Management of Structured P2P Systems A Self-Configuration Framework for P2P Systems Evaluation of the Self-Configuration Cycle Conclusion KOM – Multimedia Communications Lab 19
- 20. Management of P2P Systems through Automated Self-Configuration Quality goals are predefined Application and scenario specific e.g. Metric intervals Examples Goal interval for hop count: [7,10] Standard deviation of peer load: max 500% Goal Configuration should adapt to quality goals Automated meeting of predefined metric intervals Step 1: Monitor current system state Step 2: Analysis state, plan new parameter configuration Step 3: Distribute and adopt new parameter configuration on all peers KOM – Multimedia Communications Lab 20
- 21. Self-Configuration Cycle in P2P Systems KOM – Multimedia Communications Lab 21
- 22. Overview on the Solution Monitoring system state SkyEye.KOM: tree based monitoring for structured p2p systems Precise, yet with very low overhead Monitored metrics are analyzed Comparison to predefined quality goals Done in the root of the monitoring tree Derive new parameter configuration Based on parameter – metric correlations Using static / adaptive rules Distribute and adapt new configuration Using SkyEye.KOM for dissemination Configuration adopted by every peer Repeat self-configuration cycle until quality goals reached See: K. Graffi et al., “Monitoring and Management of Structured Peer-to-Peer Systems” KOM – Multimedia Communications Lab 22 In: IEEE Peer-to-Peer Computing '09 (IEEE P2P’09), September 2009.
- 23. Outline Motivation for Quality of Service On Influencing Quality in P2P Systems Overview on my Solution Management of P2P Systems through Monitoring and Automated Self-Configuration Monitoring in Structured P2P Systems Monitoring System- and Peer-specific Information Evaluation of the Monitoring Solution “SkyEye.KOM” Management of Structured P2P Systems A Self-Configuration Framework for P2P Systems Evaluation of the Self-Configuration Cycle Conclusion KOM – Multimedia Communications Lab 23
- 24. System- and Peer-specific Information Global system statistics Peer-specific information Statistics: Capacities: Average CPU usage Max / current bandwidth Average bandwidth utilization Operating System, Java version Average hop count CPU power Messages sent / received Free disk space Number of peers Responsibility range Message sizess Parent coordinator … … Statistical information: List-based concatenation avg, min, max, standard dev., sum,... E.g. peer 101, up bandwidth 27kb/s, … Information is aggragatable: Information is NOT aggragatable: Size of information remains the same Size of information grows with number Independent of number of peers of peers Leads to overhead issues K. Graffi et al. “SkyEye.KOM: An Information Management Over-Overlay for Getting the Oracle View on Structured P2P Systems”Communications Lab 24 KOM – Multimedia IEEE International Conference on Parallel and Distributed Systems (IEEE ICPADS ‘08), December 2008
- 25. General Challenges for the Approach Robustness Handling Churn Coping with Link-Losses Scalability Scaling in terms of participating peers Scaling in terms of exchanged information Performance High precision, low outliers Efficiency Lightweight solution Minimize complexity: easier to use, more robust Applicability Applicable on every (KBR-compatible) structured p2p overlay Independent of any application K. Graffi et al. “SkyEye.KOM: An Information Management Over-Overlay for Getting the Oracle View on Structured P2P Systems”Communications Lab 25 KOM – Multimedia IEEE International Conference on Parallel and Distributed Systems (IEEE ICPADS ‘08), December 2008
- 26. SkyEye.KOM – Architecture Design Decisions Integrated vs. new layer New layer allows wider applicability Set on top of KBR-compatible structured p2p overlays Reactive vs. proactive System state information is continuously interesting for all users Allows for fast queries Monitoring topology: bus, ring, star, mesh, tree Tree structure alleviate information aggregation Fixed out and in degree Position assignment: dynamic vs. deterministic Deterministic IDs used in topology, dynamically resolved with DHT For all structured P2P overlays Covered by DHT-function: route(msg, key), lookup(key) Usable by all functional layers/modules in the P2P system K. Graffi et al. “SkyEye.KOM: An Information Management Over-Overlay for Getting the Oracle View on Structured P2P Systems”Communications Lab 26 KOM – Multimedia IEEE International Conference on Parallel and Distributed Systems (IEEE ICPADS ‘08), December 2008
- 27. Topology of SkyEye.KOM Coordinator_ID 0,5 Concept of Over-overlay C0 Built on underlying structured overlay C_ID 0,25 C_ID 0,75 1 1 Unified ID space [0,1] decouples C C C_ID 0,125 C_ID 0,625 C_ID 0,875 from specific DHT implementation 2 2 C2 C_ID 0,375 C C Communicates via common API C2 route(msg, key) C_ID 0,3125 C3 Information Domains: 0,09 0,2 0,31 0,4 0,5 0,6 0,75 0,9 Peer ID determines position in tree 0 1 Receive information from children nodes Sends aggregated information to father 50 1 node (Coordinator) 45 10 DHT 15 40 20 30 Protocols for monitoring System-specific information Peer-specific information K. Graffi et al. “SkyEye.KOM: An Information Management Over-Overlay for Getting the Oracle View on Structured P2P Systems”Communications Lab 27 KOM – Multimedia IEEE International Conference on Parallel and Distributed Systems (IEEE ICPADS ‘08), December 2008
- 28. Gathering System-specific Information Some design decisions Equal roles for all peers Load similar for all peers in all positions Aggregation of statistics Sum, min, max, average Standard deviation, count [µ,σ,σ²,Σ, Statistic updates min,max] Periodically sent to parent peer [µ,σ,σ²,Σ, Aggregated in each node ( same size) min,max] Global view in root Every update is ACKed with global [µ,σ,σ²,Σ, view from above min,max] KOM – Multimedia Communications Lab 28
- 29. Gathering System-specific Information Some design decisions Equal roles for all peers Load similar for all peers in all positions Aggregation of statistics Sum, min, max, average Standard deviation, count [µ,σ,σ²,Σ, Statistic updates min, max] Periodically sent to parent peer Aggregated in each node ( same size) [µ,σ,σ²,Σ, min, max] Global view in root Every update is ACKed with global [µ,σ,σ²,Σ, view from above min, max] KOM – Multimedia Communications Lab 29
- 30. Some Remarks on SkyEye.KOM and Monitoring System Statistics Why is it generally applicable on DHTs? Unified ID space, using core DHT functions (Key based Routing API) Coordinator_ID C 0 0,5 Why is it robust against churn? C_ID 0,25 C_ID 1 1 0,75 If peer fails: automatically replaced in the DHT C C Updates are routed to new peer for aggregation C_ID 0,125 C_ID 0,625 C_ID 0,875 2 2 C2 C_ID 0,375 C C 2 C Why are costs low? C_ID One update: ~1kb, 0,3125 C3 Out + in degree = 1 + tree degree (2 or 4) Independent of position in the tree! 0,09 0,2 0,31 0,4 0,5 0,6 0,75 0,9 0 1 Age of information: 50 1 Limited by tree depth, O(log (N)) 10 45 DHT Influenced by update period 15 40 20 30 Just two message types: Update, ACK Assumed functions: route(msg, key), amIresponsible(key) KOM – Multimedia Communications Lab 30
- 31. Gathering Peer-specific Information Type of information Individual Peer ID and peer specific information: Free storage space, CPU power, bandwidth capabilities, online time, … Responsibility range, node degree, Coordinator ID, … Desired query Capacity-based peer search: Find N peers with e.g. node degree > 20, free storage space > 10MB, online time > 10h Design decision: proactive Constantly gathering peer information in the tree Query directly accesses prepared data Better for scenarios with frequent queries Challenge: Information cannot be aggregated grows in size Costs may overload the Coordinators Solution idea: replace weak peers in tree with strong Support Peers KOM – Multimedia Communications Lab 31
- 32. Gathering Peer-specific Information Supporting Peers for Load Balancing Coordinator Support Peer Peer Each peer defines max. load Coordinator may choose strong Supporting Peers Workload delegated to supporting peer Good peers chosen by 50/50 ratio Pick e.g. 10 best peers in the domain Unified ID space and abstr. functions Best 5 peers advertised one level up For SP: best 10 peers in the tree Second best 5 peers used best 1-5 best 1-5 Results For SP: best 5-10 from below In a tree with strong peers Best peers at the top, best 1-5 best 1-5 carrying most of the load No peer is overloaded For SP: best 6-10 For SP: best 6-10 KOM – Multimedia Communications Lab 32
- 33. Gathering Peer-specific Information: Protocol Update information: Query format: Peer 11, RAM = 700MB, Online = 12h 5_of_ RAM_>_1024_Int,CPU_>2048_Int … Threshold 150MB Query C0 Match 1 C0 15MB Match 2 Match 3 Threshold 50MB 42MB 37MB C1 C1 11MB 20MB Query Threshold 10MB 16MB Match 1 15MB Match 2 C2 SP C2 SP Threshold Query 200MB Query Query 10MB Match 1 Threshold Address Match 1 20MB 20MB of the Match 2 10MB Support-Peer Match 3 Match 4 C3 C3 Match 5 10MB KOM – Multimedia Communications Lab 33
- 34. Summary on Monitoring Solution SkyEye.KOM Monitoring scope: System-specific information: statistics on system-wide metrics Peer-specific information: detailed view on capabilities of individual peers For all structured P2P overlays Covered by KBR-function: route(msg, key), lookup(key) Usable by all functional layers in the P2P system Features: Overlay-independency Robustness, churn resistance No overloaded peer Supporting peer heterogeneity Low overhead KOM – Multimedia Communications Lab 34
- 35. Outline Motivation for Quality of Service On Influencing Quality in P2P Systems Overview on my Solution Management of P2P Systems through Monitoring and Automated Self-Configuration Monitoring in Structured P2P Systems Monitoring System- and Peer-specific Information Evaluation of the Monitoring Solution “SkyEye.KOM” Management of Structured P2P Systems A Self-Configuration Framework for P2P Systems Evaluation of the Self-Configuration Cycle Conclusion KOM – Multimedia Communications Lab 35
- 36. Evaluation and Simulation Setup Evaluation goals PeerfactSim.KOM Get an understanding for the behavior of SkyEye.KOM User Identify the performance and costs, limitations Application Metrics Simulation Engine Monitored and real metrics Manage- ment Relative monitoring error Overlay Monitoring age Traffic overhead Transport Simulation Setup Network IdealDHT: Dispatches messages to responsible peer Imitates perfect route(msg, key) 5000 Nodes Delay model: global network positioning Churn model: based on KAD measurements (Steiner et al.) Testbed evaluation Confirming simulation results See: K. Graffi et al., “Monitoring and Management of Structured Peer-to-Peer Systems” KOM – Multimedia Communications Lab 36 In: IEEE Peer-to-Peer Computing '09 (IEEE P2P’09), September 2009.
- 37. System Monitoring Performance Tree degree = 4 Update interval = 60sec K.See: K.D. Stingl et al.“Monitoringand Management ofof Structured Peer-to-Peer Systems” IEEE P2P 2009 Graffi, Graffi et al., “Monitoring and Management Structured P2P Systems” submitted to KOM – Multimedia Communications Lab 37 In: IEEE Peer-to-Peer Computing '09 (IEEE P2P’09), September 2009.
- 38. System Monitoring Costs Tree degree = 4 Update interval = 60sec K.See: K.D. Stingl et al.“Monitoringand Management ofof Structured Peer-to-Peer Systems” IEEE P2P 2009 Graffi, Graffi et al., “Monitoring and Management Structured P2P Systems” submitted to KOM – Multimedia Communications Lab 38 In: IEEE Peer-to-Peer Computing '09 (IEEE P2P’09), September 2009.
- 39. SkyEye.KOM: Tree Growth and Depth Logarithmic Tree Depth Example tree Tree degree (TD) = 2 Balanced, if ID space balanced Peers may be Coordinators at various levels not always 2 children KOM – Multimedia Communications Lab 39
- 40. SkyEye.KOM: General Parameter Variation Bandwidth consumption related to Precision / Age of information Out-bandwidth: update intervals (UI) Freshness tightly related to tree depth In-bandwidth: Proportional related to update interval update intervals, tree degree (TD) Information age: O(logTD N) * UI Costs for system-specific monitoring Costs: Can be kept < 100 byte / s Controllable quality and costs KOM – Multimedia Communications Lab 40
- 41. SkyEye.KOM: Smoothing of System Monitoring Exponential smoothing: Results: Weighted sum of history of Very precise monitoring measurements Capturing the status of a few UI before Weights decrease exponentially for older Low relative error in monitoring measurements History size H, exponential factor a KOM – Multimedia Communications Lab 41
- 42. SkyEye.KOM: Peer-specific Information Observations Quality of Information: Scope of view not complete Less useful peer information is dropped Determined by individual load limits of Tradeoff: Completeness vs. load limits Coordinators and Support Peers Peers in the results: >98% are online Exchange of root Load limit of new root = 270 Current load = 440 Support peer chosen Actual screenshot of demo KOM – Multimedia Communications Lab 42
- 43. SkyEye.KOM: Peer-specific Information Query – originators and solvers Effect of query complexity Scenario with 5000 peers Queries demanding better resources Most peers around level 10 are solved higher in the tree Most queries solved between root and “Good” peers bubble up in the tree peers at level 5 KOM – Multimedia Communications Lab 43
- 44. Testbed Setup Setup Scenario Up to 500 peers (on 37 PCs) Churn levels tested: 10,000 sec of simulation time 10%, 20%, 50% leaving nodes, Test-bed is good for evaluating random churn Costs in a real deployment Statistics and capacities are updated Less suitable for precision every 5 seconds KOM – Multimedia Communications Lab 44
- 45. Testbed: Number of Peers ~20% leaving 2 x ~50 % leaving ~10% leaving Number of Nodes Random churn Time [s] KOM – Multimedia Communications Lab 45
- 46. Testbed: Number of Peers per Tree Level With ~ 500 Peers most peers are located at level 7 and 8 Peers join and leave at all levels of the tree KOM – Multimedia Communications Lab 46
- 47. Testbed: Location of the Peers in the Tree Distribution of nodes in the levels 0 to 7 follows the function f ( x) = 2 x due to binary tree structure here: TD = 2 KOM – Multimedia Communications Lab 47
- 48. Testbed: Costs, Average Bandwidth Utilization Average bandwidth utilization of 3 KB/s Bandwidth utilization increases with increasing number of peers High bandwidth required for nodes at higher levels Please note: Update interval: 5s KOM – Multimedia Communications Lab 48
- 49. Testbed: Average Traffic per Peer per Level Bandwidth utilization increases towards the root Due to monitoring not-aggragatable peer-specific information However, no peer is overloaded KOM – Multimedia Communications Lab 49
- 50. Testbed: Topology of the Tree Topology link to Coordinator responsibility range With 44 Peers 8 tree levels are used (2 above minimum) Minimum (=O(logN)) not reached due to non uniform peer ID distribution KOM – Multimedia Communications Lab 50
- 51. Testbed: Topology of the Tree With 150 Peers 12 tree levels are used (4 above minimum) With 500 Peers 13 tree levels are used (4 above minimum) KOM – Multimedia Communications Lab 51
- 52. Summary on Monitoring in Structured P2P Systems Peer-specific global view Provides capacity-based peer search for monitored peer information Scope limited by the load limits of the individual peers Evaluation shows: Logarithmical tree depth, low average peer load Higher tree levels supported with strong Support Peers System-specific global view Provides global view on the quality of service of the system Rich system statistics, extendable, considering aggregatable metrics Evaluation shows: With smoothing: precise, low relative error Very low costs: due to aggregation and fixed node degree KOM – Multimedia Communications Lab 52
- 53. Outline Motivation for Quality of Service On Influencing Quality in P2P Systems Overview on my Solution Management of P2P Systems through Monitoring and Automated Self-Configuration Monitoring in Structured P2P Systems Monitoring System- and Peer-specific Information Evaluation of the Monitoring Solution “SkyEye.KOM” Management of Structured P2P Systems A Self-Configuration Framework for P2P Systems Evaluation of the Self-Configuration Cycle Conclusion KOM – Multimedia Communications Lab 53
- 54. A Self-Configuration Framework for P2P Systems Steps prepared Monitored status: Predefined quality goals given Metric goals current metrics P2P overlay parametrizable and parameters Monitoring reveals current system state Steps needed Derive new configuration Derive new parameter configuration (parameter set) Based on Predefined metric intervals Current metrics and parameter configuration Distribution Distribute new configuration to all peers timely to all peers Goal: System reaches and holds predefined metric intervals See: K. Graffi et al., “Monitoring and Management of Structured Peer-to-Peer Systems” KOM – Multimedia Communications Lab 54 In: IEEE Peer-to-Peer Computing '09 (IEEE P2P’09), September 2009.
- 55. Analysis Point and Configuration Distribution SkyEye.KOM distributes the configuration SkyEye.KOM aggregates system statistics up the tree ACK to every message contains: Global view from above New parameter configuration Root has global view and can reach all leafs [µ,σ,σ²,Σ, min, max] Root analyzes and [µ,σ,σ²,Σ, min, max] pushes new configuration down [µ,σ,σ²,Σ, min, max] KOM – Multimedia Communications Lab 55
- 56. Analysis Point and Configuration Distribution SkyEye.KOM distributes the configuration SkyEye.KOM aggregates system statistics up the tree ACK to every message contains: Global view from above New parameter configuration Root has global view [µ,σ,σ²,Σ, and can reach all leafs min, max] + new parameter Root analyzes and configuration pushes new configuration down KOM – Multimedia Communications Lab 56
- 57. Deriving a new Configuration Root is deciding component Metric goals Metrics Analysis Parameter Detects quality violations and Plan Parameters Plans new configuration Configuration spread over SkyEye.KOM Peers adopt locally the new rules Upon violation of a metric Human interaction: manual settings Metric Strict rules: modify param. by x% goal Adaptive rules: Current metric modify param. by (goal-now) * x% Automated rules: Parameters Use machine learning to identify metric-parameter interdependencies Adapt most relevant parameters KOM – Multimedia Communications Lab 57
- 58. Deriving a new Configuration Prevent configuration oscillation Give time for changes to take effect Introduce execution delay Analyze slope of metric history Act only if small, i.e. changes settled Goal Manage the p2p system so that it fulfills our demands on a defined metric set Goal Metric Evaluation in next step Monitoring an overlay (Chord) Set goal intervals: hop count [7;10] Static rules: Adapt finger table size by 10% (down) or 100% (up) KOM – Multimedia Communications Lab 58
- 59. Outline Motivation for Quality of Service On Influencing Quality in P2P Systems Overview on my Solution Management of P2P Systems through Monitoring and Automated Self-Configuration Monitoring in Structured P2P Systems Monitoring System- and Peer-specific Information Evaluation of the Monitoring Solution “SkyEye.KOM” Management of Structured P2P Systems A Self-Configuration Framework for P2P Systems Evaluation of the Self-Configuration Cycle Conclusion KOM – Multimedia Communications Lab 59
- 60. Evaluation of the Self-Configuration Cycle Challenges Self-configuration requires a new paradigm Configurable, monitorable mechanisms / overlays Rare, even overlays typically fixed configured H(„mydata“) = 3107 1008 1622 2011 709 2207 Adapted p2p overlay “Chord” ? Classic DHT, provides req. functionality 611 3485 2906 Adapted to consider new configuration Parametrizable finger table size See: K. Graffi et al., “Monitoring and Management of Structured Peer-to-Peer Systems” KOM – Multimedia Communications Lab 60 In: IEEE Peer-to-Peer Computing '09 (IEEE P2P’09), September 2009.
- 61. Case: Chord, Hop Count, Finger Table Size Parameter: Finger table size Static rule for deriving configuration: Metric: Hop count If hop count too large Metric goal: Hop count interval [7;10] Increase finger table size by 100% If hop count too small Evaluation goal: Decrease finger table size by 10% Show: Adaptation works from both sides Self-configuration reaches and hold goal KOM – Multimedia Communications Lab 61
- 62. Starting with High Hop Count Too large hop count is detected Quick convergence towards goal Finger table size: increase by 100% One iteration: 12 update intervals Initial FT size: 20, at end 80 Quality goal is reached and kept KOM – Multimedia Communications Lab 62
- 63. Starting with Low Hop Count Too small hop count is detected Quick convergence towards goal Finger table size: decrease by 10% One iteration: 12 update intervals Initial FT size: 160, at end 116 Quality goal is reached and kept KOM – Multimedia Communications Lab 63
- 64. Summary on Management of P2P Systems Main question: How to control a p2p system so that it fulfills our demands on a defined metric set? Self-Configuration Framework Uses SkyEye.KOM to monitor the system state and deploy new configuration No additional protocol complexity Extendable for more metrics and parameters Evaluation shows: Overhead is very small (piggybacking parameters in monitoring messages) Preset quality intervals are quickly reached and hold KOM – Multimedia Communications Lab 64
- 65. Outline Motivation for Quality of Service On Influencing Quality in P2P Systems Overview on my Solution Management of P2P Systems through Monitoring and Automated Self-Configuration Monitoring in Structured P2P Systems Monitoring System- and Peer-specific Information Evaluation of the Monitoring Solution “SkyEye.KOM” Management of Structured P2P Systems A Self-Configuration Framework for P2P Systems Evaluation of the Self-Configuration Cycle Conclusion KOM – Multimedia Communications Lab 65
- 66. Summary Management of P2P overlays Reach and hold preset quality intervals Through monitoring and self-configuration Coordinated resource usage Parameterization influences quality metrics Identifying optimization goals needs monitoring Monitoring: SkyEye.KOM Global view on statistics of running system: avg./std./min./max on all metrics Gathering peer-specific information Precise yet cost effective monitoring Self-Configuration Cycle in Chord Automated rule application Preset quality intervals are reached and hold KOM – Multimedia Communications Lab 66
- 67. Current Work and Implications Current work Evaluate monitoring in Kademlia and Pastry Comparative evaluation, including analytical model for SkyEye.KOM Evaluate self-configuration cycle in Kademlia, 3 parameters Test automated rule generation using machine learning Apply monitoring and self-configuration abilities to a example application P2P-based Social Online Network “LifeSocial.KOM” Implications Allows the usage of P2P overlays “off the shelf” For various scenarios / environments Monitoring and quality control P2P as mature IT architecture Interesting for commercial applications Self-configuration framework can include and consider other functional layers For LifeSocial.KOM, see: K. Graffi et al., “A Distributed Platform for Multimedia Online Communities”KOM – Multimedia Communications Lab 67 In: IEEE International Symposium on Multimedia '08 (IEEE ISM’08), September 2009. Visit: www.lifesocial.org
- 68. Thank you for your attention! Questions? KOM – Multimedia Communications Lab 68