2. to approach culture change could be by looking at the related concept
of climate, which describes the shared perceptions of organizational
policies, practices, and procedures, both formal and informal (Reichers
& Schneider, 1990). The differences (or lack of difference) between
the climate and culture concepts have been widely debated both
within organizational theory and safety science (Guldenmund,
2000; Reichers & Schneider, 1990). However, although both con-
cepts are understood as some sort of shared perceptions that are
created over time, culture is generally seen as a more abstract and
stable construct than climate, that more easily lends itself to manip-
ulation (Guldenmund, 2000). In Schein's understanding, organiza-
tional climate is a surface manifestation of the deeper cultural levels
and a reflection of leaders' attempts to embed culture (Schein, 2004).
Thus, climate can be seen as an entrance door to work with culture, as
it is a visible (and more measurable) concept that is tied to the creation
of culture.
Within safety science, Dov Zohar has proposed that safety climate is
formed by the workers' perception of the relative priority of safety
versus efficiency goals in supervisory practices (Zohar, 2000). Theoreti-
cally, this installs supervisory safety practices as a link between safety
climate and culture. Supervisory practices are guided by supervisors'
basic assumptions (culture) and are taken as guiding principles for em-
ployee actions as they are perceived by employees (climate). Of course,
not every supervisory practice is directly guided by basic assumptions,
as many other behavioral influences exist. However, the formation of
climate and culture is not rooted in any single instance of supervisory
practice, but relates to the general pattern of priorities in supervisory
practices over time. Thus, creating a sustained change in supervisory
practices becomes a way to put safety climate and culture change into
practice.
This approach to change is primarily leader-based, as it focuses
on changing supervisory practices, which is in accordance with
Schein's (2004), Zohar (2000, 2002a, 2002b), and Zohar and Luria
(2003) emphasis on the pivotal role of leaders in creating cultural and
climate change. This is not surprising, as management's commitment
to safety is generally acknowledged as a fundamental aspect of success-
ful safety performance (O'dea & Flin, 2001; Rundmo & Hale, 2003;
Simard & Marchand, 1995). However, neither organizational nor cultur-
al change is a prescriptive linear top-down process. Rather it involves
unpredictable complex social processes (Dooley, 1997). It has recently
been suggested to apply insights from complexity theories to safety
(Rosa Antonia, 2011), and although there exist no unified complexity
theory or approach (Horgan, 1995), complex adaptive systems theory de-
livers a comprehensive understanding of organizational change (Dooley,
1996, 1997). Within complex adaptive systems, theory interactions are
seen as the driver of organizational change, which is in agreement with
Zohar's emphasis on the daily interactions between management and
workers as the building blocks of climate change. However, complex
adaptive systems theory states that control over such changes lie in the
organization as a whole and not within any single individual (e.g., the
leader; Dooley, 1996). Complex adaptive systems theory focuses on the
unpredictable and uncontrollable nature of change processes and self-
organization takes center stage in the change process (Dooley, 1996,
1997). Self-organization is seen as a process by which novel and unpre-
dictable order emerges from the interactions between distinctive agents.
Hence, leaders are not in full control of change processes and cannot pre-
dict the outcome of changes. Thus, change cannot be implemented top-
down, but instead emerges out of the pattern of interactions between
the individuals in the organization. However, leaders have the opportuni-
ty to influence the change process at the macro-level by enabling or
restricting the possibilities for individuals to interact, and thereby cata-
lyze, create, or hinder relationships (Marion & Uhl-Bien, 2001).
Hence, by combining theories on organizational culture, (safety)
climate and complex adaptive systems, it is feasible that cultural change
can be created by changing the pattern of interactions between organi-
zational members.
1.3. Health and safety organizations and committees
In many organizations the health and safety organization (HSO) or
committee (HSC) is placed as the pivotal point of organizational safety
efforts and could therefore be the natural breeding ground for safety
culture change. However, as there is no uniform international legislation
regarding the establishment of HSOs or HSCs, it is difficult to compare ex-
periences between countries. Most research on the effectiveness of HSCs
has been conducted in the United States (Milgate, Innes, & O'Loughlin,
2002) and although evidence from there indicate that HSCs tend to
have a positive effect on company safety performance (Parker et al.,
2007; Smitha, Kirk, Oestenstad, Brown, & Lee, 2001), international evi-
dence suggests that HSCs have had difficulties in promoting safety
(Frick & Wren, 2000) and that the creation of HSCs does not have an effect
on injury rates in itself, but depends on the structure (size and composi-
tion), process (participation, involvement), and activities (executive func-
tions and training of committee members) of the committee (Geldart,
Smith, Shannon, & Lohfeld, 2010; Liu et al., 2010; Morse, Goyzueta,
Curry, & Warren, 2008). Likewise, a review of international studies
on the effectiveness of HSCs concludes that fundamental factors for
effective performance include management commitment, communi-
cation, the inclusion of safety on the everyday management agenda,
committee processes (frequency of meetings, size of committee and
problem solving ability), and the involvement of professional experts
(Milgate et al., 2002).
In Denmark the Danish Work Environment law specifies how HSOs
and HSCs are to be structured. At the time of this study companies with
more than five employees were obliged to establish a HSO. The HSO
consisted of a representative of top management and so-called ‘safety-
groups’ made up of an employee-elected safety representative and a
supervisor for each major work area. The safety-groups should handle
the daily safety-issues within their work area. Furthermore, companies
with more than 20 employees were obligated to establish a HSC, as a
subgroup within the HSO, consisting of the representative of top man-
agement and typically two safety representatives and two supervisors
(if a company had less than three safety-groups then the HSC would
equal the HSO). The HSC should meet four times a year to discuss com-
pany safety issues, and two of these meetings should include all mem-
bers of the HSO.
The most common problems with the HSOs in Denmark are their de-
pendence on a few highly committed individuals, a reactive approach,
and a lack of systematic action (Hasle & Langaa Jensen, 2006). At the
same time the HSO often lacks integration within the core activities of
the company (i.e., production), which in turn leads to insufficient man-
agerial attention. This lack of integration might partly be due to the fact
that the creation, structure, and function of the HSO in Denmark is based
on national legislation and not on an assessment by company manage-
ment of how company safety issues are most effectively managed. As
such the HSO is created in parallel to the formal organization of the
company, which is (typically) formed around the production process.
This might push the HSO into a side-car role, where safety issues are de-
liberately disengaged from production issues, because of the existence
of the HSO. This is actually the opposite of the intention of the legisla-
tion, but de facto often the case.
1.4. Aim
The aim of the current study is to test whether the HSO can improve
company safety culture by creating more and better safety-related in-
teractions both within the HSO and between HSO members and the
shop-floor. This is done by starting three developmental processes in
the company aimed at the HSC, the whole HSO, and the safety represen-
tatives, respectively. The hypothesis is that these developmental pro-
cesses will create a more active and visible HSO engaging in more and
better safety-related interaction, which in turn should result in im-
provements in safety culture indicators.
8 K.J. Nielsen / Journal of Safety Research 48 (2014) 7–17
3. 2. Methods
2.1. Study design and participants
The study was based on an action research approach, which sees re-
search as an interactive participatory process between the researcher
and the object under study. It was designed as a quasi-experimental sin-
gle case study with baseline and follow-up measurements 23 months
apart. This was chosen because a flexible design was needed to accom-
modate the study's complex adaptive systems approach to organiza-
tional change. As action research, quasi-experiments and case studies
all allow (and even encourage) the researcher to adapt the study as
the intervention processes develop, they are well suited for a complex
adaptive systems approach (Anderson, Crabtree, Steele, & McDaniel,
2005).
The study took place at a Danish industrial plant producing large
industrial lifts. Besides the approximately 275 workers, the study popu-
lation consisted of the company's five supervisors, the safety manager,
the production manager, and the CEO. The company's HSO consisted
of five safety-groups (employee elected safety representatives teamed
with supervisors), the safety manager, and the production manager.
At baseline the company's HSC consisted of the production manager,
the safety manager, two of the safety representatives, and the company's
building inspector.
2.2. Multi-method approach
The study used a multi-method approach consisting of document
analysis, observations, registration of safety-related interactions, semi-
structured interviews, and a questionnaire.
Semi-structured interviews were performed at baseline and follow-
up with three groups of four employees, all safety representatives, all
supervisors, the safety manager, the production manager, and the
CEO. The employees where randomly selected by the researcher and
the same employees were interviewed at both baseline and follow-up.
The interviews took from 1 to 1 and 1/2 h each and focused on seven
superordinate themes (e.g., knowledge of safety issues, risk behavior,
perception of the HSO, and priority of safety). They were subse-
quently analyzed in Nvivo v.7 software using Template Analysis
(King, 2005). Template analysis is a method where textual data is
coded according to a priori themes (in this case the seven superordinate
themes) that are modified and added to as the researcher reads and inter-
prets the texts.
Questionnaires containing scales on HSO performance and safety
culture were administered to all workers at baseline and at follow-up.
At baseline 248 of 272 workers completed the questionnaire (91.2%).
At follow-up 229 of 283 workers participated (80.9%). Of the 272 workers
at baseline, 227 where still employed at the company at follow-up. Of
these 169 (74.4%) completed the questionnaire both times. The data re-
ported here is from this group, who all were male and at follow-up had
a mean age of 45.6 years (SD = 10.3), and a mean seniority at the
plant of 11.4 years (SD = 8.9). Analysis of the nonparticipants at base-
line showed that they were on average 9.1 years younger (p b .01) and
had 4.2 years less seniority (p b .05) than participants. The participants,
who dropped out during the study period, did not differ from completers.
2.3. Measures of activities of the HSO and HSC
The activities of the HSO and HSC were measured by document anal-
ysis and questionnaire. Written minutes of meetings in the HSC are re-
quired by legislation from compulsory meetings. These were collected
for the three years prior to the study and the two study years. They
were analyzed as a measure of activities and efficiency of the HSC. This
was done by a simple count of number of meetings, the number of issues
resolved, and unique issues dealt with per year and meeting.
The questionnaire contained four scales measuring HSO performance
taken from an early version of the Danish Safety Culture Questionnaire
(Nielsen & Mikkelsen, 2007). ‘Feedback’ from HSO was measured using
four items describing workers perception of HSO's reaction to reported
accidents (alpha1
= .86). Sample item: ‘When we report an accident,
we receive feedback afterwards.’ ‘Safety instruction’ was measured with
three items covering the adequacy of safety training (alpha = .82).
Sample item: ‘I have been shown how to perform my work safely at my
current place of work.’ ‘Involvement of workers’ was measured with a
four item scale covering whether workers perceived that their safety in-
puts were taken seriously by the HSO (alpha = .75). Sample item: ‘My
inputs on safety issues are not considered.’ ‘Commitment of the safety
representative’ was measured with five items (alpha = .93). Sample
item: ‘My safety representative often takes time to discuss safety issues
with me and my co-workers.’
2.4. Measures of safety-related interactions
To map the informal safety-related interactions, all members of the
HSO (the production manager, the supervisors, and the safety represen-
tatives)2
were instructed to register all safety-related interactions that
they participated in for a month three times during the study period:
baseline (BL), midway (MW), and follow-up (FU). A safety-related
interaction was defined as any interaction where safety was in some
way mentioned. So safety did not need to be the main topic of the inter-
action, but could just be touched upon briefly either verbally or non-
verbally (e.g., a gesture telling a worker to put on personal protective
equipment). Every single safety-related interaction had to be registered
on a short questionnaire containing information on date, time, place,
duration, interaction partners, and general content of the interaction.
If a day passed with no safety-related interactions, they only filled out
the date and ticked off a box labeled “No safety-related interactions
today.” If they were absent due to time off or sick leave they ticked off
a box specifying this. By design this method only covered interactions
where the participants were aware of safety issues being discussed,
and does not include interactions where safety implications were un-
known at the time of the interaction.
The response rate was calculated as the number of days where at least
one questionnaire was filled out compared to the number of days where
a questionnaire should have been filled out. At baseline, the response rate
was 96%, midway it was 89%, and at follow-up 98%.
Ninety percent of the registered interactions had only two partici-
pants. To simplify data analysis the remaining interactions were recoded
by splitting them up into dyads. For instance, a single interaction between
a safety representative, a supervisor, and a worker, would be recoded into
three dyads (supervisor–safety representative, supervisor–worker, safety
representative–worker).
2.5. Measures of safety culture
The concept of safety culture is not easy, or perhaps even possible, to
operationalize. The scientific field is abundant with more or less conflict-
ing definitions and understandings (Choudhry et al., 2007; Guldenmund,
2000). The current project uses Schein's understanding of organizational
culture to model safety culture, which means looking at three different
layers of culture (artifacts, espoused values, and basic assumptions). The
two outmost layers were each operationalized using a multi-method
approach combining both quantitative and qualitative data. This was
done because it is not an exact science to measure and understand a
1
All cited alpha values are from the current study.
2
The company's safety manager did also participate in the registration of safety-related
interactions, but the data is not reported here, as he was replaced midway through the
study and the job redefined from a full-time safety manager to a part-time job, that a su-
pervisor had to take care of on top of his supervisor job. So the role was markedly different
from baseline to follow-up and a comparison over time would not be true and fair.
9K.J. Nielsen / Journal of Safety Research 48 (2014) 7–17
4. complex social construct such as (safety) culture, and no single indicator
can capture it precisely. Instead, the approach taken was to establish a
multitude of different indicators, and then try to identify (parts of) culture
by interpreting the pattern of results across indicators.
As shown in Table 1, the artifact level of the (safety) culture was
operationalized as behavioral indicators, structural conditions, docu-
ments, and safety climate. The espoused values were operationalized
as attitudes toward safety and structural conditions. The basic assump-
tions were then deduced at baseline and follow-up based on analysis of
the artifacts and espoused values.
At the artifact level, behavioral indicators were measured by inter-
views and three scales in the questionnaire. ‘Convenience violations’
of the workers was measured with three items (alpha = .86) taken
from the general unsafe behavior factor from the Offshore Safety Ques-
tionnaire (Mearns, Whitaker, & Flin, 2003). ‘Top management commit-
ment to safety’ was measured using a four item scale (alpa = .74).
Sample item: ‘Top management puts productivity over safety.’ ‘Safety
specific transformational leadership’ was measured using a 20 item
scale (Barling, Loughlin, & Kelloway, 2002) describing a single factor
(alpha = .96) (Avolio, Bass, & Jung, 1999; Bass & Riggio, 2006).
Structural conditions were measured using document analysis of
inspection reports and the written minutes of meetings of the HSO.
Documents were measured using direct observation by the researcher
to identify visible safety information, whereas signposting and safety
standards of equipment and machinery were observed by external
bodies such as health and safety advisors and inspectors from the
Work Environment Authorities (copies of company reports from and
correspondence with these external bodies were obtained from the
safety manager by the researcher). Finally, safety climate was measured
using Zohar's (2000) two five item scales covering ‘Supervisor expecta-
tions’ and ‘Supervisor actions’ (alpha = .88 and .87, respectively). Two
items in the latter scale were replaced based on pilot-testing showing
higher factor loadings for modified items.
At the espoused values level, structural conditions and attitudes were
measured through observation and interviews combined with three
scales in the questionnaire tapping into attitudes toward safety. ‘Workers
safety priority’ was measured using three items (alpha = .79). Sample
item: ‘I always follow safety guidelines.’ ‘Safety oversights’ was measured
with three items covering reasons not to bring up safety issues with
supervisors (alpha = .83). Sample item: ‘It is of no use to bring up safety
issues.’ ‘Organizational value of safety’ was a five item scale developed to
measure the perceived importance of safety. It was inspired by safety
motivation scales, especially Neal, Griffin, and Hart's (2000) and modified
to focus on the organizational level (alpha = .89). Sample item: ‘It means
a lot for the company to continuously minimize the risk of accidents and
injuries.’ Furthermore whether there was a feeling of joint responsibility
for safety in the departments was measured with a five item scale called
‘Shared safety responsibility’ (alpha = .72). Two of the items were taken
from Cheyne, Oliver, Tomás, and Cox's (2002) Personal involvement
scale. Sample item: ‘In our department, we help each other to work
safely.’
2.6. Lost time injury rates
In Denmark companies are obliged by law to report injuries that
cause absence from work on the day after the injury to the Working
Environment Authorities. Company injury records were collected from
the official reporting system for the four years prior to the study and
the two study years. Administrative records of total number of hours
worked per month covering the same time period were also collected
and thus lost time injury rates (injuries/million hours worked) could
be calculated for each year.
2.7. Statistical analyses
Paired t-tests performed in SPSS for Windows v. 15.0 were used to
identify changes from baseline to follow-up in the questionnaire scales.
Scale scores were calculated by adding the scores on individual items
and dividing by the number of items in the scale, giving a scale from 1
to 5. All items and scales were coded such that a high score indicated
a good rating.
Poisson regression was used to analyze the development in the
number of safety-related interactions, which gives an incidence rate
ratio (IRR) describing the number of safety-related interactions com-
pared to the number of registered work days. However, using IRR the
three data points are not treated as following a time line, but instead
as three separate and independent data points. A simpler model, that
takes account of the continuous nature of the data, is to model the
changes over all three points using a straight line. Whether or not a
straight line describes the relationship between the data points can be
tested using a Likelihood Ratio test (LR-test). A non-significant LR-test
shows that the linear model fits the data just as well as the model
Table 1
Safety culture indicators and measures.
Cultural layer Indicators Measures
Artifacts Behavioral indicators
Unsafe behavior by the workers Questionnaire
Management commitment to safety Questionnaire
Statements about safety Interview
Structural conditions
Safety standard of equipment and machines Inspection reports
Form and number of formal safety meetings Minutes of meetings
The composition of the HSC Minutes of meetings
Documents
Visible safety information Direct observation
Safety signposting Inspection by health and safety advisor
Inspection reports Inspection by work environment authorities
Safety climate Questionnaire
Espoused values Structural conditions
Formal safety policies and objectives Direct observation
Accident registration and analysis Interviews/observation
The inclusion of safety on the agenda of meetings Interviews/observation
Attitudes
Attitudes toward safety Questionnaire/interviews
Shared safety responsibility Questionnaire/interviews
Economic priority of safety Interviews/observation
Use of external health and safety advisors Interviews/observation
Basic assumptions Identified by analysis of artifacts and espoused values
10 K.J. Nielsen / Journal of Safety Research 48 (2014) 7–17
5. with three individual data points. If this is the case, the Poission regres-
sion gives an IRR that expresses the lines alpha-coefficient that indicates
whether the line describes an increase or decrease in interactions.
STATA v.9.1 was used to calculate IRRs and perform the LR-tests, and
do the trend analysis on lost time injury data.
3. The intervention process
Interventions were focused on creating more and better interactions
involving safety within the company. Only the general framework of
the interventions was planned in advance. This consisted of starting
three processes of development in the company aimed at the HSC, the
whole HSO, and the safety representatives, respectively (see Table 2).
In accordance with complex adaptive system theory, the precise nature
of the interventions was not specified beforehand as they were to devel-
op through the participants self-organization based on the baseline
mapping of the current interaction patterns, supervisory practices, and
the motivation for change.
Baseline data showed that the company performed very poorly
safety-wise and revealed a lack of management commitment to safety.
Safety in general was not an important issue for management or
workers, who had productivity as the dominant top priority. There
were no objectives for safety performance or formal safety policies,
nor were there any systematic preventive efforts. This was in part due
to a very inefficient and passive health and safety organization that
had no knowledge of actual safety performance and did not even re-
solve identified safety issues. For instance, the company had compiled
19 unresolved enforcement notices from the Work Environment
Authorities over the last few years and was regularly penalized for vio-
lations of the work environment law. Likewise an audit by an external
health and safety advisor, just prior to baseline, documented 110
instances of insufficient or lacking safety signposting.
However, baseline data also revealed that there was a strong motiva-
tion to change. Six months earlier, the CEO had been replaced, and the
new CEO was, in his own words, ‘embarrassed by the company's safety
performance.’ This was a very important prerequisite for the project, as
top management commitment is a critical factor for creating change.
Likewise, the production manager, supervisors, and safety representa-
tives all were dissatisfied with the current state of affairs, but they
were unable to create change as they did not know how to do it. So
baseline showed that the necessary motivation to change was present
in the company, and the CEO played an important role in agreeing to
the company's participation in the study, and in expressing a need for
change. However, he was not much involved in the daily safety activi-
ties, so his role was not to create change hands-on, but on a more
general level to show commitment and create the right conditions for
the interventions. In this way the motivation was not a sufficient condi-
tion to create the change, but caused the project's interventions to fall
on fertile ground.
The content of the pre-planned interventions was further specified
on the basis of this baseline evaluation and the motivation for change.
Although the interventions were aimed at different parts of the HSO at
the outset, in their practical implementation they were interrelated as
described below.
3.1. Process focused on HSC
The first general pre-planned intervention was a developmental
process with the HSC that was initiated at baseline. In Denmark, HSCs
are obliged by law to hold formal meetings four times a year. To create
a more active HSO, monthly meetings of the HSC were arranged, exclud-
ing July because of the summer holiday period and the two months
where the whole HSO met. The HSC consisted of the production manag-
er, two safety representatives, and the building inspector. To further im-
prove the quality of the meetings, four new members were appointed:
two supervisors (to increase line management involvement in safety),
an expert consultant from an external health and safety advisor3
(to
increase knowledge of safety issues and how to solve them), and the re-
searcher (primarily in an observatory role). The aim was to create more
efficient meetings, as the HSC was described as boring, inefficient,
and incapable of solving problems at baseline. Recent accidents were
discussed at the meetings, but the company had never analyzed accident
data to guide preventive efforts, as the conviction was that accidents
could be attributed to lack of attention, thoughtlessness, and stupid mis-
takes by workers. This conviction was challenged by the researcher and
the HSC was urged to look for patterns in accidents occurrence and
search for underlying causes, instead of focusing on immediate causes.
Through these discussions, a deeper understanding of accident causation
gradually emerged in the HSC and at the end of the study period specific
preventive measures aimed at root causes were taken after nearly every
accident, and accident analyses were used to initiate safety campaigns.
3.2. HSO-process aimed at feedback and goal setting
The second general intervention was aimed at the HSO and started
two months after baseline. It was based on the four compulsory formal
meetings of the whole HSO during the study. The content of these
meetings was planned by the researcher. The meetings were used to
feedback information on current safety performance. The aim was to
enlighten the HSO and use the information to specify objectives and
goals for safety performance, thereby continuously creating disequilib-
rium due to the discrepancy between the current and the desired state.
Every meeting concluded with all participants formulating specific ac-
tivities to carry out between meetings to fulfill objectives. For instance,
Table 2
Undertaken interventions.
General interventions Specific pre-planned activities Activities based on feedback
Process focused on HSC Monthly meetings of HSC Accident analysis and prevention
Supervisors and health and safety advisor joins HSC Safety campaigns
Weekly safety topics
HSO-process aimed at feedback and goal setting Researcher plans and chairs the two annual meetings
of HSO (four in total during the study period)
Safety visions and objectives
Safety specific bulletin boards
Safety information at works council
Safety information to all workers from CEO
Safety as part of staff meetings
Safety part of production meetings
Column on safety in staff magazine
Focus on supervisors commitment to safety in
day to day interactions with workers
Process with safety representatives Workshop and monthly follow-up afterwards Safety themes
3
Specifically this was a consultant company that the company had been using for years
to handle health and safety issues on a job-to-job basis, and the appointed consultant was
the company's main contact person, with expertise in technical issues.
11K.J. Nielsen / Journal of Safety Research 48 (2014) 7–17
6. the first meeting, two months after baseline, was used to establish four
groups, each of which focused on their own area: (a) information and
communication within and emanating from the HSO; (b) management
commitment to safety; (c) defining clear objectives for safety perfor-
mance; and (d) role clarity within the HSO. On the basis of work in
these groups, the HSO undertook specific activities to increase safety
performance. The HSO also started stating clear goals for safety perfor-
mance every six months, initially primarily by the CEO but later by
consensus in the HSO.
Within six months of the first HSO-meeting, the formal level of infor-
mation regarding safety was heightened on several parameters. First,
safety specific bulletin boards containing minutes of meetings, safety
goals, and safety performance data were established eight different
places in the production facilities. Second, the safety manager started
writing a regular column about safety performance in the house maga-
zine. Third, management commitment to safety became visible as safety
performance became a regular point on the agenda of the meetings of
the works council and was also included in the oral information that
the CEO subsequently gave to all workers about company status. Finally,
safety performance also became a regular point on the agenda at super-
visors' staff meetings and at the two weekly production meetings be-
tween the production manager and supervisors.
On the more informal level, supervisors were encouraged to include
the topic of safety in their day-to-day interactions with workers. To
make this enhanced safety focus manageable for the supervisors, the
production manager elaborated on the safety representatives' idea of
safety themes (see below) and had the safety manager come up with
different weekly topics that could be the focus point for the supervisors.
The production manager then briefly introduced the safety theme of the
week for the supervisors each week and handed out a piece of paper
giving a brief introduction to the topic (e.g., the rules regarding use of
personal protective equipment).
3.3. Process with safety representatives
The third general intervention was aimed at the safety representa-
tives' commitment to safety and was initiated six months after baseline.
At baseline the safety representatives described that there was no unity
in the group and how frustrating it was that management did not prior-
itize safety. A workshop addressing these issues was arranged for the
safety representatives. It started with the safety representatives describ-
ing what a good safety representative should be, followed by a discus-
sion of data from baseline regarding workers perception of the safety
representatives, and ending with them setting personal goals for future
activities. A common theme in the personal goals was to get better at
getting supervisors committed to safety issues. The progress on the
personal goals was subsequently discussed at their regular monthly
meetings with the safety manager, which also was attended by the re-
searcher in the study period. Progress was generally slow and the
frustration toward supervisors continued. To break the deadlock, safety
representatives were urged by the researcher to be more proactive, and
take the initiative to safety activities instead of waiting (in vain) on su-
pervisors' activities. This gave birth to the idea of safety themes, where a
specific safety issue (e.g., the use of personal protective equipment),
was a common focus area for all safety representatives for a period of
time. The idea was that a common theme would help the safety repre-
sentatives get into step and make it easier to get supervisors to partici-
pate. When this activity was presented to the HSC it was taken over by
the production manager as described above.
3.4. Contextual factors of importance for the intervention process
When doing intervention research in real world organizations over a
prolonged period of time, it is often the case that the outcome is influ-
enced by (changes in) contextual factors. The single-case study design
used in this study does not make it possible to statistically control for
such influences. Instead the bias that this causes needs to be considered
when interpreting the results. Two contextual factors are especially im-
portant to consider in the present study (see Table 3).
The first factor was the economic boom that took place in Denmark
during the study years (2005–07). The company usually had to dismiss
workers in the fall as sales slowed down, then rehire people in the
springtime when sales were high. However, this was not the case during
the study period, as the company experienced historically good sales
and generally could not keep up with demands. Although the company
constantly tried to hire new people and the existing workforce worked
overtime, the company just fell further and further behind production
schedules for the better part of the study period. This had both negative
and positive impacts on safety. As the production pressure was high and
constantly increasing, both management and workers were sometimes
inclined to lower the priority of safety. This issue surfaced in intervention
activities, as it arose in the discussions at meetings and workshops, and
also in the more informal conversations with managers and workers dur-
ing the study period. On the positive side, the increased sales meant that
the company completed a financial turnaround and started making
money, and therefore it was easier to find the resources to invest in safety.
The second factor of importance was changes in key personnel.
As mentioned earlier there was a new CEO in the company, but this
was not the only change. The original contact to the company was
established by the researcher, who planned the project with the
company's safety manager. However, the safety manager was not work-
ing full-time as a safety manager, as his primary job function was in the
technical department. Just prior to the study start, the safety manager
resigned from the position as he felt that it would take more than a
part-time safety manager to handle the company's safety. The CEO in-
stead promoted an active safety representative to full-time safety
manager, thus putting more resources into safety. However, one year
later, in the middle of the study, the new safety manager was again de-
moted by the CEO. This was done as the production manager did not feel
that the safety manager had the necessary administrative competences
to do the job and develop the function. At the same time the CEO
wanted safety to be more integrated with production and line manage-
ment, and therefore appointed a supervisor as part-time safety manag-
er. The consequences of these changes were again both positive and
negative. Of course the full-time safety manager appointed at the start
of the project had a lot more time to deal with safety issues than the
part-time safety manager he succeeded, however he was still in some
Table 3
Contextual factors of importance to the development.
Factor Consequence Timing
Economic boom
Increased production
pressure
Less focus on safety During study period
Financial turnaround Increased resources for safety During study period
Changes in key personnel
New CEO More focus on safety Six months prior to
baseline
Replacement of safety
manager (1)
More time for safety
No financial or managerial impact
One month prior to
baseline
Replacement of safety
manager (2)
Less time for safety
Financial and managerial impact
Fifteen months after
baseline
Table 4
Formal meetings of the HSC and issues discussed.
Before the project Study period
Year-3 Year-2 Year-1 Year1 Year2
Formal meetings 4 4 3 8 9
Total unique issues 23 12 18 62 115
Unique issues per meeting 9.3 5.5 9.0 20.8 40.3
Resolved issues 2 2 2 32 50
12 K.J. Nielsen / Journal of Safety Research 48 (2014) 7–17
7. ways perceived as a safety representative by company management,
and was not given any financial or managerial authority. When the su-
pervisor was appointed as part-time safety manager, the consequences
were less time for dealing with safety issues, but more financial and
managerial impact.
4. Results
4.1. Activities of the HSC and HSO
The data showed a doubling of formal meetings of the HSC in the
two project years compared to the three previous years (see Table 4).
This was of course due to the pre-planned intervention of monthly
meetings. Of more interest was the increase in unique issues on the
agenda. This increased from approximately 20 a year in the years prior
to the study to 62 the first year and 115 the second study year. This in-
crease cannot solely be ascribed to more meetings, as the mean number
of unique issues per meeting quadrupled from approximately 10 to 40.
Even more remarkable was the increase in resolved issues, where only
two issues were resolved per year prior to the study, while 32 and 50 is-
sues were solved in the two project years. Some of the issues resolved
within the first six months of the study were the 19 enforcement notices
from the Work Environment Authorities.
In the questionnaire data, all the HSO performance scales show
significant improvements from baseline to follow-up (see Table 5).
The workers report getting more feedback from the HSO, feeling more
involved in safety, improved safety instruction, and perceiving the safe-
ty representative as more committed.
4.2. Safety-related interactions
The registration of safety-related interactions showed that the
production manager did not have many safety related interactions at
baseline. During the baseline month he only registered one interaction
with workers and none with supervisors or safety representatives (see
Table 6). This pattern did not change significantly over time, although
Table 6 shows that he began having safety-related interactions with su-
pervisors during the study period, and at follow-up discussed safety-
related topics approximately once a week with supervisors.
There is an increase in the number of interactions between supervi-
sors and safety representatives from baseline to midway (IRR = 2.35,
p = .04) and further from midway to follow-up (IRR = 1.20, ns).
The number of interactions almost triples from baseline to follow-up
(IRR = 2.82, p = .01), however, as the LR-test is non-significant, the
simplest model is a straight line showing a 58% increase in interactions
from measurement to measurement (IRR = 1.58, p = .01).
From baseline to follow-up, supervisors increased the number of
safety-related interactions with workers (IRR = 1.91, p b .01), which
primarily took place from midway to follow-up (IRR = 1.66, p = .02).
The best description of the data is a straight line showing a 41% increase
from measurement to measurement (IRR = 1.41, p b .01). The safety
representatives also had more safety-related interactions with workers
from measurement to measurement but this increase was not statistical-
ly significant (IRR = 1.17, ns).
4.3. Safety culture
At the artifact level there is an overall improvement in the behavioral
indicators. Questionnaire data show a small non-significant improve-
ment in ‘Convenience violations’ by the workers, whereas there are sig-
nificant improvements in both ‘Top management commitment to safety’
and ‘Safety specific transformational leadership’ (See Table 7). At the
same time interviews showed that safety issues were addressed a lot
more by management when giving formal statements (e.g., information
meetings by the CEO and supervisors). Concerning the structural condi-
tions, the inspection reports from the Work Environment Authorities
showed that the enforcement notices that the company had at baseline
regarding machinery not being up to code, had all been resolved and
no new enforcement notices had been given. Likewise the composition
of the HSC and the form and number of formal meetings had changed
(see Table 4). Looking at the different types of documents, safety infor-
mation was made available to all through the eight new bulletin boards
and both safety signposting and all the problems noted by the Work
Environment Authorities were up to code by follow-up. Finally, both
safety climate scales showed improvements, although only ‘Supervisor
actions’ reached statistical significance.
At the espoused values level the structural conditions changed as
safety objectives were stated by the HSO during the study period and
a formal safety policy was being formulated at follow-up. Also, accident
analysis and registration were now used by the HSO to guide preventive
efforts and plan campaigns, and safety ended up being a fixed point on
the agenda of the works council and information meetings. Three of the
four scales in the questionnaire addressing attitudes showed statistical-
ly significant improvements (see Table 7). There was no increase in
workers' feeling of shared safety responsibility in the departments, but
at the same time, the role of safety manager was changed from a staff-
function at baseline to a part of the line-management at follow-up, indi-
cating safety becoming more of a managerial responsibility. Interviews
with supervisors indicated that the economical prioritization of safety
was far higher at follow-up than baseline. Supervisors stated that at
Table 6
Safety-related interactions.
No of interactions Straight line IRR
BL MW FU LR IRR BL-MW MW-FU BL-FU
Internally in the HSO
Production manager–supervisors 0 3 5 – – – 1.55 –
Production manager–safety rep. 0 0 1 – – – – –
Supervisors–safety rep. 8 18 24 0.28 1.58⁎ 2.35⁎ 1.20 2.82⁎
With workers
Production manager–workers 1 0 0 – – – – –
Supervisors–workers 31 34 63 0.36 1.41⁎⁎ 1.15 1.66⁎ 1.91⁎⁎
Safety representatives–workers 37 51 60 0.49 1.17 1.03 1.31 1.35
⁎ p b .05,
⁎⁎ p b .01.
Table 5
Questionnaire measures of HSO performance.
N Baseline Follow-up Diff BL-FU
HSO performance
Feedback 158 2.83 3.16 0.33⁎⁎
Involvement of workers 160 3.05 3.22 0.17⁎⁎
Safety instruction 149 2.71 3.01 0.30⁎⁎
Commitment of the safety representative 156 3.40 3.56 0.16⁎
All scores are observed means. Scale 1–5, 5 best.
⁎ p b .05,
⁎⁎ p b .01.
13K.J. Nielsen / Journal of Safety Research 48 (2014) 7–17
8. baseline there was no money for safety, but at follow-up it was seen as a
shortcut to getting problems fixed, if it could be labeled as a safety prob-
lem. Interviews also indicated a different approach to external health
and safety advisors, who at baseline were seen as a nuisance and linked
with confrontations and control. At follow-up they were still seen as
performing a controlling function, but also as necessary sparring part-
ners in the safety effort. The development in the different safety culture
indicators across measures is summarized in Table 8.
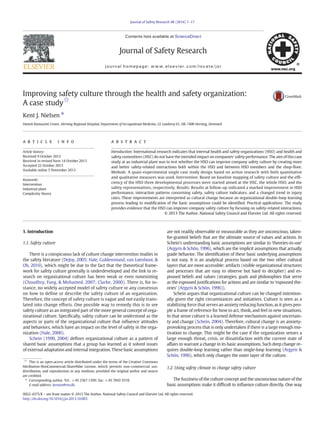
4.4. Lost time injury rates
Sixteen lost time injuries were reported in the first study year, while
12 were reported the second year, compared to 18 the year prior to the
study. The development in lost time injury rates during the study period
and the previous four years is shown in Fig. 1. Trend analysis showed a
significant increase in the lost time injury rate (IRR = 1.27, p N .01) dur-
ing the four years prior to the study, while there is a non-significant de-
crease in the rate during the intervention period (IRR = 0.82, p = 0.10).
5. Discussion
The aim of the current project was to test an HSO-approach focused
on improving safety culture by improving safety-related interactions.
The interventions aimed at improving safety-related interactions by
creating more and better interactions, both on the formal (e.g., creating
more meetings of the HSC, involving relevant persons) and informal level
(e.g., focus on safety in supervisors' daily interactions with workers).
5.1. HSO performance
At the formal level, the results from the minutes of the meetings of
the HSC (Table 4) are indicative of a more efficient HSC, which was
able to resolve safety issues. This is in line with Morse et al.'s (2008) re-
sults that effective HSCs review a larger number of complaints and sug-
gestions. In the follow-up interviews this development was to a large
degree ascribed to the inclusion of supervisors and the health and safety
advisor in the HSC, as well as the frequent meetings. At baseline the HSC
did not know how to solve identified safety issues, but after the inclu-
sion, the health and safety advisor was able to recommend solutions
and thereby get the HSC to take action. Furthermore problem solving
was far easier as supervisors, who often were the ones responsible for
the practical implementation and follow-through, also were present in
the HSC. Questionnaire data on perceived HSO performance (Table 5)
strengthen this interpretation, as marked improvements were seen in
every area. This development is, as would be expected, based on interna-
tional evidence that suggests that changes in the size, composition, pro-
cess and activities of HSC lead to better safety performance (Geldart
et al., 2010; Liu et al., 2010; Milgate et al., 2002; Morse et al., 2008).
5.2. Changes in interaction patterns
At the informal level the registration of safety-related interactions
(Table 6) showed an increasing number of interactions during the
study period, within the HSO and between supervisors and workers.
This might indicate that more safety related interactions were created
as a result of the interventions. However, two other explanations for
this increase might also be plausible. First of all, the registration of inter-
actions only covered interactions where the participants were aware of
safety issues being discussed. If the participants became more aware of
safety issues during the intervention process, the increase in safety-
related interactions might be an indicator of increased safety awareness
and not increased interactions (i.e., there was no change in interactions,
only the participants' perception of the interactions changed). Secondly,
the participants might deliberately have engaged in more safety related
interactions during the registration period, because they were aware of
the registration taking place (i.e., a type of test-effect). However, in the
Table 8
Overall development in safety culture indicators across measures from baseline to follow-
up.
Cultural layer Indicators Change
Artifacts Behavioral indicators
Unsafe behavior by the workers Unchanged
Management commitment to safety Higher
Overall safety orientation Higher
Structural conditions
Safety standard of equipment and machines Higher
Form and number of formal safety meetings More meetings
The composition of the HSC Improved
Documents
Visible safety information Bulletin boards
Safety signposting Up to code
Inspection reports Up to code
Safety climate Higher
Espoused
values
Structural conditions
Formal safety policies and objectives Established
Accident registration and analysis Used for prevention
The inclusion of safety on the agenda of
meetings
Safety part of
meetings
Attitudes
Attitudes toward safety Higher
Shared safety responsibility Unchanged
Economic priority of safety Higher
Use of external health and safety advisors More positive
18,6
26,1
30,8
39,9
36,0
26,4
18,6
26,1
30,8
39,9
36,0
26,4
0
5
10
15
20
25
30
35
40
45
Year-4 Year-3 Year-2 Year-1 Year 1 Year 2
Fig. 1. Development in lost time injury rates during the study period and the previous
years (injuries/million hours).
Table 7
Questionnaire measures of artifacts and espoused values.
N Baseline Follow-up Diff
BL-FU
Artifacts
Behavioral indicators
Convenience violations 166 3.12 3.19 0.07
Top management commitment to safety 165 2.91 3.09 0.19⁎⁎
Safety specific transformational leadership 123 2.28 2.44 0.16⁎
Safety climate
Supervisor expectations 166 3.31 3.41 0.11
Supervisor actions 163 2.74 2.89 0.15⁎⁎
Espoused values
Attitudes
Workers safety priority 164 3.79 3.92 0.12⁎
Safety oversights 166 3.35 3.55 0.20⁎⁎
Organizational value of safety 164 3.45 3.75 0.30⁎⁎
Shared safety responsibility 165 3.71 3.74 0.02
All scores are observed means. Scale 1–5, 5 best.
⁎ p b .05,
⁎⁎ p b .01.
14 K.J. Nielsen / Journal of Safety Research 48 (2014) 7–17
9. follow-up interviews, it was clearly indicated that safety had become a
topic addressed by top management in their interactions with supervi-
sors, which also was evident from the use of weekly safety topics. Super-
visors, safety representatives, and workers (who were not part of the
registration and thus not affected by any test-effect) also all expressed
having more safety-related interactions than before. So although other
interpretations are possible, the most plausible explanation seems to
be that there in fact was an increase in safety-related interactions during
the study period.
At the same time the more efficient HSC contributed to the safety-
related interactions being more fruitful, as the ability to identify and
handle safety issues was increased. Put together, these results indicate
that more and better safety-related interactions were created during
the project period.
5.3. Changes in safety culture indicators
According to the study's culture change strategy, creating more and
better safety-related interactions would stimulate self-organization
from which new attitudes and cultural patterns would emerge. In
Schein's understanding culture change equals changes in basic assump-
tions (Schein, 1990). However, such changes are not easily identified, as
the basic assumptions are unconscious and not readily accessible. The
changes have to be derived through an analysis of the outer layers of
culture. So to identify cultural change we need to analyze the artifacts
and espoused values at baseline and follow-up, respectively.
At baseline the artifact level showed signs of low safety commit-
ment. Behavior was generally unsafe, with low worker and manage-
ment commitment as indicated by interviews and questionnaire data.
At the structural level the company was not performing very well either.
Several of the Work Environment Authorities enforcement notices
concerned machine safety such as insufficient safeguarding or missing
emergency stops. Furthermore, the meetings of the HSO and the HSC
were unstructured and inefficient as was the composition of the HSC.
Likewise, the espoused values showed low safety priority. There were
no objectives for safety performance or formal safety policies, no accident
analysis, and safety was only discussed on the meetings of the HSC. This
reflected the general attitudes to safety from management and workers,
where no or very few resources were spent on safety and external advi-
sors were unwanted.
At follow-up a lot of things had changed and both the artifacts and
the espoused values point to safety becoming more salient. Supervisors
and the CEO now talked about safety at staff meetings, and questionnaire
data showed improvements in the safety commitment of management
and safety representatives. At the document level, safety information be-
came much more visible because of new initiatives such as the safety
managers column and the safety specific bulletin boards in the produc-
tion areas. At the same time, safety signing improved markedly, as the
company reacted on the aforementioned written report pointing at 110
different places with insufficient or lacking safety signposting. At baseline
the unresolved enforcement notices and the report on insufficient or
lacking safety signposting were documents pointing at a company with
low safety performance. All these issues were resolved at follow-up,
and there no longer existed any reports, enforcement notices, or other
documents testifying to low safety performance. On the contrary, when
the Work Environment Authorities did a surprise work environment
inspection midway through the project, as part of a national screening
of all Danish enterprises, the company's rating changed from the worst
to the best category, indicating a marked improvement in performance.
Company lost time injury data also showed a changed trend in the
intervention period compared to the four years prior to the study.
Although the data showed a decrease in injury rates, this was not statis-
tically significant, which is mainly due to lack of statistical power. As a
general rule, such injury statistics have to be interpreted with caution
though, as underreporting is always an issue. However, taken together
with the development in the safety culture indicators mentioned
above, it seems plausible that the changed trend in injuries is genuine.
5.4. Did the basic assumptions change?
The results indicate changes at the level of artifacts and espoused
values. However, changes in artifacts and espoused values are not
sufficient to conclude that the culture has changed. They might only in-
dicate changes in surface manifestations such as behavior, climate, or
policies. According to Schein (1990) changes in culture can only be ver-
ified by identifying changes in the basic assumptions. These are changed
through double-loop learning, which is defined as a strategy where the
governing values behind actions are questioned and changed when
actions fails, and stands in contrast to single-loop learning where new
actions are chosen within the same governing values (Argyris, 2004;
Argyris & Schön, 1996). If we look at the changes from baseline to
follow-up, they could be taken to indicate that double-loop learning
has taken place. At baseline the pattern of results across artifacts and
espoused values reflected that management was not committed to safe-
ty and no or very few resources were used on safety or external assis-
tance, although safety problems were clearly evident and directly
observable for anyone (e.g., fines from Work Environment Authorities).
This point at the basic assumption being that safety is to be ignored (as
productivity is more important).
However, at the start of the study period, it was not possible to ig-
nore safety issues any longer, as the accumulated enforcement notices
and fines forced the company to spend resources on safety. What is in-
teresting here, is how this cultural conflict (safety ignored Nb not able to
ignore safety) was handled. If it was handled using single-loop learning
(thus not questioning the governing value of ignoring safety), the com-
pany could have paid external consultants to come and fix the specific
problems that caused the enforcement notices and fines. Afterwards
the company would then be able to go back to ignoring safety. However,
that was not what happened. Instead the company questioned the
governing value of ignoring safety. They used resources to identify the
basic causes of the company's safety issues. The company then addressed
these issues and tried to improve management commitment to safety,
the economical priority of safety, and safety knowledge and skills. This
is indicative of double-loop learning, where the basic assumptions are
challenged and changed. An analysis of artifacts and espoused values at
follow-up reflects a new state of affairs. At follow-up management was
(more) committed to safety, safety issues were dealt with in a competent
manner, and resources were spent on safety issues and external advisors.
This is indicative of a new basic assumption that safety warrants the
necessary priority to be handled in a proper way (while still recognizing
that production is the most important thing).
Thus the cultural analysis can be interpreted as showing double-loop
learning that has caused changes in the basic assumption. However,
does that mean that the culture changed? Double-loop learning is
necessary for cultural change, but does not guarantee cultural change
in itself. A close inspection reveals that not all the collected data sup-
ports a cultural change conclusion. For instance questionnaire data
showed no change in convenience violations from workers, who also
did not feel a greater shared responsibility for safety in their depart-
ment. Likewise, productivity stayed the top priority for the company
all through the project. So was there an improvement in safety culture?
Well, first of all it is important to recognize that culture is not necessarily
homogeneous and unambiguous — especially in times of change. So it is
not reasonable to expect the data to be clear-cut. Secondly, when deal-
ing with a complex construct such as (safety) culture it is also not feasi-
ble to expect to find one single indicator to measure change with. There
is no smoking gun. Instead a multi-method approach allows for inter-
pretations of the pattern in the data. And it is by looking at the pattern
in the data that cultural change can be rendered probable. It is true
that we do not see changes in convenience violations and shared safety
responsibility, but if we look at other parts of the data, there was an
15K.J. Nielsen / Journal of Safety Research 48 (2014) 7–17
10. increase in workers' safety priority and both supervisors and safety rep-
resentatives indicated in the interviews that they saw the workers as
more committed to safety at follow-up. Furthermore, the question is
whether safety needs to be more important than production before a
change can be identified. A change from safety being ignored to safety
being seen as the second or third priority in the company is still an
improvement.
Lastly the contextual factors have to be taken into consideration. The
identified development took place during a period when the company
experienced a historically high production pressure and had replace-
ments and redefinitions of roles among key safety personnel. The
fact that an improvement in the priority of safety could be identified
under these far from perfect conditions indicates that the interventions
have been quite powerful and that the commitment from the involved
parties has been quite high.
Overall the pattern of the results supports an interpretation stating
that the changes in the safety culture indicators are indicative of actual
safety culture changes, as a double loop learning process leading to
changes in basic assumptions could be identified.
5.5. Limitations and contributions of the study
The study has several limitations. First of all, an intervention strategy
based on complex adaptive systems theory, which emphasizes self-
organization, unpredictability, and uncontrollability, does not easily fit
into common scientific standards of pre-specification and control of
interventions. However, in organizational research adaptive research
strategies are often warranted to accommodate the real world changes
in organizational life. Furthermore, the intervention strategy in the
current study was continuously developed based on the collected data
and in interplay with the participants, which is a well established inter-
vention method within action research. The detailed description in part
3 makes the intervention process transparent for anyone wanting to
judge the feasibility of the intervention.
Secondly, the multifaceted nature of the interventions also means
that it is impossible to isolate the effect of the single elements in the
intervention. The intervention consisted of three interrelated general
developmental processes, which as indicated in Table 2 ended up in a
lot of different activities being undertaken. It is not possible to deter-
mine which activities were effective and which were not. However, it
might be questionable whether it is at all of interest to isolate the effects
of single interventions. Complex adaptive systems theory sees organiza-
tional development as the result of numerous small events rather than a
few large critical events (Dooley, 2002), and the complexity of (safety)
culture change makes it improbable to find any effect of one single
simple intervention. This is substantiated by reviews of the safety inter-
vention literature, which concludes that multifaceted efforts are the
most effective (Guastello, 1993; Lund & Aarø, 2004).
Thirdly, the quasi-experimental and single-case design of the study
makes it impossible to infer causality. So even if the interventions are per-
formed satisfactorily it is not possible to infer that the cultural changes
happened because of the interventions. The changes might have hap-
pened due to other factors not measured in or related to the study. Al-
though the study incorporated many different factors the conclusions
need to be substantiated by further research with designs better suited
to establish causality. However, the in-depth nature of this study makes
it very well suited to be used as a starting point for further research.
Finally, the unconscious nature of the basic assumptions makes it
hard to verify whether cultural change has taken place at all. It becomes
a matter of interpretation based on a heterogeneous pattern of results,
which is not an exact and objective science, but instead is a matter of
theoretical and analytical point of view. This is a common problem
with all (safety) culture studies, due to the lack of common definitions
and understanding of the culture phenomenon. The current study has
tried to overcome this, to some extent, by building on well-established
theories from organizational and safety science.
Although the study has these limitations it is felt that it can still be a
valuable contribution to the scientific literature on safety culture inter-
ventions, as this literature is very sparse. The primary contributions of
this study are both empirical and theoretical. The study's approach to
change was primarily leader-based grounded in Schein's and Zohar's
emphasis on leaders' pivotal role in creating cultural and climate
change. The link between safety climate and safety outcomes is well-
established, but the relationship to other constructs, such as culture, is
unclear (Zohar, 2010). Zohar has previously shown that leader-based
interventions aimed at safety-oriented interactions can create improve-
ments in safety climate and workers' safety behavior, that continues be-
yond the post-intervention period (Zohar & Luria, 2003). The current
study adds to this both empirically and theoretically, by linking such
sustained changes in interaction patterns to culture change, thereby
attempting to bridge the climate–culture gap. Furthermore, the notion
of transformational leadership is underlying both Schein's and Zohar's
understanding of organizational change and although both Schein
(2004) and proponents of transformational leadership (Bass & Riggio,
2006) emphasize the pivotal role of leaders in creating culture change,
there is a lack of empirical evidence supporting this notion — especially
within safety science. The current study bears some evidence for this re-
lationship, as marked improvements in top management's commit-
ment to safety and the safety-specific transformational leadership of
supervisors are linked to culture change.
6. Conclusion
The current project adds to the safety literature, not only in provid-
ing a rare case study on safety culture intervention, but also by showing
some evidence for the link between leadership, safety climate, and cul-
ture. The study shows that the HSO can improve company safety culture
by creating more and better safety-related interactions both within
the HSO and between HSO members and the shop-floor. Results indicat-
ed a marked improvement in HSO performance, interaction patterns
concerning safety, safety culture indicators, and a changed trend in injury
rates. These improvements are interpreted as cultural change because an
organizational double-loop learning process leading to modification of
the basic assumptions could be identified. However, due to the single-
case design of the study it is not possible to infer causality.
Acknowledgments
The project was financed by the Danish Working Environment Re-
search Fund, project 2-2004-03.
References
Anderson, R. A., Crabtree, B. F., Steele, D. J., & McDaniel, R. R., Jr. (2005). Case study
research: The view from complexity science. Qualitative Health Research, 15, 669–685.
Argyris, C. (2004). Double-loop learning and organizational change. Dynamics of organiza-
tional change and learning (pp. 389–402). : John Wiley & Sons Ltd.
Argyris, C., & Schön, D. (1996). Organizational learning II. Theory, method, and practice.
Reading, MA: Addison-Wesley.
Avolio, B. J., Bass, B.M., & Jung, D. I. (1999). Re-examining the components of transforma-
tional and transactional leadership using the multifactor leadership questionnaire.
Journal of Occupational & Organizational Psychology, 72, 441–462.
Barling, J., Loughlin, C., & Kelloway, E. K. (2002). Development and test of a model linking
safety-specific transformational leadership and occupational safety. Journal of Applied
Psychology, 87, 488–496.
Bass, B.M., & Riggio, R. E. (2006). Transformational leadership. Mahwah, NJ: Lawrence
Erlbaum Associates, Inc.
Cheyne, A., Oliver, A., Tomás, J. M., & Cox, S. (2002). The architecture of employee atti-
tudes to safety in the manufacturing sector. Personnel Review, 31, 649–670.
Choudhry, R. M., Fang, D., & Mohamed, S. (2007). The nature of safety culture: A survey of
the state-of-the-art. Safety Science, 45, 993–1012.
Clarke, S. (2000). Safety culture: Under-specified and overrated? International Journal of
Management Reviews, 2, 65–90.
DeJoy, D.M. (2005). Behavior change versus culture change: Divergent approaches to
managing workplace safety. Safety Science, 43, 105–129.
Dooley, K. J. (1996). Complex adaptive systems: A nominal definition. The Chaos Network,
8, 2–3.
16 K.J. Nielsen / Journal of Safety Research 48 (2014) 7–17
11. Dooley, K. J. (1997). A complex adaptive systems model of organization change. Nonlinear
Dynamics, Psychology, & Life Sciences, 1, 69–97.
Dooley, K. J. (2002). Organizational complexity. In M. Warner (Ed.), International encyclo-
pedia of business and management (pp. 5013–5022). London: Thompson Learning.
Frick, K., & Wren, J. (2000). Reviewing occupational safety and health management. In K.
Frick, P. L. Jensen, & T. Wilthagen (Eds.), Systematic occupational health and safety
management — Perspectives on an international development (pp. 17–42). Oxford:
Pergamon.
Geldart, S., Smith, C. A., Shannon, H. S., & Lohfeld, L. (2010). Organizational practices and
workplace health and safety: A cross-sectional study in manufacturing companies.
Safety Science, 48, 562–569.
Guastello, S. J. (1993). Do we really know how well our occupational accident prevention
programs work? Safety Science, 16, 445–463.
Guldenmund, F. W. (2000). The nature of safety culture: A review of theory and research.
Safety Science, 34, 215–257.
Hale, A.R. (2000). Culture's confusions. Safety Science, 34, 1–14.
Hale, A.R., Guldenmund, F. W., van Loenhout, P. L. C. H., & Oh, J. I. H. (2010). Evaluating
safety management and culture interventions to improve safety: Effective interven-
tion strategies. Safety Science, 48, 1026–1035.
Hasle, P., & Langaa Jensen, P. (2006). Changing the internal health and safety organization
through organizational learning and change management: Research articles. Human
Factors and Ergonomics in Manufacturing, 16, 269–284.
Horgan, J. (1995). From complexity to perplexity. Scientific American, 272, 104.
King, N. (2005). Using templates in the thematic analysis of text. In C. Cassell, & G. Symon
(Eds.), Essential guide to qualitative methods in organizational research (pp. 256–270).
London: Sage.
Liu, H., Burns, R. M., Schaefer, A. G., Ruder, T., Nelson, C., Haviland, A.M., Wayne, B., Gray,
W. B., & Mendeloff, J. (2010). The Pennsylvania certified safety committee program:
An evaluation of participation and effects on work injury rates. American Journal of
Industrial Medicine, 53, 780–791.
Lund, J., & Aarø, L. E. (2004). Accident prevention. Presentation of a model placing empha-
sis on human, structural and cultural factors. Safety Science, 42, 271–324.
Marion, R., & Uhl-Bien, M. (2001). Leadership in complex organizations. Leadership
Quarterly, 12, 389–418.
Mearns, K., Whitaker, S. M., & Flin, R. (2003). Safety climate, safety management practice
and safety performance in offshore environments. Safety Science, 41, 641–680.
Milgate, N., Innes, E., & O'Loughlin, K. (2002). Examining the effectiveness of health and
safety committees and representatives: A review. Work: A Journal of Prevention,
Assessment and Rehabilitation, 19, 281–290.
Morse, T., Goyzueta, J., Curry, L., & Warren, N. (2008). Characteristics of effective job
health and safety committees. New Solutions, 18, 441–457.
Neal, A., Griffin, M.A., & Hart, P.M. (2000). The impact of organizational climate on safety
climate and individual behavior. Safety Science, 34, 99–109.
Nielsen, K. J., & Mikkelsen, K. L. (2007). Predictive factors for self-reported occupational
injuries at 3 manufacturing plants. Safety Science Monitor, 11.
O'dea, A., & Flin, R. (2001). Site managers and safety leadership in the offshore oil and gas
industry. Safety Science, 37, 39–57.
Parker, D., Brosseau, L., Samant, Y., Pan, W., Xi, M., & Haugan, D. (2007). A comparison of
the perceptions and beliefs of workers and owners with regard to workplace safety in
small metal fabrication businesses. American Journal of Industrial Medicine, 50,
999–1009.
Reichers, A. E., & Schneider, B. (1990). Climate and culture: An evolution of constructs. In
B. Schneider (Ed.), Organizational climate and culture (pp. 5–39). San Francisco:
Jossey-Bass.
Rosa Antonia, C. (2011). Complexity and safety. Journal of Safety Research, 42, 293–300.
Rundmo, T., & Hale, A.R. (2003). Managers' attitudes towards safety and accident preven-
tion. Safety Science, 41, 557–574.
Schein, E. H. (1990). Organizational culture. American Psychologist, 45, 109–119.
Schein, E. H. (2004). Organizational culture and leadership (3rd ed.)San Francisco:
Jossey-Bass.
Simard, M., & Marchand, A. (1995). A multilevel analysis of organisational factors related
to the taking of safety initiatives by work groups. Safety Science, 21, 113–129.
Smitha, M. W., Kirk, K. A., Oestenstad, K. R., Brown, K. C., & Lee, S. D. (2001). Effect of state
workplace safety laws on occupational injury rates. Journal of Occupational and
Environmental Medicine, 43.
Zohar, D. (2000). A group-level model of safety climate: Testing the effect of group climate
on microaccidents in manufacturing jobs. Journal of Applied Psychology, 85, 587–596.
Zohar, D. (2002a). Modifying supervisory practices to improve subunit safety: A
leadership-based intervention model. Journal of Applied Psychology, 87, 156–163.
Zohar, D. (2002b). The effects of leadership dimensions, safety climate, and assigned
priorities on minor injuries in work groups. Journal of Organizational Behavior,
23, 75–92.
Zohar, D. (2010). Thirty years of safety climate research: Reflections and future directions.
Accident Analysis & Prevention, 42, 1517–1522.
Zohar, D., & Luria, G. (2003). The use of supervisory practices as leverage to improve safe-
ty behavior: A cross-level intervention model. Journal of Safety Research, 34, 567–577.
Kent Nielsen (PhD-2008, psychologist, deputy head of department) works in the Depart-
ment of Occupational Medicine at Herning Regional Hospital, Denmark. He is actively in-
volved in the fields of safety intervention research, the measuring and managing of safety
climate and injury epidemiology.
17K.J. Nielsen / Journal of Safety Research 48 (2014) 7–17