Keppel Ltd. 1Q 2024 Business Update Presentation Slides
Il&fs transportation networks ltd q2 fy12 result update
1. K E Y N O T E
INSTITUTIONAL RESEARCH
IL&FS Transportation Networks Ltd.
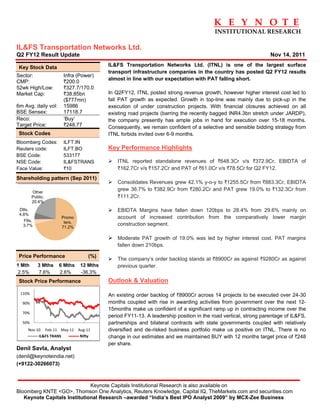
Q2 FY12 Result Update Nov 14, 2011
Key Stock Data IL&FS Transportation Networks Ltd. (ITNL) is one of the largest surface
transport infrastructure companies in the country has posted Q2 FY12 results
Sector: Infra (Power)
almost in line with our expectation with PAT falling short.
CMP: `200.0
52wk High/Low: `327.7/170.0
Market Cap: `38.85bn In Q2FY12, ITNL posted strong revenue growth, however higher interest cost led to
($777mn) fall PAT growth as expected. Growth in top-line was mainly due to pick-up in the
6m Avg. daily vol: 15986 execution of under construction projects. With financial closures achieved on all
BSE Sensex: 17118.7 existing road projects (barring the recently bagged INR4.3bn stretch under JARDP),
Reco: ‘Buy’ the company presently has ample jobs in hand for execution over 15-18 months.
Target Price: `248.77 Consequently, we remain confident of a selective and sensible bidding strategy from
Stock Codes ITNL forbids invited over 6-9 months.
Bloomberg Codes: ILFT.IN
Reuters code: ILFT.BO Key Performance Highlights
BSE Code: 533177
NSE Code: IL&FSTRANS ITNL reported standalone revenues of `648.3Cr v/s `372.9Cr, EBIDTA of
Face Value: `10 `162.7Cr v/s `157.2Cr and PAT of `61.0Cr v/s `78.5Cr for Q2 FY12.
Shareholding pattern (Sep 2011)
Consolidates Revenues grew 42.1% y-o-y to `1255.5Cr from `883.3Cr, EBIDTA
Other
grew 36.7% to `382.9Cr from `280.2Cr and PAT grew 19.0% to `132.3Cr from
Public, `111.2Cr.
20.4%
DIIs, EBIDTA Margins have fallen down 120bps to 28.4% from 29.6% mainly on
4.8%
Promo account of increased contribution from the comparatively lower margin
FIIs, ters,
3.7% construction segment.
71.2%
Moderate PAT growth of 19.0% was led by higher interest cost. PAT margins
fallen down 210bps.
Price Performance (%)
The company’s order backlog stands at `8900Cr as against `9280Cr as against
1 Mth 3 Mths 6 Mths 12 Mths previous quarter.
2.5% 7.6% 2.6% -36.3%
Stock Price Performance Outlook & Valuation
110% An existing order backlog of `8900Cr across 14 projects to be executed over 24-30
90% months coupled with rise in awarding activities from government over the next 12-
15months make us confident of a significant ramp up in contracting income over the
70%
period FY11-13. A leadership position in the road vertical, strong parentage of IL&FS,
50% partnerships and bilateral contracts with state governments coupled with relatively
Nov‐10 Feb‐11 May‐11 Aug‐11 diversified and de-risked business portfolio make us positive on ITNL. There is no
IL&FS TRANS Nifty change in our estimates and we maintained BUY with 12 months target price of `248
per share.
Denil Savla, Analyst
(denil@keynoteindia.net)
(+9122-30266073)
Keynote Capitals Institutional Research is also available on
Bloomberg KNTE <GO>, Thomson One Analytics, Reuters Knowledge, Capital IQ, TheMarkets.com and securities.com
Keynote Capitals Institutional Research –awarded “India’s Best IPO Analyst 2009” by MCX-Zee Business
2. IL&FS Transportation Networks Ltd. – Q2FY12 Result Update
(` Cr)
Particulars Q2FY11 Q1FY12 Q2FY12 Y-o-Y Q-o-Q H1 FY11 H1 FY12 Y-o-Y
Net Sales 883.29 1093.12 1255.53 42.1% 14.9% 1659.36 2348.65 41.5%
Total Expenditure 621.81 761.88 898.86 44.6% 18.0% 1136.42 1660.74 46.1%
PBIDT (Excl OI) 261.48 331.24 356.67 36.4% 7.7% 522.94 687.91 31.5%
Other Income 18.69 22.50 26.21 40.2% 16.5% 37.51 48.71 29.9%
Operating Profit 280.17 353.74 382.88 36.7% 8.2% 560.45 736.62 31.4%
Interest 98.28 142.57 169.36 72.3% 18.8% 203.74 311.93 53.1%
PBDT 181.89 211.17 213.52 17.4% 1.1% 356.71 424.69 19.1%
Depreciation 14.19 16.08 16.02 12.9% -0.4% 27.64 32.10 16.1%
PBT 167.70 195.09 197.50 17.8% 1.2% 329.07 392.59 19.3%
Tax 56.48 76.59 65.15 15.4% -14.9% 110.61 141.74 28.1%
Profit After Tax 111.22 118.50 132.35 19.0% 11.7% 218.46 250.85 14.8%
Contribution from Elsamex
Revenues from Elsamex were lower at 57mn Euros and the EBIDTA and PAT was
5.7mn Euros and 1.5mn Euros respectively. There was operational efficiency which
led to rise in EBIDTA margins of 10% compared with previous quarter margins of
9%.
Order backlog shows revenue visibility for next 24-30 months
ITNL current order backlog stood at `8900Cr which 5.5x of FY11 standalone
revenues which doesn’t include `1500Cr Udampur-Ramban project that has gone
for rebidding and `160Cr outdoor stadium project, Kerala where ITNL is L1. No
orders are received due to high intensity of competition in the road sector caused by
drying up of orders in other sectors. However, the award activity has picked up in
the last couple of quarters, thus presenting opportunities for road developers; ITNL
is expected to perform well considering the current position of the company.
Improvement in execution of EPC business
ITNL’s standalone revenue witnessed stunning growth of 73.8%% y-o-y to `648.3Cr
v/s `373.0Cr due to ramp-up in execution of under-construction projects and
increased fee income (supervision fee income) from Jharkhand road project,
RIDCOR Ph-2 and other under-construction projects. As per management, ITNL
has received environment clearances for the Pune-Sholapur project and expected to
receive appointed date in few days but work has already been started on the project
and around 15% of the work is completed. However, Revenue has not booked and
will come in following quarter. ITNL’s order book as of Sept 30, 2011, stood at
`8900Cr (2x FY2011 revenue).
Two project awarded under Jarkhand Accekerated Development Program
During the quarter, ITNL has been awarded two project stretching 198kms worth
`673Cr under Jharkhand Accelerated Development Program. We have not included
in our estimates as the financial closure is still awaited. However it is expected to
achieve financial closure by the end of FY12. These projects are annuity based
project, thereby increasing strength on annuity projects.
Page 2 Keynote Capitals Institutional Research
3. K E Y N O T E
INSTITUTIONAL RESEARCH
Bidding pipeline worth `7177Cr
ITNL has already bidded around `7177Cr worth of projects (1161kms). Six projects
worth `4803Cr are from NHAI and remaining from states government.
Consolidation of Average Daily Toll collection at several projects (` Cr)
Half
Projects FY11 Q1Y12 Q2Y12 Yearly Q‐o‐Q
Ahmedabad Mehsana Road 0.13 0.16 0.16 22.0% 3.9%
Vadodara Halol Road 0.10 0.11 0.12 19.8% 7.1%
Noida Toll Bridge 0.19 0.19 0.20 3.1% 2.1%
Mega Highways Rajasthan Ph‐1 0.29 0.40 0.40 37.1% ‐1.2%
Rajkot Jetpur ‐Gondal (Gujrat) 0.09 0.10 0.10 7.6% 1.0%
Beawer ‐ Gomti 0.04 0.04 0.05 ‐ 4.5%
Total Average Daily Toll 0.85 1.01 1.02 20.4% 1.6%
Average daily collection has been growing significantly in few stretches. Overall
average daily toll collection including annuity is up 9.63% Q-o-Q to `1.82Cr per day
compared to `1.66Cr per day. Addition of Eastern Hyderabad expressway to the
annuity project further improved the overall average daily collection for IL&FS
Transportation.
Less than 10% of equity contribution remaining
The company at the parent level has already infused huge amount of `2650Cr in
different SPVs. Now only equity contribution of `150Cr would be required of which
major investment would be in Jharkhand projects, Hazaribad – Ranchi and would be
funded through internal accrual.
EBIDTA Margins to improve in the coming years
Currently major portion of the revenues are from EPC division which has only 10-15%
EBIDTA margins where the margins from BOT projects are in the range of 80-85%. As
more and more projects are towards the completion stage revenue contribution from
BOT projects would rise thereby improving the margins in the coming years. Currently
contribution from EPC is around 80%, BOT is around 11% and remaining is fee based
income. The EBIDTA margins would remain range of 25-30% for the current year.
Debt-Equity at Standalone Still below industry average
The Debt Equity at the standalone level has increased marginally on account of
increase in borrowings for meeting cash flow requirement. It has increased from 1.09 at
31st March 2011 to 1.13 at 30 Sep, 2011 but still at the comfortable levels. However
consolidated debt had increased to 2.68 as on Sep 2011 from 2.40 as on March 2011
mainly on account of drawdown happening from debt tied-up for each of the projects
and is mostly project recourse debt.
Keynote Capitals Institutional Research Page 3
4. IL&FS Transportation Networks Ltd. – Q2FY12 Result Update
Consolidated P&L (` Cr)
Particulars FY08 FY09 FY10 FY11 FY12E
Net Sales 732.70 991.90 1704.80 2438.11 2951.72
Total Expenditure 320.80 553.00 905.80 1344.20 1579.51
PBIDT (Excl OI) 411.90 438.90 799.00 1093.91 1372.20
Other Income 52.00 28.20 48.90 64.49 0.00
Operating Profit 463.90 467.10 847.90 1158.40 1372.20
Interest 195.80 137.70 249.40 357.20 397.21
PBDT 268.10 329.40 598.50 801.20 975.00
Depreciation 101.60 114.40 181.90 225.40 332.03
PBT 166.50 215.00 416.60 575.80 642.97
Tax 40.00 37.80 13.30 111.70 68.00
Profit After Tax 126.50 177.20 403.30 464.10 574.97
(E: Keynote Capitals Institutional Research Estimates)
Consolidated Balance sheet (` Cr)
Particulars FY08 FY09 FY10 FY11E FY12E
Share Capital 332.4 332.4 332.4 332.4 332.4
Total Reserves 1288.3 1397.7 1707.5 2163.1 2726.8
Shareholder's Funds 1620.7 1730.1 2039.9 2495.5 3059.2
Minority Interest 28.1 59.9 77.9 95.0 110.0
Deferred Liabilities 2.6 18.2 26.7 30.0 26.4
Total Debts 2021.2 2485.9 2915.2 3379.9 4563.4
Total Liabilities 3672.6 4294.1 5059.7 6000.4 7759.0
Net Block 1884.9 2016.2 3467.4 4052.0 4901.8
Capital Work in Progress 888.8 1454.5 880.2 897.6 1200.8
Total Fixed Assets 2773.7 3470.7 4347.6 4949.6 6102.6
Investments 198.5 110.8 45.1 50.0 80.0
Total Current Assets 958.8 1018.1 1147.7 1630.5 2239.2
Total Current Liabilities 260.0 306.5 481.6 630.5 664.2
Net Current Assets 698.8 711.6 666.1 1000.0 1574.9
Total Assets 3672.6 4294.1 5059.7 6000.4 7759.0
(E: Keynote Capitals Institutional Research Estimates)
Consolidated Cash Flow (` Cr)
Particulars FY08 FY09 FY10 FY11 FY12E
Profit Before Tax 166.5 215.0 416.6 575.80 642.97
Add: Depreciation 101.6 114.4 181.9 225.40 332.03
Add: Interest Expenses 193.4 115.9 214.4 357.20 397.21
Op. profit before WC changes 411.6 444.1 799.5 1158.40 1372.20
Changes in working Capital -158.5 -140.1 185.0 54.64 -198.34
Cash Flow after changes in WC 253.1 304.0 984.5 1213.04 1173.86
Tax Paid 41.2 42.4 81.2 111.70 68.00
Cash From Operating Activities 211.9 261.6 903.3 1101.34 1105.86
Cash from Investing Activities -528.8 -604.7 -1022.3 -782.31 -1437.75
Cash from Financing Activities 407.6 330.9 142.6 257.27 708.49
Net Cash Inflow / Outflow 90.7 -12.2 23.6 576.29 376.60
Opening Cash & Cash Equivalent 20.3 111.0 98.8 122.44 698.73
Closing Cash & Cash Equivalent 111.0 98.8 122.4 698.73 1075.34
(E: Keynote Capitals Institutional Research Estimates)
Page 4 Keynote Capitals Institutional Research
5. K E Y N O T E
INSTITUTIONAL RESEARCH
Consolidated Ratios
Turnover Ratios FY08 FY09 FY10 FY11E FY12E
Total Assets Turnover 0.2 0.2 0.3 0.4 0.4
Fixed Assets Turnover 0.3 0.3 0.4 0.5 0.5
Net sales to net working capital 1.0 1.4 2.6 2.4 1.9
Net Working Capital Days 348.1 261.9 142.6 149.7 194.8
Inventory Turnover 14.6 4.8 10.0 12.0 12.0
Inventory Days 25.0 75.6 36.4 30.4 30.4
Advances Turnover 2.0 2.6 3.9 3.7 3.5
Advances Days 186.7 141.6 93.8 100.0 105.0
Debtors Turnover 62.1 76.3 57.4 40.2 42.9
Debtors Days 5.9 4.8 6.4 9.1 8.5
Creditors Turnover 3.1 4.2 5.7 5.5 6.6
Creditors Days 119.4 86.0 63.9 66.0 55.0
Valuation Ratios FY08 FY09 FY10 FY11E FY12E
Market Price (`) 147.6 147.6 147.6 147.6 147.6
EPS (x) 3.8 5.3 12.1 14.0 17.3
Book Value Per Share 48.8 52.0 61.4 75.1 92.0
PE ( x) 38.8 27.7 12.2 10.6 8.5
P/BV (x) 3.0 2.8 2.4 2.0 1.6
EV/EBIDTA (x) 16.0 15.9 8.8 6.4 5.4
Market Cap/Sales (x) 6.9 5.1 2.9 2.1 1.7
Return Ratios (%) FY08 FY09 FY10 FY11E FY12E
ROCE 9.9% 8.2% 13.2% 15.7% 13.3%
ROE 7.8% 10.2% 19.8% 18.6% 18.8%
Margins (%) FY08 FY09 FY10 FY11E FY12E
PBIDTA 63.3% 47.1% 49.7% 47.5% 46.5%
PBT 22.7% 21.7% 24.4% 23.6% 21.8%
PAT 17.3% 17.9% 23.7% 19.0% 19.5%
Other Ratios FY08 FY09 FY10 FY11E FY12E
Payout Ratio (%) 0.0% 28.1% 12.4% 10.7% 11.6%
Interest Cover (x) 1.9 2.6 2.7 2.6 2.6
EPS Growth (%) 0.0% 40.1% 127.6% 15.1% 23.9%
(E: Keynote Capitals Institutional Research Estimates)
Keynote Capitals Institutional Research Page 5
6. IL&FS Transportation Networks Ltd. – Q2FY12 Result Update
Institutional Equity Team
Rakesh Chaudhary (CEO) rakesh@keynotecapitals.net
Analysts / Associates
Denil Savla denil@keynoteindia.net +91 22 3026 6073
Deepak Kolhe deepak@keynotecapitals.net +9122 30266084
Rohan Admane rohan@keynoteindia.net +91 22 2269 6059
Rajesh Sinha rajesh@keynotecapitals.net +91 22 30266088
Mamta Singh mamta.singh@keynotecapitals.net +91 22 3026 6057
Technical Analyst
Sanjay Bhatia sanjay@keynotecapitals.net +91 22 3026 6065
Dealing / Sales
Nilesh Dhruv nilesh@keynoteindia.net +91 22 3026 6040
Puja Shah puja.shah@keynoteindia.net +91 22 3026 6072
Nisha Sharma nisha@keynoteindia.net +91 22 3026 6057
KEYNOTE CAPITALS LTD.
Member
Stock Exchange, Mumbai (INB 010930556)
National Stock Exchange of India Ltd. (INB 230930539)
Over the Counter Exchange of India Ltd. (INB 200930535)
Central Depository Services Ltd. (IN-DP-CDSL-152-2001)
4th Floor, Balmer Lawrie Building, 5, J. N. Heredia Marg, Ballard Estate, Mumbai 400 001. INDIA
Tel. : 9122-2269 4322 / 24 / 25 • www.keynoteindia.net
DISCLAIMER
• This report has been prepared and issued by Keynote Capitals Limited, based solely on public information and sources believed to be reliable.
• Neither the information nor any opinion expressed herein, constitutes an offer, or an invitation to make an offer, to buy or sell any securities or any
options, futures or other derivatives related to such securities and also for the purpose of trading activities.
• Keynote Capitals Limited makes no guarantee, representation or warranty, express or implied and accepts no responsibility or liability as to the
accuracy or completeness or correctness of the information in this report.
• Keynote Capitals and its affiliates and their respective officers, directors and employees may hold positions in any securities mentioned in this
Report (or in any related investment) and may from time to time add to or dispose of any securities or investments.
• Keynote Capitals may also have proprietary trading positions in securities covered in this report or in related instruments.
• An affiliate of Keynote Capitals Limited may also perform or seek to perform broking, investment banking and other banking services for the
company under coverage.
• If ‘Buy’, ‘Sell’, or ‘Hold’ recommendation is made in this Report, such recommendation or view or opinion expressed on investments in this Report
is not intended to constitute investment advice and should not be intended or treated as a substitute for necessary review or validation or any
professional advice. The views expressed in this Report are those of the analyst which are subject to change and do not represent to be an
authority on the subject. Keynote Capitals may or may not subscribe to any and/ or all the views expressed herein.
• The opinions presented herein are liable to change without any notice.
• Though due care has been taken in the preparation of this report, Keynote Capitals limited or any of its directors, officers or employees shall be in
any way be responsible for any loss arising from the use thereof.
• Investors are advised to apply their judgment before acting on the contents of this report.
• This report or any portion hereof may not be reprinted, sold or redistributed without the written consent of Keynote Capitals Limited.
Page 6 Keynote Capitals Institutional Research