1. Daily Technical Outlook
30th March 2012
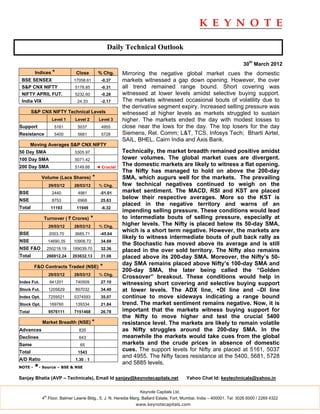
Indices * Close % Chg. Mirroring the negative global market cues the domestic
BSE SENSEX 17058.61 -0.37 markets witnessed a gap down opening. However, the over
S&P CNX NIFTY 5178.85 -0.31 all trend remained range bound. Short covering was
NIFTY APRIL FUT. 5232.60 -0.28 witnessed at lower levels amidst selective buying support.
India VIX 24.33 -2.17 The markets witnessed occasional bouts of volatility due to
the derivative segment expiry. Increased selling pressure was
S&P CNX NIFTY Technical Levels witnessed at higher levels as markets struggled to sustain
Level 1 Level 2 Level 3 higher. The markets ended the day with modest losses to
Support 5161 5037 4955 close near the lows for the day. The top losers for the day
Resistance 5400 5681 5728 Siemens, Rel. Comm; L&T, TCS, Infosys Tech; Bharti Airtel,
SAIL, BHEL, Cairn India and Axis Bank.
Moving Averages S&P CNX NIFTY
50 Day SMA 5305.97 Technically, the market breadth remained positive amidst
100 Day SMA 5071.42 lower volumes. The global market cues are divergent.
200 Day SMA 5149.66 ◄ Crucial
The domestic markets are likely to witness a flat opening.
The Nifty has managed to hold on above the 200-day
Volume (Lacs Shares) * SMA, which augurs well for the markets. The prevailing
29/03/12 28/03/12 % Chg. few technical negatives continued to weigh on the
BSE 2440 4981 -51.01 market sentiment. The MACD, RSI and KST are placed
NSE 8753 6968 25.63
below their respective averages. More so the KST is
placed in the negative territory and warns of an
Total 11193 11949 -6.32
impending selling pressure. These conditions would lead
Turnover ( ` Crores) * to intermediate bouts of selling pressure, especially at
29/03/12 28/03/12 % Chg.
higher levels. The Nifty is placed below its 50-day SMA,
which is a short term negative. However, the markets are
BSE 2003.70 3685.71 -45.64
likely to witness intermediate bouts of pull back rally as
NSE 14690.35 10906.72 34.69
the Stochastic has moved above its average and is still
NSE F&O 250218.19 189039.70 32.36 placed in the over sold territory. The Nifty also remains
Total 266912.24 203632.13 31.08 placed above its 200-day SMA. Moreover, the Nifty’s 50-
day SMA remains placed above Nifty’s 100-day SMA and
F&O Contracts Traded (NSE) *
200-day SMA, the later being called the “Golden
29/03/12 28/03/12 % Chg.
Crossover” breakout. These conditions would help in
Index Fut. 941201 740509 27.10 witnessing short covering and selective buying support
Stock Fut. 1205629 897032 34.40 at lower levels. The ADX line, +DI line and –DI line
Index Opt. 7259521 5374593 35.07 continue to move sideways indicating a range bound
Stock Opt. 169760 139334 21.84 trend. The market sentiment remains negative. Now, it is
Total 9576111 7151468 26.78 important that the markets witness buying support for
the Nifty to move higher and test the crucial 5400
Market Breadth (NSE) * resistance level. The markets are likely to remain volatile
Advances 835 as Nifty struggles around the 200-day SMA. In the
Declines 643 meanwhile the markets would take cues from the global
Same 65 markets and the crude prices in absence of domestic
Total 1543
cues. The support levels for Nifty are placed at 5161, 5037
and 4955. The Nifty faces resistance at the 5400, 5681, 5728
A/D Ratio 1.30 : 1
and 5885 levels.
NOTE - *- Source – BSE & NSE
Sanjay Bhatia (AVP – Technicals), Email Id sanjay@keynotecapitals.net Yahoo Chat Id: keytechnicals@yahoo.in
Keynote Capitals Ltd.
th
4 Floor, Balmer Lawrie Bldg., 5, J. N. Heredia Marg, Ballard Estate, Fort, Mumbai, India – 400001. Tel: 3026 6000 / 2269 4322
www.keynotecapitals.com
2. Short Term Trading Ideas Based On Technical Analysis (5 - 7 Days)
Stop
Initiation Stop Loss Target
Stock Close Action Price Loss * (%) Target (%) Remarks
Bajaj Hind 29.30 Sell Below 29 31.25 7.76 24 17.24
BHEL 248.75 Sell Below 246 253.25 2.95 230 6.50
Hindalco 124.80 Sell Below 124 130.00 4.84 111 10.48
ABB 853.30 Buy Above 855 829.00 3.04 912.00 6.67
* Stop Losses are to be considered strictly on closing basis.
Intra-day Resistance Intra-day Support
Indices Close Pivot Point R1 R2 R3 S1 S2 S3
BSE SENSEX 17059 17030 17138 17218 17407 16950 16841 16652
S&P CNX NIFTY 5179 5170 5203 5228 5286 5145 5111 5053
NIFTY APRIL FUT. 5233 5221 5257 5282 5342 5197 5161 5100
Keynote Capitals Ltd.
th
4 Floor, Balmer Lawrie Bldg., 5, J. N. Heredia Marg, Ballard Estate, Fort, Mumbai, India – 400001. Tel: 3026 6000 / 2269 4322
www.keynotecapitals.com
3. Disclaimer
This document is not for public distribution and has been furnished to you solely for your information and must not be
reproduced or redistributed to any other person. Persons into whose possession this document may come are
required to observe these restrictions.
This material is for the personal information of the authorized recipient, and we are not soliciting any action based
upon it. This report is not to be construed as an offer to sell or the solicitation of an offer to buy any security in any
jurisdiction where such an offer or solicitation would be illegal. It is for the general information of clients of Keynote
Capitals Ltd. It does not constitute a personal recommendation or take into account the particular investment
objectives, financial situations, or needs of individual clients.
We have reviewed the report, and in so far as it includes current or historical information, it is believed to be reliable
though its accuracy or completeness cannot be guaranteed. Neither Keynote Capitals Ltd., nor any person connected
with it, accepts any liability arising from the use of this document. The recipients of this material should rely on their
own investigations and take their own professional advice. Price and value of the investments referred to in this
material may go up or down. Past performance is not a guide for future performance. Certain transactions -including
those involving futures, options and other derivatives as well as non-investment grade securities - involve substantial
risk and are not suitable for all investors. Reports based on technical analysis centers on studying charts of a stock’s
price movement and trading volume, as opposed to focusing on a company’s fundamentals and as such, may not
match with a report on a company’s fundamentals.
Opinions expressed are our current opinions as of the date appearing on this material only. While we endeavor to
update on a reasonable basis the information discussed in this material, there may be regulatory, compliance, or
other reasons that prevent us from doing so. Prospective investors and others are cautioned that any forward-looking
statements are not predictions and may be subject to change without notice. Our proprietary trading and investment
businesses may make investment decisions that are inconsistent with the recommendations expressed herein.
We and our affiliates, officers, directors, and employees world wide may: (a) from time to time, have long or short
positions in, and buy or sell the securities thereof, of company (ies) mentioned herein or (b) be engaged in any other
transaction involving such securities and earn brokerage or other compensation or act as a market maker in the
financial instruments of the company (ies) discussed herein or act as advisor or lender / borrower to such company
(ies) or have other potential conflict of interest with respect to any recommendation and related information and
opinions.
The analyst for this report certifies that all of the views expressed in this report accurately reflect his or her personal
views about the subject company or companies and its or their securities, and no part of his or her compensation
was, is or will be, directly or indirectly related to specific recommendations or views expressed in this report.
No part of this material may be duplicated in any form and/or redistributed without Keynote Capitals Ltd’s., prior
written consent.
Keynote Capitals Ltd.
th
4 Floor, Balmer Lawrie Bldg., 5, J. N. Heredia Marg, Ballard Estate, Fort, Mumbai, India – 400001. Tel: 3026 6000 / 2269 4322
www.keynotecapitals.com