SlideShare une entreprise Scribd logo
1  sur  54
Télécharger pour lire hors ligne
UOIT
Long Term Energy Plan of
South Africa
Undergraduate Thesis II
Faculty of Energy Systems and Nuclear Science
University of Ontario Institute of Technology
April 2014
Author
Kiran Boochoon
Supervisors
Dr. M. Kaye
Dr. D. Hoornweg
Dr. J. McKellar
1 | P a g e
Acknowledgements
I would like to thank all of the people who helped and provided support during the writing of this
thesis.
Most importantly, I would like to thank the thesis supervisors, Dr. Kaye, Dr. McKellar, and Dr.
Hoornweg, for their time, support, and comments throughout this whole process.
2 | P a g e
Table of Contents
1. Introduction..................................................................................................................................................................... 4
2. Background of South Africa....................................................................................................................................... 4
3. Energy Demand and Projections...........................................................................................................................11
3.1 Electricity – Current Energy Demand........................................................................................................11
3.2 Electricity – Future Energy Demand..........................................................................................................13
3.3 Thermal Energy Demand................................................................................................................................15
3.4 Transportation – Current Energy Demand..............................................................................................16
3.5 Transportation – Future Energy Demand................................................................................................18
4. South Africa’s Energy Supply..................................................................................................................................18
4.1 Electricity Generation.......................................................................................................................................18
4.1.1 Coal.................................................................................................................................................................18
4.1.2 Hydroelectric..............................................................................................................................................19
4.1.3 Natural Gas..................................................................................................................................................20
4.1.4 Nuclear..........................................................................................................................................................20
4.1.5 Biomass.........................................................................................................................................................21
4.1.6 Solar ...............................................................................................................................................................21
4.1.7 Wind...............................................................................................................................................................22
4.2 Transportation Energy.....................................................................................................................................23
4.2.1 Diesel .............................................................................................................................................................23
4.2.2 Gasoline ........................................................................................................................................................23
5. Energy Evaluation Charts.........................................................................................................................................24
5.1 Example Evaluation Criteria Chart: Coal..................................................................................................24
5.2 Completed Evaluation Criteria Chart Scores ..........................................................................................26
6. Application of Energy Charts to Projection Data............................................................................................27
6.1 Electricity...............................................................................................................................................................27
6.2 Transportation....................................................................................................................................................28
7. Conclusion.......................................................................................................................................................................29
Bibliography ............................................................................................................................................................................30
Appendix A – Evaluation Criteria Charts.....................................................................................................................33
Coal.........................................................................................................................................................................................33
Hydroelectric......................................................................................................................................................................36
Natural Gas..........................................................................................................................................................................39
3 | P a g e
Nuclear..................................................................................................................................................................................41
Solar .......................................................................................................................................................................................44
Wind.......................................................................................................................................................................................46
Biomass.................................................................................................................................................................................48
Appendix B – Transportation Evaluation Criteria Charts.....................................................................................51
Diesel .....................................................................................................................................................................................51
Gasoline ................................................................................................................................................................................52
Electric/Hybrid..................................................................................................................................................................52
Figure 1. South African Population Density.................................................................................................................. 5
Figure 2. Eskom’s power stations located in South Africa ..................................................................................... 7
Figure 3. Coal Reserve Holders of the World.............................................................................................................10
Figure 4. Energy flow chart of the Electricity Distribution in South Africa...................................................11
Figure 5. South Africa’s Weekday Electricity Demand Profile............................................................................12
Figure 6. Energy Reserves of South Africa..................................................................................................................15
Figure 7. Energy Sources Usage for Households in 2001 .....................................................................................16
Figure 8. Consumption of Petroleum Products from 1988 to 2010.................................................................18
Figure 9. Pressurized Water Reactor ............................................................................................................................21
Table 1. Outlook of South Africa Energy Demand (2011 – 2040).....................................................................14
Table 2. Fuel consumption of South Africa Between 1988 to 2010 (Millions of Litres) .........................17
Table 3. Electricity Totals...................................................................................................................................................26
Table 4. Transportation Totals ........................................................................................................................................27
Table 5. Current Electrical Output .................................................................................................................................27
Table 6. Installed Capacity Deficits from 2013 to 2030.........................................................................................27
4 | P a g e
1. Introduction
Long Term Energy Plans are used to provide a sustainable energy profile for a country to be cost
effective, reliable, and lead towards cleaner energy. During Thesis I, a planned methodology was
designed to construct a long term energy plan to any given country. The designed methodology
was first used to create a plan for Ontario, which was then compared to an existing long term
energy plan constructed by the government of Ontario. The designed energy plan was proven to be
similar to the already existing developed plan; therefore allowing the use for the methodology for
several other countries.
The purpose of Thesis II was to implement the methodology to South Africa and develop a long
term energy plan to be economically sound, reliable, and to have a cleaner energy future. Within
Ontario’s long term energy plan cost analysis and key impacts were not incorporated; this designed
methodology takes into account for these factors in an attempt to focus on every aspect to construct
a sustainable energy program for South Africa.
The designed methodology was constructed to focus on electricity, thermal and transportation
energy, where projections and evaluation charts would be used to determine how much and what
type of energy would be needed for the future of South Africa. The proposed future energy supply
mix will be based on a rating system, as developed and justified in the methodology, and then
applied to the demand of the region
For the purposes of this report, efforts in conservation, smart meters and transmission services will
be excluded; these particular aspects are typically dependant on funding and programs from the
government and while they are relevant to a long term energy plan, are beyond the scope of this
report. Unfortunately, in regards to thermal energy, projections were difficult to obtain, possibly
due to the lack of any projections completed by the government South Africa, or any other third
party; therefore proposed future supply mix for thermal energy will not be included within this
report.
2. Background of South Africa
South Africa is located at the southern point in Africa between the Indian and Atlantic Ocean. South
Africa is a midsize country; approximately one eighth the size of the United States. Namibia,
Botswana, Zimbabwe and Mozambique all border South Africa, where the small country of Lesotho
is embedded within South Africa.
South Africa has a wide variety of climate and topography, consisting of rocky hills and mountains,
which can be very dry, as well as extremely hot in the summer and icy during the winter. The
eastern coastline of South Africa has well watered and lush land, where it is free from frost
throughout the year. The southern coast also consists of green land but not as tropical as the
eastern coastline. South Africa`s southern west coast consists of wet winters and hot and dry
5 | P a g e
summers. Temperatures in South Africa can range from 50 oC to -18.3 oC, depending on the specific
region.
The biggest neighbours of South Africa consist of the Indian and Atlantic oceans surrounding the
east, west and southern coastlines. There are several small rivers leading towards the coastlines,
none of which useful for natural harbours. Two major rivers are located within South Africa; the
Limpopo and the Orange. The Limpopo is shared with Zimbabwe in the north, while the Orange
River runs from east to west with variable flow across the central landscape, draining to Atlantic
Ocean.
The population of South Africa is approximately 48.6 million people, where the median age is 25.5
for both men and women. The population growth rate of South Africa is approximately 0.45%,
estimated in 2013. A population density map of South Africa is presented below showing the most
and least populated areas of South Africa.
Figure 1. South African Population Density
6 | P a g e
Map of population density in South Africa
<1 /km²
1–3 /km²
3–10 /km²
10–30 /km²
30–100 /km²
100–300 /km²
300–1000 /km²
1000–3000 /km²
>3000 /km²
7 | P a g e
Figure 2. Eskom’s power stations located in South Africa [1]
8 | P a g e
Shown above in Figure 2, we can see that Eskom holds a large share of the power generating
stations within South Africa. Eskom supplies approximately 95% of South Africa’s electricity, where
the remaining supply comes from independent power producers and importing from other
countries [2]. South Africa’s energy mix has a variety of different generating stations, such as coal,
natural gas, hydro-electric, and nuclear, as well as renewable energy, such as solar and wind farms.
The north western portion of South Africa is not particularly populated; therefore there are not
many power generation stations.
The largest portion of electricity production comes from coal-fired plants, which operate 24 hours a
day. The country has limited proven reserves for oil and natural gas; therefore coal is the main
provider, producing approximately 90% of the country’s energy [2]. The installed total net output
of the coal-fired plants is 34 952 MW, while the total installed capacity from Eskom is
approximately 44 084 MW. Eskom also has a new build programme which will add to the installed
capacity by approximately 11 032 MW [3]. Below is a list of all power generating stations operated
by Eskom within South Africa.
9 | P a g e
10 | P a g e
According to BP’s statistical review, South Africa has an estimated coal reserve of 30.2 million short
tons, which accounts for 4% of the entire worlds coal reserves. Since coal is approximately 70%
South Africa’s primary energy consumption it plays a large economical role.
Figure 3. Coal Reserve Holders of the World [2]
11 | P a g e
South Africa also has a relatively large amount of Uranium reserves, where there world reserve
percentage is approximately 1%. Of the several major African producers of Uranium
3. Energy Demand and Projections
3.1 Electricity – Current Energy Demand
There are many sectors of South Africa which need large amounts of electricity to continue for
operation, which include mining, industrial, and commercial processes. Eskom, producer of
approximately 95% of power generated within South Africa supplied approximately 55% directly
to end users; therefore domestic, mining, agriculture, industrial, etc. The remaining energy
produced by Eskom is purchased by Municipal and other distributors, where it is purchased by the
end user [4]. Below in Figure 4. we can see how the distribution of energy was conducted in 2001.
This distribution may change in the future, but will have little to no effect on the amount of energy
produced.
Figure 4. Energy flow chart of the Electricity Distribution in South Africa [4]
12 | P a g e
Energy demand for countries can rely on many different factors, some of which depend on the time
of the day, time of the year, climate of the country, and even the technological advancement of the
country. Electricity demand has certain peaks and drops throughout the span of a 24 hour day.
Typically during the 4 p.m. to 7 p.m. range there is a demand peak due to consumers arriving home
from work, while there is a drop during hours when people are sleeping. Shown in Figure 5, we can
see the average electricity demand for a weekday in South Africa.
Figure 5. South Africa’s Weekday Electricity Demand Profile [4]
In 2001, South Africa’s peak times ranged from about 5 p.m. to 8 p.m. where they would decline
moving towards the later hours of the day. The peak demand for electricity varies between the
summer and winter, as winter typically has consumers using heating systems to heat their homes.
The maximum demand peak during the winter is just over 28 000 MW, while the maximum demand
peak for the summer is approximately 25 500 MW. The minimum electricity demand is between 3
a.m. and 5 a.m. during the summer and winter the electricity demand change is much smaller
compared to the evening peak times; the change is just under 1000 MW.
We can expect these peak times to continue to stay the same, meaning only the energy demand will
increase as the year’s progress. The installed total net output of the coal-fired plants is 34 952 MW,
13 | P a g e
while the total installed capacity from Eskom is approximately 44 084 MW. Eskom also has a new
build programme which will add to the installed capacity by approximately 11 032 MW [3].
3.2 Electricity – Future Energy Demand
South Africa’s energy demand will increase in the future, considering the population growth rate of
the country is increasing every year. With a higher populated area more power generating stations
will need to be constructed to bridge this gap.
Projection data used will range from 2010 to 2030, where the energy demand is linked to the South
African Integrated Resource Plan (IRP) 2010 to 2030.
14 | P a g e
Table 1. Outlook of South Africa Energy Demand (2011 – 2040) [5]
15 | P a g e
As we can see from the projected data, there will be a large increase in capacity essentially every 10
years due to the fact South Africa is a developing country. South Africa has very large coal reserves,
where most of the country’s energy supply originates. As well as large coal reserves, South Africa
also has a particularly high amount of uranium reserves which can be used in their single nuclear
power plant, or potentially in any new ones to be erected. Although south Africa has large coal and
uranium reserves, the country is lacking with gas and oil reserves; therefore the country typically
imports if necessary. In Figure 6 we can see the one year’s demand of power compared to several
resources South Africa has to offer.
Figure 6. Energy Reserves of South Africa [6]
3.3 Thermal Energy Demand
South Africa has a wide range of temperatures throughout the year, where temperatures may get
close to zero degrees Celsius. Consumers in South Africa have the option to heat their homes and
water by under floor heating solutions, water heat pumps, and also solar panel water heating
alternatives.
In 2001, approximately one third of households in South Africa were electrified, therefor different
energy sources were used for heating, lighting, and cooking. Although electricity was the leader in
all three categories, other energy sources were used as shown in Figure 7.
16 | P a g e
Figure 7. Energy Sources Usage for Households in 2001 [6]
Electricity will continue to dominate all three categories for households that are electrified due to
convenience and accessibility; therefore over the next couple decade’s electricity will be the
number one option for thermal energy within households, until natural gas becomes more available
i.e. via pipelines.
Other countries around the world such as Canada and the United States use natural gas for thermal
energy in electric generation, industrial, commercial, and residential conditions. In South Africa,
thermal energy for residential consumers comes from purchased cylindrical liquefied petroleum
(LP) gas tanks unlike underground gas lines. Therefore heating a home and cooking are the major
uses for LP gas tanks.
Solar water heating panels are being researched and implemented into residential areas to provide
an alternative to heating a consumer’s water. Many different companies are producing these
devices to lower carbon emissions and lower their carbon footprint, considering a large amount
power is generated by coal-fired plants.
Finding information related to current and future thermal energy demand was proven to be a
difficult task. Any information related to electric generation, industrial, commercial, and residential
thermal energy was not available, therefore a proper analysis of thermal energy in South Africa will
not be conducted and removed from this Long Term Energy Plan.
3.4 Transportation – Current Energy Demand
The transportation sector within South Africa is typically dominated by the consumption petrol and
diesel fuels. Therefore other forms and types of fuels will be excluded from the transportation
portion of this Long Term Energy Plan. In the past, it is easily observable that there is a steady
increase in the petrol and diesel consumption. In Table 2 below, we can see this steady trend
starting from 1988 to 2010.
17 | P a g e
Table 2. Fuel consumption of South Africa Between 1988 to 2010 (Millions of Litres) [7]
As we can see from Table 2, petrol holds a larger share of the fuel consumption related to
transportation in South Africa. Although some slight fluctuations, diesel also appears to be
increasing at the same rate as petrol; therefore an interpolation can be conducted to obtain future
consumption.
18 | P a g e
3.5 Transportation – Future Energy Demand
With the data from Table 2, we obtain two functions; one function for petrol and one for diesel. The
relationships can be seen in Figure 8 below.
Figure 8. Consumption of Petroleum Products from 1988 to 2010
If we use the equations obtained from the plotted graph and extrapolate to the year 2030, we
obtain 14826 millions of litres of petrol and 13824 millions of litres of diesel per year.
4. South Africa’s Energy Supply
4.1 Electricity Generation
4.1.1 Coal
South Africa has particularly large reserves of coal. As stated previously, South Africa currently has
the ninth largest coal reserve in the world, where most of the energy produced within the country
originates from coal-fired plants. Eskom, the company which operates almost all of the coal plants
in South Africa, produces approximately 90% of the country’s energy requirements.
Coal powered plants work in a similar manner as nuclear power plants. Heat is generated by the
burning of pulverized coal, where heat exchangers pass through a boiler containing water which
turns into steam. The steam flows to a turbine which turns due to the enormous amount of pressure
y = 146.77x - 283117
y = 228.56x - 450153
0
2000
4000
6000
8000
10000
12000
14000
1985 1990 1995 2000 2005 2010 2015
ConsumptionofPetroleumProducts(millionsoflitres)
Year
Consumption of Petroleum Products from 1988
to 2010
Petrol
Diesel
19 | P a g e
exerted by the steam. The steam is then condensed by cooling water from either a lake or a cooling
tower, and is sent back through the system to repeat the cycle. The turbine is connected to a
generator to produce electricity [8]. Coal plants in Ontario produce approximately 3,136 MW in
total [9]. Coal plants and other thermal plants provide the ability to start and stop generation of
electricity to satisfy demand needs of consumers during peak times which cannot be met by
Ontario’s nuclear plants and renewable sources. Coal plants produce a particularly high amount of
greenhouse gases compared to other energy producing sources such as nuclear, wind, hydro, etc. In
an attempt to create a cleaner and environmentally friendly province, Ontario has decided to stop
operational use of coal-fired plants. By the end of 2014, coal plants will be completely discontinued;
therefore lowering the amount of greenhouse gases emitted to the atmosphere. The lifetime of an
average coal plant is designed for approximately 25 years, but are typically serviced and
refurbished to last for about 40 years and in some cases 50 years [10]. As coal is being phased out
of Ontario, the need for coal is essentially nullified.
The overnight capital costs depending on the type of plant constructed range from values of just
under $3,000/kW to over $6,500/kW. The operating and maintenance costs vary depending on the
type of plant as well, and range from $30/kW-a to over $80/kW-a [11].
Since coal plants are relatively similar in design and operations to nuclear power plants, a lake or a
cooling tower is necessary to condense the purified water used to move the turbines. From the
plants within Ontario, there are three types of coals which are used; these include lignite,
bituminous and sub-bituminous. Where all types of coal used must be pulverized into a powder
where it is sent to the boiler for heat generation.
4.1.2 Hydroelectric
Hydroelectric is the lowest cost power source and runs on water from a river or lake which is a
renewable source based on how they operate [12]. Hydroelectric stations use either flowing river
water or are made into a damn to use the potential energy from lake water to go down a pipe, gain
kinetic energy and spin a turbine. The turbine is connected to a generator which spins because of
the turbine and produces electricity which then goes out to the grid. South Africa and Eksom has
three different types of hydroelectric stations; conventional reservoir, run-of-river, and pumped
storage schemes.
Pumped storage scheme stores a constant volume of water, which moves from one system to
another through turbines to generate electricity. One reservoir is higher than the other which uses
reversible pumps to transfer the water between the reservoirs.
The costs for involved in hydroelectric are as follows; for a 500 MW plant the fixed operations and
maintenance cost is around $14.13/kw-a*1 [13]. The variable operations and maintenance cost are
low compared to other energy sources because the plant is designed to last for very long periods of
time and is adaptable to changes in power. These are an example of some of the costs that a
1
From the rest of this section, it should be noted that any costs marked with an asterisk came from an American
document as some of the plants discussed are not available in Ontario: this assumption is deemed valid with the
American dollar being close to on par with the Canadian dollar.
20 | P a g e
hydroelectric plant undergoes. The costs for a plant are mainly for construction; which can range
from 40% to 50%, 20% to 25% for the turbines for larger plants and 5% to 10% for electrical
configuration [14].
4.1.3 Natural Gas
South Africa has constructed their first natural gas power plant, becoming operational in 2012. The
power plant in Sasolburg has an operating capacity of 140MW, but has been operating at 152MW
since December 2012 [15].
Natural gas is formed in the much the same way as coal and oil; from decayed organic material
cooking underground for millions of years [14]. Natural gas is more versatile than coal and oil
because it can be used for three things; heating, electricity, and used in transportation. Natural gas
is found underground and is found by seismic sensors and then drilled out and pumped into a
refining plant [14]. The refining plant takes out the impurities; like, water, oil, and condensates in
which these products can be used for other things [14]. Transporting natural gas can be difficult; it
is usually transported through underground piping or is converted into liquid form and transported
by ship [14]. The transportation costs make up almost two thirds of the price of natural gas [14].
Natural gas is cheap and ranges from $3.50 to just over $5/mmbtu [14]. Natural gas is said to be
‘clean’ but it still releases much the same emissions as coal or oil just in a much less concentration.
The fuel, natural gas, is used to run an engine or gas or steam turbine which then drives an
alternator which produces the electricity. The natural gas generally is in a large industrial furnace
where it burns and creates steam which turns the turbine and creates electricity [12]. The heat that
is produced during the process is then captured in steam or and hot water and used in industrial
processes, space heating, or other needs [16]. Natural gas plants have efficiencies of only 33% to
35% [14] which is similar to nuclear and less than coal or hydro. Natural gas still has emissions but
they are less than coal; it produces approximately 55% the amount coal does for the same amount
of energy produced [14].
The fixed operations and maintenance cost is about $13.17/kW-a* [13]. The variable operations
and maintenance costs are around $3.60/MWh* [13].
4.1.4 Nuclear
South Africa has two nuclear reactors, generating approximately 5% of their total energy. The
reactors are located at Koeburg Nuclear Power Station just outside of Cape Town. The Koeburg
Nuclear Power Station has a net capacity of 1830 MWe, where commissioning began in 1984 and
1985. These reactors are planned to be closed in 2024 and 2025, giving them a 40 year life period
[17].
South Africa has a proposed 6 reactor or more plant in Thyspunt, which will have a gross capacity
of 9600 MWe, or 1600MWe per reactor. This plants first power proposed to be within the period
2023 to 2030, and is a Pressurized Water Reactor (PWR) [17].
PWRs use light water as its coolant and moderator, unlike CANDU reactors which use a heavy water
coolant. The fuel for a PWR is enriched uranium unlike in CANDU which uses natural uranium.
PWRs operate in the same manner as any other plant, where a heat source is produced transferring
21 | P a g e
heat to coolant, and the coolant flows to a steam generator, producing steam on a secondary side.
This steam is used to drive turbines to convert mechanical energy into electrical energy by a
generator, where the electricity is then sent to the grid for consumer use.
Figure 9. Pressurized Water Reactor [18]
South Africa has a fairly large reserve of uranium; therefore in the future nuclear energy could
flourish and compete with coal-fired power plants. A negative is constructing nuclear power plants
which use enriched uranium, therefore shipping and processing will account for a lot of the pricing
of uranium.
4.1.5 Biomass
Biomass primarily consists of wood pellets, agricultural by-products such as grain screenings, and
milling spoils that are burned to produce electricity in much the same way natural gas is used [12].
Biomass is a renewable source because the products used can be grown. Biomass is carbon neutral
because it produces the same amount of carbon while burning as it removed while the plant was
growing [16]. Advantages to biomass include; it is abundant and renewable, there is no net increase
in carbon dioxide, and vegetable oil can be used for biodiesel [19]. Disadvantages to biomass
include: it still produces some emissions, and it needs large amounts of land to grow the fuel [19].
South Africa has a large potential in biomass energy, considering the amount of open fields the
country has to plant fuels such as sugar cane. As an incentive by the South African government a
biomass plant of 17.5MW has been selected as a renewable energy project. The plant will be run on
sugar cane tops and leaves producing 132000 MWh per annum [20].
4.1.6 Solar
There are two types of solar power; thermal and photovoltaic [14]. Solar is a renewable resource
because it draws energy from the sun. The sun provides lots of energy to the world through
22 | P a g e
radiation, heat, and light but the power received is based on climate, clouds and the length of night.
To use the sun’s energy solar panels are used and collectors. The current solar panel system can
only convert about 12 to 15 percent of the solar energy that it absorbs [16]. There are three types of
collectors; low temperature, medium, and high temperature [14]. The low temperature collectors
are used for swimming pool heating, greenhouses, and space heating [14]. Medium temperature
collectors are mainly used in domestic hot water heating and high temperature collectors are used
to provide electricity to the grid [14].
High temperature collectors are used to supply electricity to the grid. They use parabolic troughs, a
solar dish, or solar power towers [14]. Solar power uses the same idea to produce electricity has a
fossil fuel plant or nuclear plant; it heats up water, turns it into steam which in turn turns a turbine
which produces electricity [14]. The troughs, dishes, and towers all take the sun and focus its
energy to heat up the water. The land use is large for solar; for example, a coal plant requires 640 to
1,280 acres of land whereas a solar thermal plant would need 6,000 acres to produce 1,000 MW of
power [14]. Average costs for a plant is between $122/MWh and $220/MWh and this is dependent
on location [14]. There are also photovoltaic solar panels that convert the sun’s energy directly into
electricity using advanced semiconductors [14]. Photovoltaic panels are generally used on top of
houses or industries to power their electrical circuit. The main cost is construction with minimal
operations and maintenance [14]. This is because it uses the sun and it is renewable as well as
abundant.
The annual 24-hour global solar radiation average is about 220 W/m2 for South Africa, compared
with about 150 W/m2 for parts of the USA, and about 100 W/m2 for Europe and the United
Kingdom. This makes South Africa's local resource one of the highest in the world [21].
4.1.7 Wind
Wind occurs when there is an uneven heating of the Earth’s atmosphere by the sun, the
irregularities of the Earth’s surface, i.e., mountains, valleys, etc., and the rotation of the Earth. Wind
turbines were created to harness the power of this renewable energy source. Wind turbines work
by in the same fashion as turbines work in power plants, but instead of using pressurized steam,
wind is used as the driving force. Turbines convert the kinetic energy of the wind into mechanical
power and a generator is used to convert the mechanical power into electricity. Wind turbines use
incoming wind to turn the blades and the rotor connected to a low-speed shaft. The low speed shaft
is connected to a high-speed shaft, increasing the rotations per minute from 30 – 60 rpm to 1,000 –
1,800 rpm, which is the required rotational speed required by most generators to produce
electricity [22].
Currently there are 9 wind farms located in South Africa, which have an installed capacity of
approximately 456 MW in total [23]. This is relatively small to the current energy demand of South
Africa.
Wind turbines are generally estimated to have a lifetime of 20 years [24]. Maintenance costs are
particularly low for new turbines but increase further as it ages. Regardless of size of a wind
turbine, the servicing costs will generally be equivalent because the need to service a large wind
turbine and a small turbine are equal.
23 | P a g e
A single wind turbine can produce approximately 1.5 MW to 4.1 MW and wind farms will have tens
of hundreds of turbines, therefore a need for large open areas are necessary. Some wind farms are
located offshore due to the open concept and land availability. Turbines can have blades over the
length of 50 m, meaning enough land must be available to have a successful energy producing wind
farm [25].
Wind energy may have minor impacts, for example, construction of roadways and transportation of
equipment. Although wind turbines are a cleaner energy source than other means of energy
production, many consumers do not believe wind farms are aesthetically pleasing. Another impact
is using a large amount of land for wind farms that do not produce nearly an equivalent amount of
electricity compared to nuclear and fossil fuel plants.
4.2 Transportation Energy
4.2.1 Diesel
There are several uses for diesel such as powering vehicles or diesel generators. Diesel is produced
from the heating of crude oil in a piece of equipment known as a crude distillation tower. Crude oil
is unrefined liquid petroleum, ranging from yellow to black and is composed of several thousand
different compounds known as hydrocarbons. Each hydrocarbon has a specific boiling point which
is the method for separating each product. Within the crude distillation tower, crude oil is heated
where the hot gases are passed into the bottom the distillation column and become cooler as they
rise. The gases condense and are drawn out of the column based on boiling points and specific
heights in the column. The drawn out fluids include heavy residues at the bottom, raw diesel fuels
in the mid-sections, and gasoline at the top, which are processed further to creating several
different finished products. The process of crude oil refining separates different products, having
many uses such as high performance fuels to certain types of plastics [26]. Other forms of diesel
exist that are not produced from crude oil. For example biodiesel is created from a variety of feed
stocks including canola and soy oils, animal fats, recycled cooking oils and restaurant grease.
Biodiesel is a clean-burning, biodegradable, and renewable fuel and reduces greenhouse gases,
smog causing particles, and acid rain causing emissions. Biofuel can also be used in vehicles if the
fuel is mixed with regular diesel at a percentage ranging from 5% to 20% blend [27].
4.2.2 Gasoline
Gasoline is a petroleum product usually made from refining crude oil [11]. The process for refining
gasoline is complex but is generally extracted from deposits of crude oil [13]. Gasoline is used for
transportation; it is used for combustion in an engine. The car uses the combustion energy and
turns it into mechanical energy. When gasoline goes through combustion it produces greenhouse
gases such as methane and carbon dioxide which deteriorate the ozone layer. Gasoline combustion
also has other effects on the atmosphere, such as creating smog precursors that creates an
unhealthy supply of air because of the dangerous gases that get inhaled. Gasoline stations are
located in many places because most automobiles use gasoline.
24 | P a g e
The petrol price in South Africa is linked to the price of petrol in US dollars in certain international
petrol markets. This means that the domestic price is influenced by supply and demand for
petroleum products in international markets, combined with the rand/dollar exchange rate [28].
5. Energy Evaluation Charts
Evaluation criteria charts were constructed to determine how important each criterion regarding
every energy source. Below an example of the how the rating systems and weighting factors were
completed to determine an energy sources final score ranking for South Africa. Weighting factors
range from 1 to 10, where 1 is the lowest and 10 is the highest. A rating was given for each criterion
to determine the evaluation outcome, which gives the energy source its final ranking. Different
criteria charts were constructed for electricity, thermal, and transportation, in the case of South
Africa, thermal energy was excluded due to sufficient available data.
5.1 Example Evaluation Criteria Chart: Coal
Electricity Selection Criterion Weighting Factor (1-10) Rating Evaluation
Public Opinion 7 3 21
Cost
Operating Cost 9 3 27
Upfront Construction Cost 7 3 21
Resource Cost 3 4 12
Reliability 10 5 50
Key Impacts 8 1 8
Energy Output (MW) 9 4 36
Availability of Fuel 7 5 35
Risk Analysis
Financial 8 4 32
25 | P a g e
Political 4 1 4
Disaster 9 4 36
Availability to have Workers Run the
Plant
5 4 20
Ability to Operate on a Small Scale 7 1 7
Total 309
Coal plants may have a bad reputation with the public due to the many effects they impose;
producing a large amount of greenhouse gases and other pollutants into the atmosphere, such as
sulphur dioxides, nitrous oxides, mercury, etc. Many people do not want to live in a polluted and
smoggy area. Considering that coal is the leading provider of energy within South Africa, we can
assume that the public does tolerate and understand that coal is a large economical factor.
Therefore a rating of 3 was given.
Operating and maintenance costs for a coal power plant are at a medium level. They are higher than
natural gas operating and maintenance costs but lower or on par with other energy generating
options such as wind, solar, and nuclear. The values of the operating and maintenance costs range
roughly from $31.18 - $80.53/kW-a. The rating given for operating costs of coal power plants is a
value of 3.
Depending on the type of coal plants constructed, upfront construction costs are can vary and range
from approximately under $3,000/kW to just over $6,500/kW. Comparing the upfront construction
costs to other sources of energy production, this is within the medium range; therefore a rating of 3
was given.
The amount of coal used in a power plant to produce one kilowatt-hour is roughly 1.07 pounds of
coal, which in the long run, coal plants need a very large amount of coal to operate. In turn the
amount of coal needed for a power plant is fairly high; therefore coal would be in demand
increasing the price of coal. But South Africa has a very large reserve of coal therefore a rating of 4
was given.
Coal plants are very reliable, as they can be essentially turned on and off when needed. A rating for
reliability of coal plant was given a value of 5.
There are many key impacts with coal power plants, such as the release of greenhouse gases, and
several other hazardous pollutants to the atmosphere. These pollutants include nitrogen oxides,
sulphur dioxide, and mercury, all of which effect the environment negatively. Even with mitigation
processes, coal and fossil fuels make up a large portion of emissions in South Africa. South Africa
also has a large amount of coal plants supply a large portion of the energy to the country. Therefore
a rating of 1 was given for the key impacts for coal power plants.
26 | P a g e
Since coal-fired plants are the main generating energy source within South Africa, and they are
building two of the largest plants in the world, of approximately 4800MW each, they can provide a
large electrical output. Therefore a rating of 4 was given energy output.
Coal is the largest energy resource South Africa has to offer, where they are ninth among the world;
therefore a rating of 5 was given for resource availability.
Coal power plants can be built much faster than a nuclear power plant, meaning the time the
company has to construct the facility is much lower, therefore companies have a smaller
timeframes for financial risks occurring. The risks with building and operating a nuclear power
plant and a coal power plant are essentially the same, but coal plants have smaller construction
time frames. Therefore a rating of 4 was given for the financial risks of coal plants.
The way members of the public can force politicians to negatively impact nuclear power plants, coal
plants can be affected in the same manner. Although the risks with radioactive releases to the
public are limited in coal power plant, there are other releases which affect the public such as
greenhouse gases and smog. Therefore a rating of 1 was given for the political risks related to coal
power plants.
There are limited factors dealing with disaster risks related to coal power plants. Coal plants
release a large amount of emissions, but disaster risks are not a major factor; therefore a rating of 4
was given for the disaster risks.
Coal plants in South Africa are throughout the country and operating smoothly, therefore there is
availability of workers to operate such facilities. A rating of 4 was given for availability of workers.
Coal plants, much like nuclear power plants do not have the ability to operate on a smaller scale,
therefore a rating of 1 was given for this ability.
5.2 Completed Evaluation Criteria Chart Scores
Table 3. Electricity Totals
Source Score
Biomass 291
Coal 309
Natural Gas 293
Hydroelectric 313
Nuclear 315
Solar 312
Wind 306
27 | P a g e
Table 4. Transportation Totals
Source Score
Gasoline 160
Diesel 148
Electric 144
6. Application of Energy Charts to Projection Data
6.1 Electricity
The peak load of South Africa is approximately 50.9 GW according to the Study on Programme for
Infrastructure Development in Africa (PIDA). As stated previously, Eskom provides approximately
44 GW of energy to Africa alone; therefore the remaining energy belongs to other members of SAPP.
Currently Eskom is meeting the energy demands of South Africa, but in 2040 the peak base load will
increase. Table 5 below, describes the current electrical energy supply to South Africa.
Table 5. Current Electrical Output [3][29]
Source Energy Output (MW)
Coal 37745
Natural Gas 2426
Nuclear 1910
Wind 456
Hydroelectric 2000
Solar 30
Total 44567
For the obtained projected data towards 2030, the increase in demand is substantial, where it is
projected to increase by approximately 41000MW, which means almost doubling the installed
capacity of South Africa in 30 years. South Africa’s energy mix should be composed of a diverse
amount of energy sources.
There are going to be deficiencies between the installed capacities from 2013 to 2040, for the peak
loads and base loads. Table _. Provides the total potential energy deficits.
Table 6. Installed Capacity Deficits from 2013 to 2030
Base Load Requirements: 85241MW
Coal: 37745 MW
Nuclear: 1910 MW
Wind: 456 MW
Solar: 30 MW
Hydroelectric: 2000 MW
Natural Gas: 2426 MW
28 | P a g e
Difference: -40674 MW
There are major differences for the peak loads and the base loads in the year 2030. Therefore
addition of new energy sources and builds are necessary to bridge this large gap.
Nuclear energy, hydroelectric, solar and wind sources were given large scores using the
constructed evaluation criteria charts, where these values can be found in Table 3. Therefore more
and larger facilities should be integrated into South Africa’s energy supply mix for electricity, as
well as for bridging the gap between the base loads from now to 2030.
Since nuclear scored the highest rank of 315, the installed capacity should be increased greatly to
cover the base load. South Africa’s reactors produce approximately 900 MW of electricity to the
grid, by following this trend an installment of 16 new reactors will cover 14400 MW of electricity.
Solar energy can be installed throughout the north western desert of South Africa. If on average
they can produce 50 MW of electricity, then installing approximately 22 new solar farms
throughout South Africa, which will cover approximately 1100 MW of electricity.
Wind energy can be installed throughout South Africa, with a wind farm on average produces 50
MW, then installing approximately 30 wind farms, on and off shore will produce 1500 MW of
electricity.
Coal energy will play a large role in South Africa’s energy supply mix due to its abundance
throughout the country. With the addition of two coal-fired power stations having an installed
capacity of 4800 MW each, an additional 4 new coal-fired plants will be added to the energy supply
mix. Each plant will have an average of 3500 MW of electricity; therefore by 2030 coal will be
producing an additional 23600. Some coal-fired plants may be decommissioned throughout this
time period, therefore additional coal plants were implemented. Natural gas, imported hydro and
hydroelectric will combine to cover peak loads within South Africa.
6.2 Transportation
Transportation in South Africa is dominated by petrol and diesel, they both account for
approximately 80% of the demand for all liquid fuels [6].
If the current demand for petrol and diesel fuel is rising as time moves forward, then a need for
more crude oil is necessary. Crude oil is converted into diesel and petrol at Gas-To-Liquid facilities,
for example the facility owned by PetroSA in Mossel Bay.
The main sources of energy for transportation energy in the future will dominantly consist of
gasoline and diesel fuels. Electric and hybrid vehicles are well behind in reliability and usage;
therefore until new technological advances materialize, electric vehicles do not play a major role in
the future.
29 | P a g e
In the rating systems provided in Appendix C, gasoline was given a rating of 160, compared to
diesel and electric/hybrid vehicles were rated as 148 and 144, respectively. The rating for electric
vehicles was relatively higher than diesel due to emissions released and environmental factors.
From the calculated transportation projected data, diesel fuel was increasing relatively faster than
gasoline, as diesel had a larger slope of 228.56 compared to petrol’s slope of 146.77. Both sectors
are increasing shown by the linear extrapolation of retrieved data. The share changes can be related
to slow growth of the passenger sector and strong growth in the freight sector.
Technological advances can decrease the demand for diesel and petrol by implementing more
electric and hybrid vehicles to the transportation sector. Increased prices of crude oil can also
lower the demand, otherwise the demand for petrol and diesel will continue to rise in the future.
7. Conclusion
The purpose of this report was to create a Long Term Energy Plan for South Africa which entails
creating a long and sustainable energy supply mix. The plan is attempting to use the South Africa’s
resources while providing a clean, reliable and affordable energy plan for now and in the future.
The method for completing the creation of South Africa’s Long Term Energy Plan was constructing
evaluation criteria charts for determining which energy generating source is fits best with South
Africa economy, available resources, and several other factors.
Energy Projections were obtained for electricity and transportation within South Africa until the
year 2030. Projected energy demands were compared with current energy demands, which led to a
difference in energy demand between 2014 and 2040. To compensate for the difference energy
generating sources were introduced to bridge the gap.
For electricity, several energy options were implemented into South Africa’s energy supply mix.
This included additional nuclear power stations, solar farms, coal-fired plants, hydroelectric
stations, and wind farms. Transportation was also included in the long term energy plan which was
limited to petrol, diesel and electric/hybrid fuels of transportation.
Unfortunately for the scope of this Long Term Energy Plan, an analysis of thermal energy within
South Africa was not possible due to lack of available data. There are a multitude of other factors,
such as politics and money, which were not analyzed in depth which may contribute to the outcome
of the data.
30 | P a g e
Bibliography
[1] Eskom Holdings SOC Limited, "Map of Eskom power stations," Eskom Holdings SOC Limited,
2014. [Online]. Available:
http://www.eskom.co.za/Whatweredoing/ElectricityGeneration/PowerStations/Pages/Map_Of
_Eskom_Power_Stations.aspx. [Accessed 23 February 2014].
[2] U.S Energy Information Administration, "South Africa," U.S Energy Information Administration,
28 February 2014. [Online]. Available: http://www.eia.gov/countries/cab.cfm?fips=SF.
[Accessed March 2014].
[3] Eskom Holdings SOC Limited, "Generation plant mix," Eskom Holdings SOC Limited , 13 August
2012. [Online]. Available:
http://www.eskom.co.za/AboutElectricity/FactsFigures/Documents/GX_0001GenPlantMixRev1
3.pdf. [Accessed February 2014].
[4] National Electricity Regulator, "Electricity Supply Statistics 2001 for South Africa," National
Electricity Regulator, 2002. [Online]. Available:
http://www.nersa.org.za/Admin/Document/Editor/file/News%20and%20Publications/Public
ations/Archived%20Issues/Electricity%20Supply%20Statistics/ESS2001_o.pdf. [Accessed
March 2014].
[5] Depratment of Energy, "Integrated Resource Plan for Electricity 2010-2030," Department of
Energy, 11 March 2011. [Online]. Available:
http://www.energy.gov.za/IRP/irp%20files/IRP2010_2030_Final_Report_20110325.pdf.
[Accessed March 2014].
[6] H. W. A. K. G. P. J. N. D. S. M. H. T. A. Ogunlade Davidson, "Energy policies for sustainable
development in South Africa," Energy Research Centre, University of Cape Town, Cape Town,
April 2006.
[7] South Africa Petroleum Industry Association , "2011 Annual Report," Nova Communications Ltd,
March 2012.
[8] Duke Energy , "How Do Coal-Fired Plants Work?," Duke Eneregy Corporation, 2013. [Online].
Available: http://www.duke-energy.com/about-energy/generating-electricity/coal-fired-
how.asp. [Accessed 8 November 2013].
[9] Ontario Power Generation, "Nuclear Power," Ontario Power Generation Inc., 2013. [Online].
Available: http://www.opg.com/power/nuclear/. [Accessed 8 November 2013].
[10] R. M. Ambrosini, "Life extension of coal-fired power plants," International Energy Agency, 2005.
31 | P a g e
[11] U.S Energy Information Administration, "Updated Capital Cost Estimates for Utility Scale
Electricity Generating Plants," 2013. [Online]. Available:
http://www.eia.gov/forecasts/capitalcost/pdf/updated_capcost.pdf]. [Accessed 8 November
2013].
[12] Ontario Power Generation, "OPG," 2013. [Online]. Available: http://www.opg.com/power/.
[Accessed 9 October 2013].
[13] U.S. Energy Information Administration, "EIA," April 2013. [Online]. Available:
http://www.eia.gov/. [Accessed 12 November 2013].
[14] EnergyBC, "EnergyBC," University of Victoria, 2012. [Online]. Available:
http://www.energybc.ca/. [Accessed 13 November 2013].
[15] "South Africa’s first gas-fired power plant fully operational," South African Synthetic Oil Limited,
10 July 2013. [Online]. Available: http://www.sasol.co.za/media-centre/media-releases/south-
africa-s-first-gas-fired-power-plant-fully-operational. [Accessed March 2014].
[16] Ontario Power Authority, "Energy," 30 June 2013. [Online]. Available:
http://www.powerauthority.on.ca/electricity-contracts/combined-heat-power. [Accessed 10
October 2013].
[17] World Nuclear Association, "Nuclear Power in South Africa," World Nuclear Association, March
2014. [Online]. Available: http://www.world-nuclear.org/info/country-profiles/countries-o-
s/south-africa/. [Accessed March 2014].
[18] U.S. Nuclear Regulatory Commission , "The Pressurized Water Reactor (PWR)," U.S. Nuclear
Regulatory Commission , 29 March 2012. [Online]. Available: http://www.nrc.gov/reading-
rm/basic-ref/students/animated-pwr.html. [Accessed February 2014].
[19] C. H. Eccleston, F. March and T. Cohen, Inside Energy, Boca Raton: Taylor & Francis Group, 2012.
[20] T. Melville, "South Africa invests in biomass anergy," 5 January 2014. [Online]. Available:
http://www.energydigital.com/renewable_energy/south-africa-invests-in-biomass-energy.
[Accessed February 2014].
[21] Department of Energy, "solar-power," Department of Energy, [Online]. Available:
http://www.energy.gov.za/files/esources/renewables/r_solar.html. [Accessed February 2014].
[22] U.S Department of Energy, "How Do Wind Turbines Work?," U.S Department of Energy, 17
January 2013. [Online]. Available: https://www1.eere.energy.gov/wind/wind_how.html.
[Accessed 8 November 2013].
[23] The Wind Power, "South Africa," The Wind Power, March 2014. [Online]. Available:
32 | P a g e
http://www.thewindpower.net/country_windfarms_en_58_south-africa.php. [Accessed March
2014].
[24] P.-E. M. S. A. Søren Krohn, "The Economics of Wind Energy," European Wind Energy Association,
2009.
[25] General Electric Company, "Wind Turbines," General Electric Company, 2013. [Online].
Available: http://www.ge-energy.com/wind. [Accessed 9 November 2013].
[26] American Fueal & Petrochemical Manufacturers , "The Refining Process," AFPM, [Online].
Available: http://www.afpm.org/The-Refinery-Process/. [Accessed 9 November 2013].
[27] Canadian Renewable Fuels Association, "Biodiesel," CRFA, 2010. [Online]. Available:
http://www.greenfuels.org/en/resource-centre/biodiesel.aspx. [Accessed 9 November 2013].
[28] South African Petroleum Industry, "Industry Overview - South Africa Fuel Industry," SAPIA,
2013. [Online]. Available: http://www.sapia.co.za/industry-overview/fuel-industry.html.
[Accessed March 2014].
[29] R. S. B. K. Tumi Maphelele, "South Africa Solar Energy Technology Road Map," 10 May 2013.
[Online]. Available: http://www.sapvia.co.za/wp-content/uploads/2013/03/Solar-PV-Baseline-
for-South-Africa_Draft-2_2013-06-26.pdf. [Accessed February 2014].
[30] Ontario Waterpower, "Emergent Hydro Regulatory Best Practices - Canadian Regulatory
Regimes," 2013. [Online]. Available:
http://www.energybc.ca/cache/runofriver/Tami%20Sugarman%20_%20Approvals%20Presen
tation_May%204-11[1].pdf. [Accessed 14 November 2013].
[31] U.S Department of Energy , "All-Electric Vehicles: Compare Side-by-Side," U.S Department of
Energy , 19 November 2013. [Online]. Available: http://www.fueleconomy.gov/feg/evsbs.shtml.
[Accessed 19 November 2013].
[32] Waterpower, "Ontario's Primary Renewable Resource," Waterpower, 2013. [Online]. Available:
http://www.owa.ca/waterpower-information/waterpower/. [Accessed 13 November 2013].
[33] Solar Academy, "Ontario's FIT, MicroFIT Projects Subject to New Fees," Onraio Solar Academy, 9
March 2011. [Online]. Available: http://www.solaracademy.com/ontario/tag/solar-energy.
[Accessed 18 November 2013].
33 | P a g e
Appendix A – Evaluation Criteria Charts
Coal
Electricity Selection Criterion Weighting Factor (1-10) Rating Evaluation
Public Opinion 7 3 21
Cost
Operating Cost 9 3 27
Upfront Construction Cost 7 3 21
Resource Cost 3 4 12
Reliability 10 5 50
Key Impacts 8 1 8
Energy Output (MW) 9 4 36
Availability of Fuel 7 5 35
Risk Analysis
Financial 8 4 32
Political 4 1 4
Disaster 9 4 36
Availability to have Workers Run the
Plant
5 4 20
Ability to Operate on a Small Scale 7 1 7
Total 309
34 | P a g e
Coal plants may have a bad reputation with the public due to the many effects they impose;
producing a large amount of greenhouse gases and other pollutants into the atmosphere, such as
sulphur dioxides, nitrous oxides, mercury, etc. Many people do not want to live in a polluted and
smoggy area. Considering that coal is the leading provider of energy within South Africa, we can
assume that the public does tolerate and understand that coal is a large economical factor.
Therefore a rating of 3 was given.
Operating and maintenance costs for a coal power plant are at a medium level. They are higher than
natural gas operating and maintenance costs but lower or on par with other energy generating
options such as wind, solar, and nuclear. The values of the operating and maintenance costs range
roughly from $31.18 - $80.53/kW-a. The rating given for operating costs of coal power plants is a
value of 3.
Depending on the type of coal plants constructed, upfront construction costs are can vary and range
from approximately under $3,000/kW to just over $6,500/kW. Comparing the upfront construction
costs to other sources of energy production, this is within the medium range; therefore a rating of 3
was given.
The amount of coal used in a power plant to produce one kilowatt-hour is roughly 1.07 pounds of
coal, which in the long run, coal plants need a very large amount of coal to operate. In turn the
amount of coal needed for a power plant is fairly high; therefore coal would be in demand
increasing the price of coal. But South Africa has a very large reserve of coal therefore a rating of 4
was given.
Coal plants are very reliable, as they can be essentially turned on and off when needed. A rating for
reliability of coal plant was given a value of 5.
There are many key impacts with coal power plants, such as the release of greenhouse gases, and
several other hazardous pollutants to the atmosphere. These pollutants include nitrogen oxides,
sulphur dioxide, and mercury, all of which effect the environment negatively. Even with mitigation
processes, coal and fossil fuels make up a large portion of emissions in South Africa. South Africa
also has a large amount of coal plants supply a large portion of the energy to the country. Therefore
a rating of 1 was given for the key impacts for coal power plants.
Since coal-fired plants are the main generating energy source within South Africa, and they are
building two of the largest plants in the world, of approximately 4800MW each, they can provide a
large electrical output. Therefore a rating of 4 was given energy output.
Coal is the largest energy resource South Africa has to offer, where they are ninth among the world;
therefore a rating of 5 was given for resource availability.
Coal power plants can be built much faster than a nuclear power plant, meaning the time the
company has to construct the facility is much lower, therefore companies have a smaller
timeframes for financial risks occurring. The risks with building and operating a nuclear power
plant and a coal power plant are essentially the same, but coal plants have smaller construction
time frames. Therefore a rating of 4 was given for the financial risks of coal plants.
35 | P a g e
The way members of the public can force politicians to negatively impact nuclear power plants, coal
plants can be affected in the same manner. Although the risks with radioactive releases to the
public are limited in coal power plant, there are other releases which affect the public such as
greenhouse gases and smog. Therefore a rating of 1 was given for the political risks related to coal
power plants.
There are limited factors dealing with disaster risks related to coal power plants. Coal plants
release a large amount of emissions, but disaster risks are not a major factor; therefore a rating of 4
was given for the disaster risks.
Coal plants in South Africa are throughout the country and operating smoothly, therefore there is
availability of workers to operate such facilities. A rating of 4 was given for availability of workers.
Coal plants, much like nuclear power plants do not have the ability to operate on a smaller scale,
therefore a rating of 1 was given for this ability.
36 | P a g e
Hydroelectric
Public opinion is rated a 4 because of the neighboring communities that are near the dam being
built and running. The neighboring communities, mainly ones downstream, have to deal with;
Electricity Selection Criterion Weighting Factor (1-10) Rating Evaluation
Public Opinion 7 4 28
Cost
Operating Cost 9 5 45
Upfront Construction Cost 7 1 7
Resource Cost 3 5 15
Reliability 10 4 40
Key Impacts 8 4 32
Energy Output (MW) 9 2 18
Availability of Fuel 7 2 14
Risk Analysis
Financial 8 2 16
Political 4 4 16
Disaster 9 3 27
Availability to have Workers Run the
Plant
5 4 20
Ability to Operate on a Small Scale 7 5 35
Total 313
37 | P a g e
debris running downstream affecting surrounding ecosystems, potential flooding that may occur,
and worry about the dam breaking and causing massive amounts of damage.
Operating cost is rated at a 5 because once a hydro plant is built it is almost self-run. The water
comes in turns the turbine and then leaves. There is not much in operating costs mainly in
maintenance and those are low compared to other energy types [30].
Upfront construction cost is rated a 1 because depending on the size of the dam it could take up a
large amount of space. It has to be able to stretch across an entire river or part of a lake in order to
utilize the potential energy from the water source. This means a lot of construction above and
below water will take place and water displacement methods will be utilized.
Resource cost is rated a 5 because water is renewable and once in place there will always be water
unless an intense drought occurs. The water does not cost anything for it to run through the hydro
plant because of the way it utilizes water as a natural resource.
Reliability is rated a 4 because hydro plants have the ability to manage fluctuations in power [14]. It
can match what power is needed and it also uses a renewable resource which will last for hundreds
of years of designed and placed properly; if a drought does not occur and it does not break.
Key impacts is rated a 2 because of the long construction times and the construction debris.
Depending on the size of the dam it can take years to build and in this time debris is floating
downstream towards different ecosystems, trees and wildlife, where it can have a major impact.
Electric output for hydroelectric output is rated a 2 because South Africa does not have many water
sources which can generate a large amount of electricity. Although some hydroelectric stations
produce about 1000MW of energy, the amount of station locations are limited in South Africa. For
this reason a rating of 2 was given for resource availability.
Financial risk is rated a 2 because they are expensive to make and building it takes a long time
depending on the size [14].
The political risk for hydroelectric power was given a rating of 4 because the public typically
understand that renewable energy sources are more environmentally friendly than other sources of
energy, such as coal fired plants.
Disaster risk is rated a 3 because of the fact of flooding that causes methane gas to be produced
from vegetation and mercury release into the water from surrounding rocks [14].If the dam breaks
then there is major damage done to anything located downstream [14].
Availability to have workers run the plant is rated a 4 because hydro stations are mainly
self-sustainable [30] the only workers that need a large amount of knowledge are the maintaining
crew and the repair crews as well as some of the operations staff.
Ability to operate on a small scale is a 5 because a dam or a turbine can be put into a small river and
will produce small amounts of electricity.
38 | P a g e
39 | P a g e
Natural Gas
Public opinion for natural gas is rated a 4 because natural gas plants are still being constructed and
operated. Another reason is that they produce fewer emissions than coal plants which are better for
the environment.
Electricity Selection Criterion Weighting Factor (1-10) Rating Evaluation
Public Opinion 7 4 28
Cost
Operating Cost 9 5 45
Upfront Construction Cost 7 4 28
Resource Cost 3 2 6
Reliability 10 4 40
Key Impacts 8 4 32
Energy Output (MW) 9 2 18
Availability of Fuel 7 3 21
Risk Analysis
Financial 8 2 16
Political 4 3 12
Disaster 9 3 27
Availability to have Workers Run the
Plant
5 4 20
Ability to Operate on a Small Scale 7 2 14
Total 307
40 | P a g e
Operating cost is a 5 because they are low and there is not much need to interfere with the system
while under operations [14].
Upfront construction costs was given a rating of 4 because coal-fired plants can be converted to
natural gas plants, since South Africa has such a large amount of coal plants this can open the door
to natural gas plants to emerge.
Resource cost for natural gas was given a rating of 2 because South Africa does not have a large
reserve of natural gas compared to other countries; therefore the country needs to import a large
amount of the fuel. The rating for availability of fuel was given a 3 for the low reserves of natural
gas within South Africa, but having the ability to import from other countries.
Reliability is a 4 because natural gas plants are reliable but also can have issues depending on
natural gas shortages or leaks that can occur.
The key impacts is rated a 4 because a plant still produces emissions; the emissions are just less
than that of coal [14].The gas itself is also an emission if it gets into the atmosphere.
The energy output for natural gas plants is relatively low in South Africa because there are not a
large amount of plants and limited fuel. A conventional plant can have an installed capacity of about
300 MW according to the Ontario Power Authority, where if we compare to 4800MW coal plant
South Africa is constructing.
Financial risk was given a rating of 2 because natural gas is imported to South Africa, and if conflicts
arise between South Africa and the exporter a shortage of natural gas may occur. Political risk was
given a 3 because the government and the public may have different opinions on the use of natural
gas plants within South Africa.
Disaster risk is a 4 because not many things go wrong with natural gas. If there is a leak it dissipates
into the air quickly because it is lighter than air. The only issue would be in the lines where it could
seep into the ground and cause soil problems or if it was ignited while it was escaping. The
greenhouse gases are also much less than that of coal that are emitted into the atmosphere during
operations [14].
Availability to have workers run the plant is rated a 4 because there does not need too many
experts in the plant because of the simple design and low disaster risk involved.
Ability to operate on a small scale is rated a 2 because there are only plants that are used for
producing electricity for many homes and other efficient means for electricity on a smaller scale if
needed [14].
41 | P a g e
Nuclear
A rating of 3 was given for the public opinion of nuclear power in South Africa. This rank was given
because the government is attempting to inform the public about the benefits and hazards of
nuclear energy by having nuclear awareness campaigns.
Electricity Selection Criterion Weighting Factor (1-10) Rating Evaluation
Public Opinion 7 3 21
Cost
Operating Cost 9 2 18
Upfront Construction Cost 7 4 28
Resource Cost 3 4 12
Reliability 10 5 50
Key Impacts 8 4 32
Energy Output (MW) 9 4 36
Availability of Fuel 7 4 28
Risk Analysis
Financial 8 2 16
Political 4 3 12
Disaster 9 5 45
Availability to have Workers Run the
Plant
5 2 10
Ability to Operate on a Small Scale 7 1 7
Total 315
42 | P a g e
The rating value of 2 was given for the operating costs. The operating and maintenance costs of a
typical nuclear power plant are a bit higher compared to other energy sources and the amount of
energy produced by a plant.
The upfront construction costs were given a rating of 4. The value was chosen because the average
capital cost of a nuclear power plant is $2,845/kw, which can be compared to capital costs of other
plants. The capital cost for a combined cycle natural gas plant is approximately $917/kw, but on the
other hand for a typical dual flash geothermal plant the capital cost is approximately $6,243/kw.
This shows that nuclear power reside in the middle of capital costs for different energy production
plants.
The cost of fuel is given a rating of 4 because the amount of fuel being used in a nuclear plant is
relatively small compared to other means of electricity generation such as coal and natural gas. The
only downside is the processes of enriching the fuel if using Light Water Reactors (LWR).
Power plants are particularly reliable; they have many redundancies to components to ensure the
system is available during maintenance and other events. These redundancies ensure that the
chance for an accident is relatively low. Components performing the same tasks are generally
separated from each other, so if a failure occurs on one component it will not affect the other.
Systems, equipment and structures in nuclear reactors are all seismically and environmentally
qualified to function under these conditions. With all measures taken to ensure the reactor is
available and reliable, the rating given was a 5.
There are several impacts that occur while operating a nuclear power plant. There are risks of a
nuclear meltdown occurring, but are mitigated by nuclear reactors having reliable shutdown
systems and a numerous amount of redundancies. Another impact is the storage and waste disposal
of spent fuel. Reactors produce a large quantity of fuel and this fuel is radioactive and heated;
therefore storage facilities and waste disposal facilities are needed. Since a nuclear meltdown is a
severe impact, and fuel disposal does not have a true solution a rating of 4 is given.
South Africa’s only nuclear station has an installed capacity of 1800MW, which is approximately 5%
of the country’s energy demand. A rating of 4 was given for the electrical output of nuclear power
plants in South Africa.
Since South Africa has a particularly large reserve of uranium, but the fuel must be processed
elsewhere, the availability of fuel is given a rating of 4.
There are many risks while operating and constructing nuclear power plants, for example, during
the building phases of a reactor, there is a risk that construction may come to a stop, this could
unfortunately lead to closure of the plant altogether. A nuclear power plant may take a longer
period of time to construct than other energy sources; therefore it has a large timeframe for a
problem to occur economically and financially leading to stoppage of construction. Therefore a
rating of 2 was given for the financial risk of a nuclear power plant.
There is a high political risk for nuclear power plants. Some public members may cause political
figures to act negatively towards power plants by lobbying; this can lead to the stoppage of
43 | P a g e
construction or operations. As politicians want to gain votes by supporting their community they
will attempt to move forward in the public direction. A rating of 3 was given for the political risk of
nuclear power plants.
Another example is the risk of a nuclear meltdown occurring, but necessary regulations and
processes are completed to mitigate meltdowns. These measures include having many barriers and
redundancies to prevent any harm to the environment and the public. Nuclear power plants are
also seismically qualified as well as qualified for tornados to prevent disasters from occurring. A
large amount of effort to ensure safety against disasters is prevented; therefore the rating given for
disaster risk was a 4.
The availability of workers in South Africa for nuclear power plant is most likely limited due to
education standards and program availability; therefore a rating of 2 was given for the availability
of workers to operate a plant.
Nuclear power plant reactors can be reduced in size, but they are typically research reactors not
used for electricity production; therefore a rating of 1 was given for the ability for a nuclear power
plant operating on a small scale.
44 | P a g e
Solar
The public opinion of solar was given a rating of 4 because people like solar because it is renewable,
can help save money in the long run, and is clean. A downside is the expensive costs.
Operating costs for solar is rated a 4 because they are low the only costs are for maintenance and
solar is usually easy to maintain [14].
Electricity Selection Criterion Weighting Factor (1-10) Rating Evaluation
Public Opinion 7 4 28
Cost
Operating Cost 9 4 36
Upfront Construction Cost 7 2 14
Resource Cost 3 5 15
Reliability 10 3 30
Key Impacts 8 3 24
Energy Output (MW) 9 1 9
Availability of Fuel 7 4 28
Risk Analysis
Financial 8 2 16
Political 4 3 12
Disaster 9 5 45
Availability to have Workers Run the
Plant
5 4 20
Ability to Operate on a Small Scale 7 5 35
Total 312
45 | P a g e
Upfront Construction costs are very high because the technology is expensive and there needs to be
a large amount of area to produce a significant amount of electricity. Therefore a rating of 2 was
given.
Resource cost is a 5 because solar uses the sun’s energy which is renewable and does not cost
anything.
Reliability is a 3 because solar does not work when there is no sun, at night or very cloudy days
[14].
Key Impacts is a 3 because solar does not produce emissions but it does take up a large amount of
land that could be used for farming or other, possibly more useful activities.
Energy output is rated a 1 because solar is not efficient and needs a lot of space and sun to produce
enough energy to power homes [14].
Availability of fuel is rated a 4 because the sun is renewable and is always there but there are
cloudy periods and nights that have to be dealt with [14].
Financial risk is a 2 because solar is very expensive and there are other electricity producing means
that are less expensive. There are also a lot of backup machines that are needed in case there is no
sun which is also expensive and the cost of land is not cheap either.
Political risk is rated a 3 because they like the public opinion and the clean side to solar; but the
expensive part and the fact that it takes up a lot of land causes politicians to not favour solar plants.
Disaster risk is rated a 5 because there is no chance of anything truly harmful happening with solar.
Availability to have workers run the plant is rated a 4 because the only experts needed are those
whole calculate the best angles for the solar collectors and those who have to do maintenance on
them.
Ability to operate on a small scale is rated a 5 because solar does not produce much energy and is
not efficient; it is easy for solar to produce small amounts of electricity or thermal energy.
46 | P a g e
Wind
Generally the public opinion on renewable energy sources are particularly high because there are
little no releases of greenhouse gases or harmful emissions. But with wind farms and wind turbines
many people do not find them aesthetically pleasing, and do not want them around their homes.
The opinion appears to be in the middle; therefore a rating of 3 was given for the public opinion of
wind energy.
Electricity Selection Criterion Weighting Factor (1-10) Rating Evaluation
Public Opinion 7 3 21
Cost
Operating Cost 9 3 27
Upfront Construction Cost 7 3 21
Resource Cost 3 5 15
Reliability 10 2 20
Key Impacts 8 3 24
Energy Output (MW) 9 3 27
Availability of Fuel 7 4 28
Risk Analysis
Financial 8 2 16
Political 4 3 12
Disaster 9 5 45
Availability to have Workers Run the
Plant
5 3 15
Ability to Operate on a Small Scale 7 5 35
Total 306
47 | P a g e
Operating and maintenance cost of onshore and offshore wind farms is roughly $39.55/kw-a and
$74/kW-a, respectively. Comparing these costs to other sources of energy, such as coal and solar
power, they are roughly in the same range. Therefore a rating of 3 was given for the operating costs
for a wind farm.
Upfront construction costs for a wind farm can be a high cost, access roads may need to be built,
and these roads must be able to carry a truck holding a long turbine blade. On offshore wind farms
the costs are even higher, for example for an onshore wind farm the capital cost is approximately
$2213/kW, while for an offshore farm it is $6230/kW. Comparing these to other means of energy
production, they are average values; therefore a rating of 3 was given for the upfront construction
costs.
Since wind is always available, the resource costs are zero, therefore a rating of 5 was given.
Although wind may be available and free it may not produce enough of the energy needs because
wind is not the most reliable source of energy production. Therefore a rating 2 was given for the
reliability of wind energy.
Key impacts related to wind energy are relatively negligible. Wind farms produce little to no
greenhouse gases during operation and is has a renewable energy resource. A minor impact may be
finding and utilizing the appropriate land to construct a thriving wind farm. A wind farm needs an
open concept to ensure wind flows through the farm. Since there are no major impacts related to
wind energy, a rating of 3 was given.
A typical wind farm can range from 30 MW to 400 MW depending on the size of the farm and its
location, for example onshore or offshore. Wind energy has a promising outlook on energy output;
therefore a rating of 3 was given for energy output.
There are political risks related to wind energy, such as public complaining about noise pollution
and aesthetics, which can lead to lobbyists and political figures attempting to tarnish the idea of
wind energy. Therefore the rating given was a 3 for the political risk of wind energy. Wind energy
does not have any major disaster risks during operation; therefore a rating of 5 was given.
Wind farms may be located in remote areas, therefore the amount of people able to work at a wind
farm are fairly small. Since many people do not like the way wind farms appear, they are moved to
other locations further from the general public; therefore a rating of 3 is given for the availability of
workers to operate the farm.
Wind turbines are very versatile and be used in a smaller scale environment if necessary. A single
turbine can produce anywhere from 1MW to 4.1 MW; therefore small farms can be constructed, or
single use turbines can be implemented. A rating of 5 was given for the ability to operate at a
smaller scale.
48 | P a g e
Biomass
The public opinion for biomass is rated a 4 because people like the idea behind renewable and clean
energy sources and biomass is both. The only factor is that it is new and people are still uneducated
about this energy source.
Electricity Selection Criterion Weighting Factor (1-10) Rating Evaluation
Public Opinion 7 4 28
Cost
Operating Cost 9 2 18
Upfront Construction Cost 7 3 21
Resource Cost 3 4 12
Reliability 10 3 30
Key Impacts 8 4 32
Energy Output (MW) 9 3 27
Availability of Fuel 7 4 28
Risk Analysis
Financial 8 3 24
Political 4 2 8
Disaster 9 4 36
Availability to have Workers Run the
Plant
5 4 20
Ability to Operate on a Small Scale 7 1 7
Total 291
49 | P a g e
Operating cost is a 2 because a plant needs to be maintained; the burnt biomass has to be cleaned
every once in a while from inside the plant [14]. It is expensive to close down a plant for even short
amounts of time.
Upfront construction cost is rated at a 3 because it is setup as a typical plant and coal plants can be
converted into biomass plants. It is expensive to buy land to grow the biomass and there still needs
money put into the conversion [12].
Resource cost is a 4 because it is renewable but the biomass has to be bought and planted in an area
that may cost money.
Reliability is rated a 3 because if anything happens to the crops used for biomass than there is no
power being produced and the plan needs cleaning every once and a while so it is shut down during
this activity [14].
Key Impacts is a 4 because biomass can be regrown and the carbon emissions are the same as the
ones released that are in the plant anyways so it is a cycle [14]. There are some emissions due to the
machines needed but they are low. There is a fair bit of biomass needed so there is a large area that
will be without biomass until new biomass grows there [14].
In South Africa the output for biomass energy is relatively small, but a biomass plant can have an
installed capacity of 200MW, but this uses a lot of fuel to reach this capacity; therefore a rating of 3
given for energy output.
Availability of fuel is rated a 4 because biomass can be grown and is renewable but large amounts
are needed and if not enough land is secured there than there would be waiting for the biomass to
grow which could take a long time.
Financial risk is rated a 3 because if something happened to the crops than there would be money
loss and there are cheaper methods to produce power that are more favourable.
Political risk is rated a 2 because it is a new energy producing form and many people do not know
about it or its consequences. This creates an uncertainty with politicians and they favour low cost
and high power which biomass is not.
Disaster risk is rated a 4 because there is not much disaster within the plant the crops that go along
with a biomass plant may have some danger involved from the weather but it will grow again.
Availability to have workers run the plant is rated a 4. The 4 is given to the plants that have the
simple burning-to-boil-water design which can be run by non-experts that can shovel or do heavy
labour as well as watch temperature and steam gages. Biomass is one of these plants and only
needs experts to keep watch that everything is running smoothly.
Ability to operate on a small scale is a 1 because it is a standard plant that produces power for many
homes and does not have very much use or is not very efficient for running for low power designs.
50 | P a g e
51 | P a g e
Appendix B – Transportation Evaluation Criteria Charts
Diesel
Transportation Selection Criterion Weighting Factor (1-10) Rating Evaluation
Public Opinion 6 3 18
Fuel Cost 10 4 40
Reliability 9 4 36
Key Impacts 7 2 14
Availability of Fuel 8 5 40
Total 148
In regards to public opinion of diesel fuel used in transportation, there is no opinion from the
general public because diesel fuel is consumed less as much compared to gasoline powered vehicles
for transportation. Since diesel fuels are more directly related to truck drivers and companies, the
general public does not bash or praise the use of diesel fuel. A rating of 3 was given for the public
opinion of diesel fuel used in transportation.
Fuel cost is an important aspect when dealing with transportation. Prices vary for diesel fuel
depending on the location, and also the town or city. The rating for the fuel cost was given a value of
4.
Diesel fuel engines are a particularly reliable source of transportation. The diesel engine has been
around for a long time therefore being an older technology. With an old product, maintenance costs
are decreased and increase the availability of the system. Since the concept of a diesel engine is
particularly old and is reliable system, a rating of 4 was given for the reliability of diesel energy.
There are several impacts related to the use of diesel energy, which include the release of toxic
emissions. Diesel exhaust contains air contaminants such as carbon monoxide, sulphur dioxide,
mercury compounds, etc. Diesel engines release more emissions than a regular gasoline engine
under equivalent loads and conditions. Therefore a rating of 2 was given for the key impacts related
to diesel energy.
Diesel is highly available for consumers to use at a relatively low price. Diesel is manufactured in
the same process as obtaining gasoline through a crude oil distillation tower. Since crude oil does
not need to be refined nearly as much to produce diesel compared to gasoline, it is a cheaper fuel. A
rating of the 5 was given for the availability of diesel fuel.
52 | P a g e
Gasoline
Transportation Selection Criterion Weighting Factor (1-3) Rating Evaluation
Public Opinion 6 4 24
Fuel Cost 10 3 30
Reliability 9 5 45
Key Impacts 7 3 21
Availability of Fuel 8 5 40
Total 160
The public opinion of gasoline is a 4 because it is needed in most cars that are on the road and it is
readily available and easy to access. There are harmful emissions that come from combustion of
gas, which lowers the opinion to a 4.
Fuel cost is rated a 3 because gasoline is not the most expensive but it is fairly expensive especially
since most people need it on a weekly bases.
Reliability is rated a 5 because gasoline has been proven to be reliable for years it gets people a far
distance and does not do harm to an automobile.
Key impacts is rated a 3 due to the harmful emissions that are produced by gasoline combustion in
an engine.
Availability of fuel is rated a 5 because there are gasoline stations everywhere, also multiple ones in
that area, there are automobiles because it is the most widely used form for energy used in an
automobile.
Electric/Hybrid
Transportation Selection Criterion Weighting Factor (1-3) Rating Evaluation
Public Opinion 6 4 24
Fuel Cost 10 4 40
53 | P a g e
Reliability 9 4 36
Key Impacts 7 4 28
Availability of Fuel 8 2 16
Total 144
There is a relatively high public opinion with electric and hybrid cars, mostly because these cars are
a clean alternative to gasoline and diesel powered engines. There are several disadvantages with
electric cars, such as the batteries take a required amount of time to recharge. A rating of 4 was
given for the public opinion of electric and hybrid vehicles.
Many electric vehicles have operate from approximately 105 MPGe (miles per gallon equivalent),
meaning the distance travelled per energy consumed. 1 gallon of gasoline is equivalent to 33.7 kWh,
therefore electric vehicles on average annually cost approximately $600 based on 15,000 miles
annual driving and electricity cost of $0.12/kWh [31]. A rating of 4 was given for fuel cost. A rating
of 4 was given for fuel cost.
Electric and hybrid vehicles are not reliable compared to internal combustion engines such as
diesel and natural gas. Electric vehicles are a fairly new technology and are still under development;
therefore the long term effects are unknown. A rating of 4 was given for the reliability of electric
and hybrid vehicles.
Key impacts related to electric and hybrid cars are mass battery production, which leads to larger
amounts of waste. Fortunately, electric car batteries can be recycled in the same manner regular
batteries for cellphones and laptops are recycled. Another key impact is if an entire population
switches to electric vehicles, the grid must be able to supply the necessary amount of energy.
Therefore a rating of 4 was given for key impacts.
There are no charging stations in the same manner gasoline stations exist; therefore fuel must be
taken from the owner’s home. Since electric cars can only work for so long, the user must be able to
make a round trip on every trip. Also, if charging were available for electric cars at stations it would
take fairly long to recharge the battery; therefore a rating of 2 was given for availability of fuel.

Contenu connexe

Similaire à SA Long Term Energy Plan Analysis

CC janneker thesis - 14 may 2012 final
CC janneker   thesis - 14 may 2012 finalCC janneker   thesis - 14 may 2012 final
CC janneker thesis - 14 may 2012 finalChantal Janneker
 
Determining Public Perceptions and understanding of the role of Nuclear Techn...
Determining Public Perceptions and understanding of the role of Nuclear Techn...Determining Public Perceptions and understanding of the role of Nuclear Techn...
Determining Public Perceptions and understanding of the role of Nuclear Techn...Chantal Janneker
 
Ethiopia Biomass energy strategy Ethiopia.pdf
Ethiopia Biomass energy strategy Ethiopia.pdfEthiopia Biomass energy strategy Ethiopia.pdf
Ethiopia Biomass energy strategy Ethiopia.pdfAbraham Lebeza
 
Ethiopia Biomass energy strategy Ethiopia.pdf
Ethiopia Biomass energy strategy Ethiopia.pdfEthiopia Biomass energy strategy Ethiopia.pdf
Ethiopia Biomass energy strategy Ethiopia.pdfAbraham Lebeza
 
UNICEF Sustainable Energy for Children 2016_FINAL_A4
UNICEF Sustainable Energy for Children 2016_FINAL_A4UNICEF Sustainable Energy for Children 2016_FINAL_A4
UNICEF Sustainable Energy for Children 2016_FINAL_A4Jeremiah Mushosho
 
0610 w14 qp_31
0610 w14 qp_310610 w14 qp_31
0610 w14 qp_31Omniya Jay
 
Mexico Renewables Potential- Academic Paper
Mexico Renewables Potential- Academic PaperMexico Renewables Potential- Academic Paper
Mexico Renewables Potential- Academic PaperEnergy for One World
 
Implementation of Renewable Energy Technologies in Zimbabwe
Implementation of Renewable Energy Technologies in Zimbabwe  Implementation of Renewable Energy Technologies in Zimbabwe
Implementation of Renewable Energy Technologies in Zimbabwe ZY8
 
1.-Potential-Bright-Spots-for-FBF_Turkana_GIZ-Kenya_Final.pdf
1.-Potential-Bright-Spots-for-FBF_Turkana_GIZ-Kenya_Final.pdf1.-Potential-Bright-Spots-for-FBF_Turkana_GIZ-Kenya_Final.pdf
1.-Potential-Bright-Spots-for-FBF_Turkana_GIZ-Kenya_Final.pdfssuser2034f6
 
UETCL report
UETCL reportUETCL report
UETCL reportJim Kats
 
Thesis mujgan omary
Thesis mujgan omaryThesis mujgan omary
Thesis mujgan omaryMujgan Omary
 
Production of rare earth oxides
Production of rare earth oxidesProduction of rare earth oxides
Production of rare earth oxidesalan59
 
Final Year Project_(681181)
Final Year Project_(681181)Final Year Project_(681181)
Final Year Project_(681181)Sam Forghani
 
Feasibility study coconut industry
Feasibility study coconut industryFeasibility study coconut industry
Feasibility study coconut industrySetiono Winardi
 
Biology_paper_3__HL.pdf
Biology_paper_3__HL.pdfBiology_paper_3__HL.pdf
Biology_paper_3__HL.pdfNancyKoskei
 
Electric Motors in the Energy Transition
Electric Motors in the Energy TransitionElectric Motors in the Energy Transition
Electric Motors in the Energy TransitionLeonardo ENERGY
 
Worcester Art Museum: Green Technology Evaluation
Worcester Art Museum: Green Technology EvaluationWorcester Art Museum: Green Technology Evaluation
Worcester Art Museum: Green Technology EvaluationFlanna489y
 

Similaire à SA Long Term Energy Plan Analysis (20)

Hssttx4
Hssttx4Hssttx4
Hssttx4
 
CC janneker thesis - 14 may 2012 final
CC janneker   thesis - 14 may 2012 finalCC janneker   thesis - 14 may 2012 final
CC janneker thesis - 14 may 2012 final
 
Determining Public Perceptions and understanding of the role of Nuclear Techn...
Determining Public Perceptions and understanding of the role of Nuclear Techn...Determining Public Perceptions and understanding of the role of Nuclear Techn...
Determining Public Perceptions and understanding of the role of Nuclear Techn...
 
Ethiopia Biomass energy strategy Ethiopia.pdf
Ethiopia Biomass energy strategy Ethiopia.pdfEthiopia Biomass energy strategy Ethiopia.pdf
Ethiopia Biomass energy strategy Ethiopia.pdf
 
Ethiopia Biomass energy strategy Ethiopia.pdf
Ethiopia Biomass energy strategy Ethiopia.pdfEthiopia Biomass energy strategy Ethiopia.pdf
Ethiopia Biomass energy strategy Ethiopia.pdf
 
UNICEF Sustainable Energy for Children 2016_FINAL_A4
UNICEF Sustainable Energy for Children 2016_FINAL_A4UNICEF Sustainable Energy for Children 2016_FINAL_A4
UNICEF Sustainable Energy for Children 2016_FINAL_A4
 
0610 w14 qp_31
0610 w14 qp_310610 w14 qp_31
0610 w14 qp_31
 
H00202643.docx
H00202643.docxH00202643.docx
H00202643.docx
 
Mexico Renewables Potential- Academic Paper
Mexico Renewables Potential- Academic PaperMexico Renewables Potential- Academic Paper
Mexico Renewables Potential- Academic Paper
 
Implementation of Renewable Energy Technologies in Zimbabwe
Implementation of Renewable Energy Technologies in Zimbabwe  Implementation of Renewable Energy Technologies in Zimbabwe
Implementation of Renewable Energy Technologies in Zimbabwe
 
1.-Potential-Bright-Spots-for-FBF_Turkana_GIZ-Kenya_Final.pdf
1.-Potential-Bright-Spots-for-FBF_Turkana_GIZ-Kenya_Final.pdf1.-Potential-Bright-Spots-for-FBF_Turkana_GIZ-Kenya_Final.pdf
1.-Potential-Bright-Spots-for-FBF_Turkana_GIZ-Kenya_Final.pdf
 
UETCL report
UETCL reportUETCL report
UETCL report
 
Thesis mujgan omary
Thesis mujgan omaryThesis mujgan omary
Thesis mujgan omary
 
Production of rare earth oxides
Production of rare earth oxidesProduction of rare earth oxides
Production of rare earth oxides
 
Final Year Project_(681181)
Final Year Project_(681181)Final Year Project_(681181)
Final Year Project_(681181)
 
Feasibility study coconut industry
Feasibility study coconut industryFeasibility study coconut industry
Feasibility study coconut industry
 
Biology_paper_3__HL.pdf
Biology_paper_3__HL.pdfBiology_paper_3__HL.pdf
Biology_paper_3__HL.pdf
 
Fabrication of mosfets
Fabrication of mosfetsFabrication of mosfets
Fabrication of mosfets
 
Electric Motors in the Energy Transition
Electric Motors in the Energy TransitionElectric Motors in the Energy Transition
Electric Motors in the Energy Transition
 
Worcester Art Museum: Green Technology Evaluation
Worcester Art Museum: Green Technology EvaluationWorcester Art Museum: Green Technology Evaluation
Worcester Art Museum: Green Technology Evaluation
 

SA Long Term Energy Plan Analysis

  • 1. UOIT Long Term Energy Plan of South Africa Undergraduate Thesis II Faculty of Energy Systems and Nuclear Science University of Ontario Institute of Technology April 2014 Author Kiran Boochoon Supervisors Dr. M. Kaye Dr. D. Hoornweg Dr. J. McKellar
  • 2. 1 | P a g e Acknowledgements I would like to thank all of the people who helped and provided support during the writing of this thesis. Most importantly, I would like to thank the thesis supervisors, Dr. Kaye, Dr. McKellar, and Dr. Hoornweg, for their time, support, and comments throughout this whole process.
  • 3. 2 | P a g e Table of Contents 1. Introduction..................................................................................................................................................................... 4 2. Background of South Africa....................................................................................................................................... 4 3. Energy Demand and Projections...........................................................................................................................11 3.1 Electricity – Current Energy Demand........................................................................................................11 3.2 Electricity – Future Energy Demand..........................................................................................................13 3.3 Thermal Energy Demand................................................................................................................................15 3.4 Transportation – Current Energy Demand..............................................................................................16 3.5 Transportation – Future Energy Demand................................................................................................18 4. South Africa’s Energy Supply..................................................................................................................................18 4.1 Electricity Generation.......................................................................................................................................18 4.1.1 Coal.................................................................................................................................................................18 4.1.2 Hydroelectric..............................................................................................................................................19 4.1.3 Natural Gas..................................................................................................................................................20 4.1.4 Nuclear..........................................................................................................................................................20 4.1.5 Biomass.........................................................................................................................................................21 4.1.6 Solar ...............................................................................................................................................................21 4.1.7 Wind...............................................................................................................................................................22 4.2 Transportation Energy.....................................................................................................................................23 4.2.1 Diesel .............................................................................................................................................................23 4.2.2 Gasoline ........................................................................................................................................................23 5. Energy Evaluation Charts.........................................................................................................................................24 5.1 Example Evaluation Criteria Chart: Coal..................................................................................................24 5.2 Completed Evaluation Criteria Chart Scores ..........................................................................................26 6. Application of Energy Charts to Projection Data............................................................................................27 6.1 Electricity...............................................................................................................................................................27 6.2 Transportation....................................................................................................................................................28 7. Conclusion.......................................................................................................................................................................29 Bibliography ............................................................................................................................................................................30 Appendix A – Evaluation Criteria Charts.....................................................................................................................33 Coal.........................................................................................................................................................................................33 Hydroelectric......................................................................................................................................................................36 Natural Gas..........................................................................................................................................................................39
  • 4. 3 | P a g e Nuclear..................................................................................................................................................................................41 Solar .......................................................................................................................................................................................44 Wind.......................................................................................................................................................................................46 Biomass.................................................................................................................................................................................48 Appendix B – Transportation Evaluation Criteria Charts.....................................................................................51 Diesel .....................................................................................................................................................................................51 Gasoline ................................................................................................................................................................................52 Electric/Hybrid..................................................................................................................................................................52 Figure 1. South African Population Density.................................................................................................................. 5 Figure 2. Eskom’s power stations located in South Africa ..................................................................................... 7 Figure 3. Coal Reserve Holders of the World.............................................................................................................10 Figure 4. Energy flow chart of the Electricity Distribution in South Africa...................................................11 Figure 5. South Africa’s Weekday Electricity Demand Profile............................................................................12 Figure 6. Energy Reserves of South Africa..................................................................................................................15 Figure 7. Energy Sources Usage for Households in 2001 .....................................................................................16 Figure 8. Consumption of Petroleum Products from 1988 to 2010.................................................................18 Figure 9. Pressurized Water Reactor ............................................................................................................................21 Table 1. Outlook of South Africa Energy Demand (2011 – 2040).....................................................................14 Table 2. Fuel consumption of South Africa Between 1988 to 2010 (Millions of Litres) .........................17 Table 3. Electricity Totals...................................................................................................................................................26 Table 4. Transportation Totals ........................................................................................................................................27 Table 5. Current Electrical Output .................................................................................................................................27 Table 6. Installed Capacity Deficits from 2013 to 2030.........................................................................................27
  • 5. 4 | P a g e 1. Introduction Long Term Energy Plans are used to provide a sustainable energy profile for a country to be cost effective, reliable, and lead towards cleaner energy. During Thesis I, a planned methodology was designed to construct a long term energy plan to any given country. The designed methodology was first used to create a plan for Ontario, which was then compared to an existing long term energy plan constructed by the government of Ontario. The designed energy plan was proven to be similar to the already existing developed plan; therefore allowing the use for the methodology for several other countries. The purpose of Thesis II was to implement the methodology to South Africa and develop a long term energy plan to be economically sound, reliable, and to have a cleaner energy future. Within Ontario’s long term energy plan cost analysis and key impacts were not incorporated; this designed methodology takes into account for these factors in an attempt to focus on every aspect to construct a sustainable energy program for South Africa. The designed methodology was constructed to focus on electricity, thermal and transportation energy, where projections and evaluation charts would be used to determine how much and what type of energy would be needed for the future of South Africa. The proposed future energy supply mix will be based on a rating system, as developed and justified in the methodology, and then applied to the demand of the region For the purposes of this report, efforts in conservation, smart meters and transmission services will be excluded; these particular aspects are typically dependant on funding and programs from the government and while they are relevant to a long term energy plan, are beyond the scope of this report. Unfortunately, in regards to thermal energy, projections were difficult to obtain, possibly due to the lack of any projections completed by the government South Africa, or any other third party; therefore proposed future supply mix for thermal energy will not be included within this report. 2. Background of South Africa South Africa is located at the southern point in Africa between the Indian and Atlantic Ocean. South Africa is a midsize country; approximately one eighth the size of the United States. Namibia, Botswana, Zimbabwe and Mozambique all border South Africa, where the small country of Lesotho is embedded within South Africa. South Africa has a wide variety of climate and topography, consisting of rocky hills and mountains, which can be very dry, as well as extremely hot in the summer and icy during the winter. The eastern coastline of South Africa has well watered and lush land, where it is free from frost throughout the year. The southern coast also consists of green land but not as tropical as the eastern coastline. South Africa`s southern west coast consists of wet winters and hot and dry
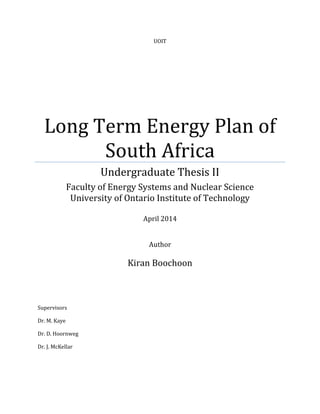
  • 6. 5 | P a g e summers. Temperatures in South Africa can range from 50 oC to -18.3 oC, depending on the specific region. The biggest neighbours of South Africa consist of the Indian and Atlantic oceans surrounding the east, west and southern coastlines. There are several small rivers leading towards the coastlines, none of which useful for natural harbours. Two major rivers are located within South Africa; the Limpopo and the Orange. The Limpopo is shared with Zimbabwe in the north, while the Orange River runs from east to west with variable flow across the central landscape, draining to Atlantic Ocean. The population of South Africa is approximately 48.6 million people, where the median age is 25.5 for both men and women. The population growth rate of South Africa is approximately 0.45%, estimated in 2013. A population density map of South Africa is presented below showing the most and least populated areas of South Africa. Figure 1. South African Population Density
  • 7. 6 | P a g e Map of population density in South Africa <1 /km² 1–3 /km² 3–10 /km² 10–30 /km² 30–100 /km² 100–300 /km² 300–1000 /km² 1000–3000 /km² >3000 /km²
  • 8. 7 | P a g e Figure 2. Eskom’s power stations located in South Africa [1]
  • 9. 8 | P a g e Shown above in Figure 2, we can see that Eskom holds a large share of the power generating stations within South Africa. Eskom supplies approximately 95% of South Africa’s electricity, where the remaining supply comes from independent power producers and importing from other countries [2]. South Africa’s energy mix has a variety of different generating stations, such as coal, natural gas, hydro-electric, and nuclear, as well as renewable energy, such as solar and wind farms. The north western portion of South Africa is not particularly populated; therefore there are not many power generation stations. The largest portion of electricity production comes from coal-fired plants, which operate 24 hours a day. The country has limited proven reserves for oil and natural gas; therefore coal is the main provider, producing approximately 90% of the country’s energy [2]. The installed total net output of the coal-fired plants is 34 952 MW, while the total installed capacity from Eskom is approximately 44 084 MW. Eskom also has a new build programme which will add to the installed capacity by approximately 11 032 MW [3]. Below is a list of all power generating stations operated by Eskom within South Africa.
  • 10. 9 | P a g e
  • 11. 10 | P a g e According to BP’s statistical review, South Africa has an estimated coal reserve of 30.2 million short tons, which accounts for 4% of the entire worlds coal reserves. Since coal is approximately 70% South Africa’s primary energy consumption it plays a large economical role. Figure 3. Coal Reserve Holders of the World [2]
  • 12. 11 | P a g e South Africa also has a relatively large amount of Uranium reserves, where there world reserve percentage is approximately 1%. Of the several major African producers of Uranium 3. Energy Demand and Projections 3.1 Electricity – Current Energy Demand There are many sectors of South Africa which need large amounts of electricity to continue for operation, which include mining, industrial, and commercial processes. Eskom, producer of approximately 95% of power generated within South Africa supplied approximately 55% directly to end users; therefore domestic, mining, agriculture, industrial, etc. The remaining energy produced by Eskom is purchased by Municipal and other distributors, where it is purchased by the end user [4]. Below in Figure 4. we can see how the distribution of energy was conducted in 2001. This distribution may change in the future, but will have little to no effect on the amount of energy produced. Figure 4. Energy flow chart of the Electricity Distribution in South Africa [4]
  • 13. 12 | P a g e Energy demand for countries can rely on many different factors, some of which depend on the time of the day, time of the year, climate of the country, and even the technological advancement of the country. Electricity demand has certain peaks and drops throughout the span of a 24 hour day. Typically during the 4 p.m. to 7 p.m. range there is a demand peak due to consumers arriving home from work, while there is a drop during hours when people are sleeping. Shown in Figure 5, we can see the average electricity demand for a weekday in South Africa. Figure 5. South Africa’s Weekday Electricity Demand Profile [4] In 2001, South Africa’s peak times ranged from about 5 p.m. to 8 p.m. where they would decline moving towards the later hours of the day. The peak demand for electricity varies between the summer and winter, as winter typically has consumers using heating systems to heat their homes. The maximum demand peak during the winter is just over 28 000 MW, while the maximum demand peak for the summer is approximately 25 500 MW. The minimum electricity demand is between 3 a.m. and 5 a.m. during the summer and winter the electricity demand change is much smaller compared to the evening peak times; the change is just under 1000 MW. We can expect these peak times to continue to stay the same, meaning only the energy demand will increase as the year’s progress. The installed total net output of the coal-fired plants is 34 952 MW,
  • 14. 13 | P a g e while the total installed capacity from Eskom is approximately 44 084 MW. Eskom also has a new build programme which will add to the installed capacity by approximately 11 032 MW [3]. 3.2 Electricity – Future Energy Demand South Africa’s energy demand will increase in the future, considering the population growth rate of the country is increasing every year. With a higher populated area more power generating stations will need to be constructed to bridge this gap. Projection data used will range from 2010 to 2030, where the energy demand is linked to the South African Integrated Resource Plan (IRP) 2010 to 2030.
  • 15. 14 | P a g e Table 1. Outlook of South Africa Energy Demand (2011 – 2040) [5]
  • 16. 15 | P a g e As we can see from the projected data, there will be a large increase in capacity essentially every 10 years due to the fact South Africa is a developing country. South Africa has very large coal reserves, where most of the country’s energy supply originates. As well as large coal reserves, South Africa also has a particularly high amount of uranium reserves which can be used in their single nuclear power plant, or potentially in any new ones to be erected. Although south Africa has large coal and uranium reserves, the country is lacking with gas and oil reserves; therefore the country typically imports if necessary. In Figure 6 we can see the one year’s demand of power compared to several resources South Africa has to offer. Figure 6. Energy Reserves of South Africa [6] 3.3 Thermal Energy Demand South Africa has a wide range of temperatures throughout the year, where temperatures may get close to zero degrees Celsius. Consumers in South Africa have the option to heat their homes and water by under floor heating solutions, water heat pumps, and also solar panel water heating alternatives. In 2001, approximately one third of households in South Africa were electrified, therefor different energy sources were used for heating, lighting, and cooking. Although electricity was the leader in all three categories, other energy sources were used as shown in Figure 7.
  • 17. 16 | P a g e Figure 7. Energy Sources Usage for Households in 2001 [6] Electricity will continue to dominate all three categories for households that are electrified due to convenience and accessibility; therefore over the next couple decade’s electricity will be the number one option for thermal energy within households, until natural gas becomes more available i.e. via pipelines. Other countries around the world such as Canada and the United States use natural gas for thermal energy in electric generation, industrial, commercial, and residential conditions. In South Africa, thermal energy for residential consumers comes from purchased cylindrical liquefied petroleum (LP) gas tanks unlike underground gas lines. Therefore heating a home and cooking are the major uses for LP gas tanks. Solar water heating panels are being researched and implemented into residential areas to provide an alternative to heating a consumer’s water. Many different companies are producing these devices to lower carbon emissions and lower their carbon footprint, considering a large amount power is generated by coal-fired plants. Finding information related to current and future thermal energy demand was proven to be a difficult task. Any information related to electric generation, industrial, commercial, and residential thermal energy was not available, therefore a proper analysis of thermal energy in South Africa will not be conducted and removed from this Long Term Energy Plan. 3.4 Transportation – Current Energy Demand The transportation sector within South Africa is typically dominated by the consumption petrol and diesel fuels. Therefore other forms and types of fuels will be excluded from the transportation portion of this Long Term Energy Plan. In the past, it is easily observable that there is a steady increase in the petrol and diesel consumption. In Table 2 below, we can see this steady trend starting from 1988 to 2010.
  • 18. 17 | P a g e Table 2. Fuel consumption of South Africa Between 1988 to 2010 (Millions of Litres) [7] As we can see from Table 2, petrol holds a larger share of the fuel consumption related to transportation in South Africa. Although some slight fluctuations, diesel also appears to be increasing at the same rate as petrol; therefore an interpolation can be conducted to obtain future consumption.
  • 19. 18 | P a g e 3.5 Transportation – Future Energy Demand With the data from Table 2, we obtain two functions; one function for petrol and one for diesel. The relationships can be seen in Figure 8 below. Figure 8. Consumption of Petroleum Products from 1988 to 2010 If we use the equations obtained from the plotted graph and extrapolate to the year 2030, we obtain 14826 millions of litres of petrol and 13824 millions of litres of diesel per year. 4. South Africa’s Energy Supply 4.1 Electricity Generation 4.1.1 Coal South Africa has particularly large reserves of coal. As stated previously, South Africa currently has the ninth largest coal reserve in the world, where most of the energy produced within the country originates from coal-fired plants. Eskom, the company which operates almost all of the coal plants in South Africa, produces approximately 90% of the country’s energy requirements. Coal powered plants work in a similar manner as nuclear power plants. Heat is generated by the burning of pulverized coal, where heat exchangers pass through a boiler containing water which turns into steam. The steam flows to a turbine which turns due to the enormous amount of pressure y = 146.77x - 283117 y = 228.56x - 450153 0 2000 4000 6000 8000 10000 12000 14000 1985 1990 1995 2000 2005 2010 2015 ConsumptionofPetroleumProducts(millionsoflitres) Year Consumption of Petroleum Products from 1988 to 2010 Petrol Diesel
  • 20. 19 | P a g e exerted by the steam. The steam is then condensed by cooling water from either a lake or a cooling tower, and is sent back through the system to repeat the cycle. The turbine is connected to a generator to produce electricity [8]. Coal plants in Ontario produce approximately 3,136 MW in total [9]. Coal plants and other thermal plants provide the ability to start and stop generation of electricity to satisfy demand needs of consumers during peak times which cannot be met by Ontario’s nuclear plants and renewable sources. Coal plants produce a particularly high amount of greenhouse gases compared to other energy producing sources such as nuclear, wind, hydro, etc. In an attempt to create a cleaner and environmentally friendly province, Ontario has decided to stop operational use of coal-fired plants. By the end of 2014, coal plants will be completely discontinued; therefore lowering the amount of greenhouse gases emitted to the atmosphere. The lifetime of an average coal plant is designed for approximately 25 years, but are typically serviced and refurbished to last for about 40 years and in some cases 50 years [10]. As coal is being phased out of Ontario, the need for coal is essentially nullified. The overnight capital costs depending on the type of plant constructed range from values of just under $3,000/kW to over $6,500/kW. The operating and maintenance costs vary depending on the type of plant as well, and range from $30/kW-a to over $80/kW-a [11]. Since coal plants are relatively similar in design and operations to nuclear power plants, a lake or a cooling tower is necessary to condense the purified water used to move the turbines. From the plants within Ontario, there are three types of coals which are used; these include lignite, bituminous and sub-bituminous. Where all types of coal used must be pulverized into a powder where it is sent to the boiler for heat generation. 4.1.2 Hydroelectric Hydroelectric is the lowest cost power source and runs on water from a river or lake which is a renewable source based on how they operate [12]. Hydroelectric stations use either flowing river water or are made into a damn to use the potential energy from lake water to go down a pipe, gain kinetic energy and spin a turbine. The turbine is connected to a generator which spins because of the turbine and produces electricity which then goes out to the grid. South Africa and Eksom has three different types of hydroelectric stations; conventional reservoir, run-of-river, and pumped storage schemes. Pumped storage scheme stores a constant volume of water, which moves from one system to another through turbines to generate electricity. One reservoir is higher than the other which uses reversible pumps to transfer the water between the reservoirs. The costs for involved in hydroelectric are as follows; for a 500 MW plant the fixed operations and maintenance cost is around $14.13/kw-a*1 [13]. The variable operations and maintenance cost are low compared to other energy sources because the plant is designed to last for very long periods of time and is adaptable to changes in power. These are an example of some of the costs that a 1 From the rest of this section, it should be noted that any costs marked with an asterisk came from an American document as some of the plants discussed are not available in Ontario: this assumption is deemed valid with the American dollar being close to on par with the Canadian dollar.
  • 21. 20 | P a g e hydroelectric plant undergoes. The costs for a plant are mainly for construction; which can range from 40% to 50%, 20% to 25% for the turbines for larger plants and 5% to 10% for electrical configuration [14]. 4.1.3 Natural Gas South Africa has constructed their first natural gas power plant, becoming operational in 2012. The power plant in Sasolburg has an operating capacity of 140MW, but has been operating at 152MW since December 2012 [15]. Natural gas is formed in the much the same way as coal and oil; from decayed organic material cooking underground for millions of years [14]. Natural gas is more versatile than coal and oil because it can be used for three things; heating, electricity, and used in transportation. Natural gas is found underground and is found by seismic sensors and then drilled out and pumped into a refining plant [14]. The refining plant takes out the impurities; like, water, oil, and condensates in which these products can be used for other things [14]. Transporting natural gas can be difficult; it is usually transported through underground piping or is converted into liquid form and transported by ship [14]. The transportation costs make up almost two thirds of the price of natural gas [14]. Natural gas is cheap and ranges from $3.50 to just over $5/mmbtu [14]. Natural gas is said to be ‘clean’ but it still releases much the same emissions as coal or oil just in a much less concentration. The fuel, natural gas, is used to run an engine or gas or steam turbine which then drives an alternator which produces the electricity. The natural gas generally is in a large industrial furnace where it burns and creates steam which turns the turbine and creates electricity [12]. The heat that is produced during the process is then captured in steam or and hot water and used in industrial processes, space heating, or other needs [16]. Natural gas plants have efficiencies of only 33% to 35% [14] which is similar to nuclear and less than coal or hydro. Natural gas still has emissions but they are less than coal; it produces approximately 55% the amount coal does for the same amount of energy produced [14]. The fixed operations and maintenance cost is about $13.17/kW-a* [13]. The variable operations and maintenance costs are around $3.60/MWh* [13]. 4.1.4 Nuclear South Africa has two nuclear reactors, generating approximately 5% of their total energy. The reactors are located at Koeburg Nuclear Power Station just outside of Cape Town. The Koeburg Nuclear Power Station has a net capacity of 1830 MWe, where commissioning began in 1984 and 1985. These reactors are planned to be closed in 2024 and 2025, giving them a 40 year life period [17]. South Africa has a proposed 6 reactor or more plant in Thyspunt, which will have a gross capacity of 9600 MWe, or 1600MWe per reactor. This plants first power proposed to be within the period 2023 to 2030, and is a Pressurized Water Reactor (PWR) [17]. PWRs use light water as its coolant and moderator, unlike CANDU reactors which use a heavy water coolant. The fuel for a PWR is enriched uranium unlike in CANDU which uses natural uranium. PWRs operate in the same manner as any other plant, where a heat source is produced transferring
  • 22. 21 | P a g e heat to coolant, and the coolant flows to a steam generator, producing steam on a secondary side. This steam is used to drive turbines to convert mechanical energy into electrical energy by a generator, where the electricity is then sent to the grid for consumer use. Figure 9. Pressurized Water Reactor [18] South Africa has a fairly large reserve of uranium; therefore in the future nuclear energy could flourish and compete with coal-fired power plants. A negative is constructing nuclear power plants which use enriched uranium, therefore shipping and processing will account for a lot of the pricing of uranium. 4.1.5 Biomass Biomass primarily consists of wood pellets, agricultural by-products such as grain screenings, and milling spoils that are burned to produce electricity in much the same way natural gas is used [12]. Biomass is a renewable source because the products used can be grown. Biomass is carbon neutral because it produces the same amount of carbon while burning as it removed while the plant was growing [16]. Advantages to biomass include; it is abundant and renewable, there is no net increase in carbon dioxide, and vegetable oil can be used for biodiesel [19]. Disadvantages to biomass include: it still produces some emissions, and it needs large amounts of land to grow the fuel [19]. South Africa has a large potential in biomass energy, considering the amount of open fields the country has to plant fuels such as sugar cane. As an incentive by the South African government a biomass plant of 17.5MW has been selected as a renewable energy project. The plant will be run on sugar cane tops and leaves producing 132000 MWh per annum [20]. 4.1.6 Solar There are two types of solar power; thermal and photovoltaic [14]. Solar is a renewable resource because it draws energy from the sun. The sun provides lots of energy to the world through
  • 23. 22 | P a g e radiation, heat, and light but the power received is based on climate, clouds and the length of night. To use the sun’s energy solar panels are used and collectors. The current solar panel system can only convert about 12 to 15 percent of the solar energy that it absorbs [16]. There are three types of collectors; low temperature, medium, and high temperature [14]. The low temperature collectors are used for swimming pool heating, greenhouses, and space heating [14]. Medium temperature collectors are mainly used in domestic hot water heating and high temperature collectors are used to provide electricity to the grid [14]. High temperature collectors are used to supply electricity to the grid. They use parabolic troughs, a solar dish, or solar power towers [14]. Solar power uses the same idea to produce electricity has a fossil fuel plant or nuclear plant; it heats up water, turns it into steam which in turn turns a turbine which produces electricity [14]. The troughs, dishes, and towers all take the sun and focus its energy to heat up the water. The land use is large for solar; for example, a coal plant requires 640 to 1,280 acres of land whereas a solar thermal plant would need 6,000 acres to produce 1,000 MW of power [14]. Average costs for a plant is between $122/MWh and $220/MWh and this is dependent on location [14]. There are also photovoltaic solar panels that convert the sun’s energy directly into electricity using advanced semiconductors [14]. Photovoltaic panels are generally used on top of houses or industries to power their electrical circuit. The main cost is construction with minimal operations and maintenance [14]. This is because it uses the sun and it is renewable as well as abundant. The annual 24-hour global solar radiation average is about 220 W/m2 for South Africa, compared with about 150 W/m2 for parts of the USA, and about 100 W/m2 for Europe and the United Kingdom. This makes South Africa's local resource one of the highest in the world [21]. 4.1.7 Wind Wind occurs when there is an uneven heating of the Earth’s atmosphere by the sun, the irregularities of the Earth’s surface, i.e., mountains, valleys, etc., and the rotation of the Earth. Wind turbines were created to harness the power of this renewable energy source. Wind turbines work by in the same fashion as turbines work in power plants, but instead of using pressurized steam, wind is used as the driving force. Turbines convert the kinetic energy of the wind into mechanical power and a generator is used to convert the mechanical power into electricity. Wind turbines use incoming wind to turn the blades and the rotor connected to a low-speed shaft. The low speed shaft is connected to a high-speed shaft, increasing the rotations per minute from 30 – 60 rpm to 1,000 – 1,800 rpm, which is the required rotational speed required by most generators to produce electricity [22]. Currently there are 9 wind farms located in South Africa, which have an installed capacity of approximately 456 MW in total [23]. This is relatively small to the current energy demand of South Africa. Wind turbines are generally estimated to have a lifetime of 20 years [24]. Maintenance costs are particularly low for new turbines but increase further as it ages. Regardless of size of a wind turbine, the servicing costs will generally be equivalent because the need to service a large wind turbine and a small turbine are equal.
  • 24. 23 | P a g e A single wind turbine can produce approximately 1.5 MW to 4.1 MW and wind farms will have tens of hundreds of turbines, therefore a need for large open areas are necessary. Some wind farms are located offshore due to the open concept and land availability. Turbines can have blades over the length of 50 m, meaning enough land must be available to have a successful energy producing wind farm [25]. Wind energy may have minor impacts, for example, construction of roadways and transportation of equipment. Although wind turbines are a cleaner energy source than other means of energy production, many consumers do not believe wind farms are aesthetically pleasing. Another impact is using a large amount of land for wind farms that do not produce nearly an equivalent amount of electricity compared to nuclear and fossil fuel plants. 4.2 Transportation Energy 4.2.1 Diesel There are several uses for diesel such as powering vehicles or diesel generators. Diesel is produced from the heating of crude oil in a piece of equipment known as a crude distillation tower. Crude oil is unrefined liquid petroleum, ranging from yellow to black and is composed of several thousand different compounds known as hydrocarbons. Each hydrocarbon has a specific boiling point which is the method for separating each product. Within the crude distillation tower, crude oil is heated where the hot gases are passed into the bottom the distillation column and become cooler as they rise. The gases condense and are drawn out of the column based on boiling points and specific heights in the column. The drawn out fluids include heavy residues at the bottom, raw diesel fuels in the mid-sections, and gasoline at the top, which are processed further to creating several different finished products. The process of crude oil refining separates different products, having many uses such as high performance fuels to certain types of plastics [26]. Other forms of diesel exist that are not produced from crude oil. For example biodiesel is created from a variety of feed stocks including canola and soy oils, animal fats, recycled cooking oils and restaurant grease. Biodiesel is a clean-burning, biodegradable, and renewable fuel and reduces greenhouse gases, smog causing particles, and acid rain causing emissions. Biofuel can also be used in vehicles if the fuel is mixed with regular diesel at a percentage ranging from 5% to 20% blend [27]. 4.2.2 Gasoline Gasoline is a petroleum product usually made from refining crude oil [11]. The process for refining gasoline is complex but is generally extracted from deposits of crude oil [13]. Gasoline is used for transportation; it is used for combustion in an engine. The car uses the combustion energy and turns it into mechanical energy. When gasoline goes through combustion it produces greenhouse gases such as methane and carbon dioxide which deteriorate the ozone layer. Gasoline combustion also has other effects on the atmosphere, such as creating smog precursors that creates an unhealthy supply of air because of the dangerous gases that get inhaled. Gasoline stations are located in many places because most automobiles use gasoline.
  • 25. 24 | P a g e The petrol price in South Africa is linked to the price of petrol in US dollars in certain international petrol markets. This means that the domestic price is influenced by supply and demand for petroleum products in international markets, combined with the rand/dollar exchange rate [28]. 5. Energy Evaluation Charts Evaluation criteria charts were constructed to determine how important each criterion regarding every energy source. Below an example of the how the rating systems and weighting factors were completed to determine an energy sources final score ranking for South Africa. Weighting factors range from 1 to 10, where 1 is the lowest and 10 is the highest. A rating was given for each criterion to determine the evaluation outcome, which gives the energy source its final ranking. Different criteria charts were constructed for electricity, thermal, and transportation, in the case of South Africa, thermal energy was excluded due to sufficient available data. 5.1 Example Evaluation Criteria Chart: Coal Electricity Selection Criterion Weighting Factor (1-10) Rating Evaluation Public Opinion 7 3 21 Cost Operating Cost 9 3 27 Upfront Construction Cost 7 3 21 Resource Cost 3 4 12 Reliability 10 5 50 Key Impacts 8 1 8 Energy Output (MW) 9 4 36 Availability of Fuel 7 5 35 Risk Analysis Financial 8 4 32
  • 26. 25 | P a g e Political 4 1 4 Disaster 9 4 36 Availability to have Workers Run the Plant 5 4 20 Ability to Operate on a Small Scale 7 1 7 Total 309 Coal plants may have a bad reputation with the public due to the many effects they impose; producing a large amount of greenhouse gases and other pollutants into the atmosphere, such as sulphur dioxides, nitrous oxides, mercury, etc. Many people do not want to live in a polluted and smoggy area. Considering that coal is the leading provider of energy within South Africa, we can assume that the public does tolerate and understand that coal is a large economical factor. Therefore a rating of 3 was given. Operating and maintenance costs for a coal power plant are at a medium level. They are higher than natural gas operating and maintenance costs but lower or on par with other energy generating options such as wind, solar, and nuclear. The values of the operating and maintenance costs range roughly from $31.18 - $80.53/kW-a. The rating given for operating costs of coal power plants is a value of 3. Depending on the type of coal plants constructed, upfront construction costs are can vary and range from approximately under $3,000/kW to just over $6,500/kW. Comparing the upfront construction costs to other sources of energy production, this is within the medium range; therefore a rating of 3 was given. The amount of coal used in a power plant to produce one kilowatt-hour is roughly 1.07 pounds of coal, which in the long run, coal plants need a very large amount of coal to operate. In turn the amount of coal needed for a power plant is fairly high; therefore coal would be in demand increasing the price of coal. But South Africa has a very large reserve of coal therefore a rating of 4 was given. Coal plants are very reliable, as they can be essentially turned on and off when needed. A rating for reliability of coal plant was given a value of 5. There are many key impacts with coal power plants, such as the release of greenhouse gases, and several other hazardous pollutants to the atmosphere. These pollutants include nitrogen oxides, sulphur dioxide, and mercury, all of which effect the environment negatively. Even with mitigation processes, coal and fossil fuels make up a large portion of emissions in South Africa. South Africa also has a large amount of coal plants supply a large portion of the energy to the country. Therefore a rating of 1 was given for the key impacts for coal power plants.
  • 27. 26 | P a g e Since coal-fired plants are the main generating energy source within South Africa, and they are building two of the largest plants in the world, of approximately 4800MW each, they can provide a large electrical output. Therefore a rating of 4 was given energy output. Coal is the largest energy resource South Africa has to offer, where they are ninth among the world; therefore a rating of 5 was given for resource availability. Coal power plants can be built much faster than a nuclear power plant, meaning the time the company has to construct the facility is much lower, therefore companies have a smaller timeframes for financial risks occurring. The risks with building and operating a nuclear power plant and a coal power plant are essentially the same, but coal plants have smaller construction time frames. Therefore a rating of 4 was given for the financial risks of coal plants. The way members of the public can force politicians to negatively impact nuclear power plants, coal plants can be affected in the same manner. Although the risks with radioactive releases to the public are limited in coal power plant, there are other releases which affect the public such as greenhouse gases and smog. Therefore a rating of 1 was given for the political risks related to coal power plants. There are limited factors dealing with disaster risks related to coal power plants. Coal plants release a large amount of emissions, but disaster risks are not a major factor; therefore a rating of 4 was given for the disaster risks. Coal plants in South Africa are throughout the country and operating smoothly, therefore there is availability of workers to operate such facilities. A rating of 4 was given for availability of workers. Coal plants, much like nuclear power plants do not have the ability to operate on a smaller scale, therefore a rating of 1 was given for this ability. 5.2 Completed Evaluation Criteria Chart Scores Table 3. Electricity Totals Source Score Biomass 291 Coal 309 Natural Gas 293 Hydroelectric 313 Nuclear 315 Solar 312 Wind 306
  • 28. 27 | P a g e Table 4. Transportation Totals Source Score Gasoline 160 Diesel 148 Electric 144 6. Application of Energy Charts to Projection Data 6.1 Electricity The peak load of South Africa is approximately 50.9 GW according to the Study on Programme for Infrastructure Development in Africa (PIDA). As stated previously, Eskom provides approximately 44 GW of energy to Africa alone; therefore the remaining energy belongs to other members of SAPP. Currently Eskom is meeting the energy demands of South Africa, but in 2040 the peak base load will increase. Table 5 below, describes the current electrical energy supply to South Africa. Table 5. Current Electrical Output [3][29] Source Energy Output (MW) Coal 37745 Natural Gas 2426 Nuclear 1910 Wind 456 Hydroelectric 2000 Solar 30 Total 44567 For the obtained projected data towards 2030, the increase in demand is substantial, where it is projected to increase by approximately 41000MW, which means almost doubling the installed capacity of South Africa in 30 years. South Africa’s energy mix should be composed of a diverse amount of energy sources. There are going to be deficiencies between the installed capacities from 2013 to 2040, for the peak loads and base loads. Table _. Provides the total potential energy deficits. Table 6. Installed Capacity Deficits from 2013 to 2030 Base Load Requirements: 85241MW Coal: 37745 MW Nuclear: 1910 MW Wind: 456 MW Solar: 30 MW Hydroelectric: 2000 MW Natural Gas: 2426 MW
  • 29. 28 | P a g e Difference: -40674 MW There are major differences for the peak loads and the base loads in the year 2030. Therefore addition of new energy sources and builds are necessary to bridge this large gap. Nuclear energy, hydroelectric, solar and wind sources were given large scores using the constructed evaluation criteria charts, where these values can be found in Table 3. Therefore more and larger facilities should be integrated into South Africa’s energy supply mix for electricity, as well as for bridging the gap between the base loads from now to 2030. Since nuclear scored the highest rank of 315, the installed capacity should be increased greatly to cover the base load. South Africa’s reactors produce approximately 900 MW of electricity to the grid, by following this trend an installment of 16 new reactors will cover 14400 MW of electricity. Solar energy can be installed throughout the north western desert of South Africa. If on average they can produce 50 MW of electricity, then installing approximately 22 new solar farms throughout South Africa, which will cover approximately 1100 MW of electricity. Wind energy can be installed throughout South Africa, with a wind farm on average produces 50 MW, then installing approximately 30 wind farms, on and off shore will produce 1500 MW of electricity. Coal energy will play a large role in South Africa’s energy supply mix due to its abundance throughout the country. With the addition of two coal-fired power stations having an installed capacity of 4800 MW each, an additional 4 new coal-fired plants will be added to the energy supply mix. Each plant will have an average of 3500 MW of electricity; therefore by 2030 coal will be producing an additional 23600. Some coal-fired plants may be decommissioned throughout this time period, therefore additional coal plants were implemented. Natural gas, imported hydro and hydroelectric will combine to cover peak loads within South Africa. 6.2 Transportation Transportation in South Africa is dominated by petrol and diesel, they both account for approximately 80% of the demand for all liquid fuels [6]. If the current demand for petrol and diesel fuel is rising as time moves forward, then a need for more crude oil is necessary. Crude oil is converted into diesel and petrol at Gas-To-Liquid facilities, for example the facility owned by PetroSA in Mossel Bay. The main sources of energy for transportation energy in the future will dominantly consist of gasoline and diesel fuels. Electric and hybrid vehicles are well behind in reliability and usage; therefore until new technological advances materialize, electric vehicles do not play a major role in the future.
  • 30. 29 | P a g e In the rating systems provided in Appendix C, gasoline was given a rating of 160, compared to diesel and electric/hybrid vehicles were rated as 148 and 144, respectively. The rating for electric vehicles was relatively higher than diesel due to emissions released and environmental factors. From the calculated transportation projected data, diesel fuel was increasing relatively faster than gasoline, as diesel had a larger slope of 228.56 compared to petrol’s slope of 146.77. Both sectors are increasing shown by the linear extrapolation of retrieved data. The share changes can be related to slow growth of the passenger sector and strong growth in the freight sector. Technological advances can decrease the demand for diesel and petrol by implementing more electric and hybrid vehicles to the transportation sector. Increased prices of crude oil can also lower the demand, otherwise the demand for petrol and diesel will continue to rise in the future. 7. Conclusion The purpose of this report was to create a Long Term Energy Plan for South Africa which entails creating a long and sustainable energy supply mix. The plan is attempting to use the South Africa’s resources while providing a clean, reliable and affordable energy plan for now and in the future. The method for completing the creation of South Africa’s Long Term Energy Plan was constructing evaluation criteria charts for determining which energy generating source is fits best with South Africa economy, available resources, and several other factors. Energy Projections were obtained for electricity and transportation within South Africa until the year 2030. Projected energy demands were compared with current energy demands, which led to a difference in energy demand between 2014 and 2040. To compensate for the difference energy generating sources were introduced to bridge the gap. For electricity, several energy options were implemented into South Africa’s energy supply mix. This included additional nuclear power stations, solar farms, coal-fired plants, hydroelectric stations, and wind farms. Transportation was also included in the long term energy plan which was limited to petrol, diesel and electric/hybrid fuels of transportation. Unfortunately for the scope of this Long Term Energy Plan, an analysis of thermal energy within South Africa was not possible due to lack of available data. There are a multitude of other factors, such as politics and money, which were not analyzed in depth which may contribute to the outcome of the data.
  • 31. 30 | P a g e Bibliography [1] Eskom Holdings SOC Limited, "Map of Eskom power stations," Eskom Holdings SOC Limited, 2014. [Online]. Available: http://www.eskom.co.za/Whatweredoing/ElectricityGeneration/PowerStations/Pages/Map_Of _Eskom_Power_Stations.aspx. [Accessed 23 February 2014]. [2] U.S Energy Information Administration, "South Africa," U.S Energy Information Administration, 28 February 2014. [Online]. Available: http://www.eia.gov/countries/cab.cfm?fips=SF. [Accessed March 2014]. [3] Eskom Holdings SOC Limited, "Generation plant mix," Eskom Holdings SOC Limited , 13 August 2012. [Online]. Available: http://www.eskom.co.za/AboutElectricity/FactsFigures/Documents/GX_0001GenPlantMixRev1 3.pdf. [Accessed February 2014]. [4] National Electricity Regulator, "Electricity Supply Statistics 2001 for South Africa," National Electricity Regulator, 2002. [Online]. Available: http://www.nersa.org.za/Admin/Document/Editor/file/News%20and%20Publications/Public ations/Archived%20Issues/Electricity%20Supply%20Statistics/ESS2001_o.pdf. [Accessed March 2014]. [5] Depratment of Energy, "Integrated Resource Plan for Electricity 2010-2030," Department of Energy, 11 March 2011. [Online]. Available: http://www.energy.gov.za/IRP/irp%20files/IRP2010_2030_Final_Report_20110325.pdf. [Accessed March 2014]. [6] H. W. A. K. G. P. J. N. D. S. M. H. T. A. Ogunlade Davidson, "Energy policies for sustainable development in South Africa," Energy Research Centre, University of Cape Town, Cape Town, April 2006. [7] South Africa Petroleum Industry Association , "2011 Annual Report," Nova Communications Ltd, March 2012. [8] Duke Energy , "How Do Coal-Fired Plants Work?," Duke Eneregy Corporation, 2013. [Online]. Available: http://www.duke-energy.com/about-energy/generating-electricity/coal-fired- how.asp. [Accessed 8 November 2013]. [9] Ontario Power Generation, "Nuclear Power," Ontario Power Generation Inc., 2013. [Online]. Available: http://www.opg.com/power/nuclear/. [Accessed 8 November 2013]. [10] R. M. Ambrosini, "Life extension of coal-fired power plants," International Energy Agency, 2005.
  • 32. 31 | P a g e [11] U.S Energy Information Administration, "Updated Capital Cost Estimates for Utility Scale Electricity Generating Plants," 2013. [Online]. Available: http://www.eia.gov/forecasts/capitalcost/pdf/updated_capcost.pdf]. [Accessed 8 November 2013]. [12] Ontario Power Generation, "OPG," 2013. [Online]. Available: http://www.opg.com/power/. [Accessed 9 October 2013]. [13] U.S. Energy Information Administration, "EIA," April 2013. [Online]. Available: http://www.eia.gov/. [Accessed 12 November 2013]. [14] EnergyBC, "EnergyBC," University of Victoria, 2012. [Online]. Available: http://www.energybc.ca/. [Accessed 13 November 2013]. [15] "South Africa’s first gas-fired power plant fully operational," South African Synthetic Oil Limited, 10 July 2013. [Online]. Available: http://www.sasol.co.za/media-centre/media-releases/south- africa-s-first-gas-fired-power-plant-fully-operational. [Accessed March 2014]. [16] Ontario Power Authority, "Energy," 30 June 2013. [Online]. Available: http://www.powerauthority.on.ca/electricity-contracts/combined-heat-power. [Accessed 10 October 2013]. [17] World Nuclear Association, "Nuclear Power in South Africa," World Nuclear Association, March 2014. [Online]. Available: http://www.world-nuclear.org/info/country-profiles/countries-o- s/south-africa/. [Accessed March 2014]. [18] U.S. Nuclear Regulatory Commission , "The Pressurized Water Reactor (PWR)," U.S. Nuclear Regulatory Commission , 29 March 2012. [Online]. Available: http://www.nrc.gov/reading- rm/basic-ref/students/animated-pwr.html. [Accessed February 2014]. [19] C. H. Eccleston, F. March and T. Cohen, Inside Energy, Boca Raton: Taylor & Francis Group, 2012. [20] T. Melville, "South Africa invests in biomass anergy," 5 January 2014. [Online]. Available: http://www.energydigital.com/renewable_energy/south-africa-invests-in-biomass-energy. [Accessed February 2014]. [21] Department of Energy, "solar-power," Department of Energy, [Online]. Available: http://www.energy.gov.za/files/esources/renewables/r_solar.html. [Accessed February 2014]. [22] U.S Department of Energy, "How Do Wind Turbines Work?," U.S Department of Energy, 17 January 2013. [Online]. Available: https://www1.eere.energy.gov/wind/wind_how.html. [Accessed 8 November 2013]. [23] The Wind Power, "South Africa," The Wind Power, March 2014. [Online]. Available:
  • 33. 32 | P a g e http://www.thewindpower.net/country_windfarms_en_58_south-africa.php. [Accessed March 2014]. [24] P.-E. M. S. A. Søren Krohn, "The Economics of Wind Energy," European Wind Energy Association, 2009. [25] General Electric Company, "Wind Turbines," General Electric Company, 2013. [Online]. Available: http://www.ge-energy.com/wind. [Accessed 9 November 2013]. [26] American Fueal & Petrochemical Manufacturers , "The Refining Process," AFPM, [Online]. Available: http://www.afpm.org/The-Refinery-Process/. [Accessed 9 November 2013]. [27] Canadian Renewable Fuels Association, "Biodiesel," CRFA, 2010. [Online]. Available: http://www.greenfuels.org/en/resource-centre/biodiesel.aspx. [Accessed 9 November 2013]. [28] South African Petroleum Industry, "Industry Overview - South Africa Fuel Industry," SAPIA, 2013. [Online]. Available: http://www.sapia.co.za/industry-overview/fuel-industry.html. [Accessed March 2014]. [29] R. S. B. K. Tumi Maphelele, "South Africa Solar Energy Technology Road Map," 10 May 2013. [Online]. Available: http://www.sapvia.co.za/wp-content/uploads/2013/03/Solar-PV-Baseline- for-South-Africa_Draft-2_2013-06-26.pdf. [Accessed February 2014]. [30] Ontario Waterpower, "Emergent Hydro Regulatory Best Practices - Canadian Regulatory Regimes," 2013. [Online]. Available: http://www.energybc.ca/cache/runofriver/Tami%20Sugarman%20_%20Approvals%20Presen tation_May%204-11[1].pdf. [Accessed 14 November 2013]. [31] U.S Department of Energy , "All-Electric Vehicles: Compare Side-by-Side," U.S Department of Energy , 19 November 2013. [Online]. Available: http://www.fueleconomy.gov/feg/evsbs.shtml. [Accessed 19 November 2013]. [32] Waterpower, "Ontario's Primary Renewable Resource," Waterpower, 2013. [Online]. Available: http://www.owa.ca/waterpower-information/waterpower/. [Accessed 13 November 2013]. [33] Solar Academy, "Ontario's FIT, MicroFIT Projects Subject to New Fees," Onraio Solar Academy, 9 March 2011. [Online]. Available: http://www.solaracademy.com/ontario/tag/solar-energy. [Accessed 18 November 2013].
  • 34. 33 | P a g e Appendix A – Evaluation Criteria Charts Coal Electricity Selection Criterion Weighting Factor (1-10) Rating Evaluation Public Opinion 7 3 21 Cost Operating Cost 9 3 27 Upfront Construction Cost 7 3 21 Resource Cost 3 4 12 Reliability 10 5 50 Key Impacts 8 1 8 Energy Output (MW) 9 4 36 Availability of Fuel 7 5 35 Risk Analysis Financial 8 4 32 Political 4 1 4 Disaster 9 4 36 Availability to have Workers Run the Plant 5 4 20 Ability to Operate on a Small Scale 7 1 7 Total 309
  • 35. 34 | P a g e Coal plants may have a bad reputation with the public due to the many effects they impose; producing a large amount of greenhouse gases and other pollutants into the atmosphere, such as sulphur dioxides, nitrous oxides, mercury, etc. Many people do not want to live in a polluted and smoggy area. Considering that coal is the leading provider of energy within South Africa, we can assume that the public does tolerate and understand that coal is a large economical factor. Therefore a rating of 3 was given. Operating and maintenance costs for a coal power plant are at a medium level. They are higher than natural gas operating and maintenance costs but lower or on par with other energy generating options such as wind, solar, and nuclear. The values of the operating and maintenance costs range roughly from $31.18 - $80.53/kW-a. The rating given for operating costs of coal power plants is a value of 3. Depending on the type of coal plants constructed, upfront construction costs are can vary and range from approximately under $3,000/kW to just over $6,500/kW. Comparing the upfront construction costs to other sources of energy production, this is within the medium range; therefore a rating of 3 was given. The amount of coal used in a power plant to produce one kilowatt-hour is roughly 1.07 pounds of coal, which in the long run, coal plants need a very large amount of coal to operate. In turn the amount of coal needed for a power plant is fairly high; therefore coal would be in demand increasing the price of coal. But South Africa has a very large reserve of coal therefore a rating of 4 was given. Coal plants are very reliable, as they can be essentially turned on and off when needed. A rating for reliability of coal plant was given a value of 5. There are many key impacts with coal power plants, such as the release of greenhouse gases, and several other hazardous pollutants to the atmosphere. These pollutants include nitrogen oxides, sulphur dioxide, and mercury, all of which effect the environment negatively. Even with mitigation processes, coal and fossil fuels make up a large portion of emissions in South Africa. South Africa also has a large amount of coal plants supply a large portion of the energy to the country. Therefore a rating of 1 was given for the key impacts for coal power plants. Since coal-fired plants are the main generating energy source within South Africa, and they are building two of the largest plants in the world, of approximately 4800MW each, they can provide a large electrical output. Therefore a rating of 4 was given energy output. Coal is the largest energy resource South Africa has to offer, where they are ninth among the world; therefore a rating of 5 was given for resource availability. Coal power plants can be built much faster than a nuclear power plant, meaning the time the company has to construct the facility is much lower, therefore companies have a smaller timeframes for financial risks occurring. The risks with building and operating a nuclear power plant and a coal power plant are essentially the same, but coal plants have smaller construction time frames. Therefore a rating of 4 was given for the financial risks of coal plants.
  • 36. 35 | P a g e The way members of the public can force politicians to negatively impact nuclear power plants, coal plants can be affected in the same manner. Although the risks with radioactive releases to the public are limited in coal power plant, there are other releases which affect the public such as greenhouse gases and smog. Therefore a rating of 1 was given for the political risks related to coal power plants. There are limited factors dealing with disaster risks related to coal power plants. Coal plants release a large amount of emissions, but disaster risks are not a major factor; therefore a rating of 4 was given for the disaster risks. Coal plants in South Africa are throughout the country and operating smoothly, therefore there is availability of workers to operate such facilities. A rating of 4 was given for availability of workers. Coal plants, much like nuclear power plants do not have the ability to operate on a smaller scale, therefore a rating of 1 was given for this ability.
  • 37. 36 | P a g e Hydroelectric Public opinion is rated a 4 because of the neighboring communities that are near the dam being built and running. The neighboring communities, mainly ones downstream, have to deal with; Electricity Selection Criterion Weighting Factor (1-10) Rating Evaluation Public Opinion 7 4 28 Cost Operating Cost 9 5 45 Upfront Construction Cost 7 1 7 Resource Cost 3 5 15 Reliability 10 4 40 Key Impacts 8 4 32 Energy Output (MW) 9 2 18 Availability of Fuel 7 2 14 Risk Analysis Financial 8 2 16 Political 4 4 16 Disaster 9 3 27 Availability to have Workers Run the Plant 5 4 20 Ability to Operate on a Small Scale 7 5 35 Total 313
  • 38. 37 | P a g e debris running downstream affecting surrounding ecosystems, potential flooding that may occur, and worry about the dam breaking and causing massive amounts of damage. Operating cost is rated at a 5 because once a hydro plant is built it is almost self-run. The water comes in turns the turbine and then leaves. There is not much in operating costs mainly in maintenance and those are low compared to other energy types [30]. Upfront construction cost is rated a 1 because depending on the size of the dam it could take up a large amount of space. It has to be able to stretch across an entire river or part of a lake in order to utilize the potential energy from the water source. This means a lot of construction above and below water will take place and water displacement methods will be utilized. Resource cost is rated a 5 because water is renewable and once in place there will always be water unless an intense drought occurs. The water does not cost anything for it to run through the hydro plant because of the way it utilizes water as a natural resource. Reliability is rated a 4 because hydro plants have the ability to manage fluctuations in power [14]. It can match what power is needed and it also uses a renewable resource which will last for hundreds of years of designed and placed properly; if a drought does not occur and it does not break. Key impacts is rated a 2 because of the long construction times and the construction debris. Depending on the size of the dam it can take years to build and in this time debris is floating downstream towards different ecosystems, trees and wildlife, where it can have a major impact. Electric output for hydroelectric output is rated a 2 because South Africa does not have many water sources which can generate a large amount of electricity. Although some hydroelectric stations produce about 1000MW of energy, the amount of station locations are limited in South Africa. For this reason a rating of 2 was given for resource availability. Financial risk is rated a 2 because they are expensive to make and building it takes a long time depending on the size [14]. The political risk for hydroelectric power was given a rating of 4 because the public typically understand that renewable energy sources are more environmentally friendly than other sources of energy, such as coal fired plants. Disaster risk is rated a 3 because of the fact of flooding that causes methane gas to be produced from vegetation and mercury release into the water from surrounding rocks [14].If the dam breaks then there is major damage done to anything located downstream [14]. Availability to have workers run the plant is rated a 4 because hydro stations are mainly self-sustainable [30] the only workers that need a large amount of knowledge are the maintaining crew and the repair crews as well as some of the operations staff. Ability to operate on a small scale is a 5 because a dam or a turbine can be put into a small river and will produce small amounts of electricity.
  • 39. 38 | P a g e
  • 40. 39 | P a g e Natural Gas Public opinion for natural gas is rated a 4 because natural gas plants are still being constructed and operated. Another reason is that they produce fewer emissions than coal plants which are better for the environment. Electricity Selection Criterion Weighting Factor (1-10) Rating Evaluation Public Opinion 7 4 28 Cost Operating Cost 9 5 45 Upfront Construction Cost 7 4 28 Resource Cost 3 2 6 Reliability 10 4 40 Key Impacts 8 4 32 Energy Output (MW) 9 2 18 Availability of Fuel 7 3 21 Risk Analysis Financial 8 2 16 Political 4 3 12 Disaster 9 3 27 Availability to have Workers Run the Plant 5 4 20 Ability to Operate on a Small Scale 7 2 14 Total 307
  • 41. 40 | P a g e Operating cost is a 5 because they are low and there is not much need to interfere with the system while under operations [14]. Upfront construction costs was given a rating of 4 because coal-fired plants can be converted to natural gas plants, since South Africa has such a large amount of coal plants this can open the door to natural gas plants to emerge. Resource cost for natural gas was given a rating of 2 because South Africa does not have a large reserve of natural gas compared to other countries; therefore the country needs to import a large amount of the fuel. The rating for availability of fuel was given a 3 for the low reserves of natural gas within South Africa, but having the ability to import from other countries. Reliability is a 4 because natural gas plants are reliable but also can have issues depending on natural gas shortages or leaks that can occur. The key impacts is rated a 4 because a plant still produces emissions; the emissions are just less than that of coal [14].The gas itself is also an emission if it gets into the atmosphere. The energy output for natural gas plants is relatively low in South Africa because there are not a large amount of plants and limited fuel. A conventional plant can have an installed capacity of about 300 MW according to the Ontario Power Authority, where if we compare to 4800MW coal plant South Africa is constructing. Financial risk was given a rating of 2 because natural gas is imported to South Africa, and if conflicts arise between South Africa and the exporter a shortage of natural gas may occur. Political risk was given a 3 because the government and the public may have different opinions on the use of natural gas plants within South Africa. Disaster risk is a 4 because not many things go wrong with natural gas. If there is a leak it dissipates into the air quickly because it is lighter than air. The only issue would be in the lines where it could seep into the ground and cause soil problems or if it was ignited while it was escaping. The greenhouse gases are also much less than that of coal that are emitted into the atmosphere during operations [14]. Availability to have workers run the plant is rated a 4 because there does not need too many experts in the plant because of the simple design and low disaster risk involved. Ability to operate on a small scale is rated a 2 because there are only plants that are used for producing electricity for many homes and other efficient means for electricity on a smaller scale if needed [14].
  • 42. 41 | P a g e Nuclear A rating of 3 was given for the public opinion of nuclear power in South Africa. This rank was given because the government is attempting to inform the public about the benefits and hazards of nuclear energy by having nuclear awareness campaigns. Electricity Selection Criterion Weighting Factor (1-10) Rating Evaluation Public Opinion 7 3 21 Cost Operating Cost 9 2 18 Upfront Construction Cost 7 4 28 Resource Cost 3 4 12 Reliability 10 5 50 Key Impacts 8 4 32 Energy Output (MW) 9 4 36 Availability of Fuel 7 4 28 Risk Analysis Financial 8 2 16 Political 4 3 12 Disaster 9 5 45 Availability to have Workers Run the Plant 5 2 10 Ability to Operate on a Small Scale 7 1 7 Total 315
  • 43. 42 | P a g e The rating value of 2 was given for the operating costs. The operating and maintenance costs of a typical nuclear power plant are a bit higher compared to other energy sources and the amount of energy produced by a plant. The upfront construction costs were given a rating of 4. The value was chosen because the average capital cost of a nuclear power plant is $2,845/kw, which can be compared to capital costs of other plants. The capital cost for a combined cycle natural gas plant is approximately $917/kw, but on the other hand for a typical dual flash geothermal plant the capital cost is approximately $6,243/kw. This shows that nuclear power reside in the middle of capital costs for different energy production plants. The cost of fuel is given a rating of 4 because the amount of fuel being used in a nuclear plant is relatively small compared to other means of electricity generation such as coal and natural gas. The only downside is the processes of enriching the fuel if using Light Water Reactors (LWR). Power plants are particularly reliable; they have many redundancies to components to ensure the system is available during maintenance and other events. These redundancies ensure that the chance for an accident is relatively low. Components performing the same tasks are generally separated from each other, so if a failure occurs on one component it will not affect the other. Systems, equipment and structures in nuclear reactors are all seismically and environmentally qualified to function under these conditions. With all measures taken to ensure the reactor is available and reliable, the rating given was a 5. There are several impacts that occur while operating a nuclear power plant. There are risks of a nuclear meltdown occurring, but are mitigated by nuclear reactors having reliable shutdown systems and a numerous amount of redundancies. Another impact is the storage and waste disposal of spent fuel. Reactors produce a large quantity of fuel and this fuel is radioactive and heated; therefore storage facilities and waste disposal facilities are needed. Since a nuclear meltdown is a severe impact, and fuel disposal does not have a true solution a rating of 4 is given. South Africa’s only nuclear station has an installed capacity of 1800MW, which is approximately 5% of the country’s energy demand. A rating of 4 was given for the electrical output of nuclear power plants in South Africa. Since South Africa has a particularly large reserve of uranium, but the fuel must be processed elsewhere, the availability of fuel is given a rating of 4. There are many risks while operating and constructing nuclear power plants, for example, during the building phases of a reactor, there is a risk that construction may come to a stop, this could unfortunately lead to closure of the plant altogether. A nuclear power plant may take a longer period of time to construct than other energy sources; therefore it has a large timeframe for a problem to occur economically and financially leading to stoppage of construction. Therefore a rating of 2 was given for the financial risk of a nuclear power plant. There is a high political risk for nuclear power plants. Some public members may cause political figures to act negatively towards power plants by lobbying; this can lead to the stoppage of
  • 44. 43 | P a g e construction or operations. As politicians want to gain votes by supporting their community they will attempt to move forward in the public direction. A rating of 3 was given for the political risk of nuclear power plants. Another example is the risk of a nuclear meltdown occurring, but necessary regulations and processes are completed to mitigate meltdowns. These measures include having many barriers and redundancies to prevent any harm to the environment and the public. Nuclear power plants are also seismically qualified as well as qualified for tornados to prevent disasters from occurring. A large amount of effort to ensure safety against disasters is prevented; therefore the rating given for disaster risk was a 4. The availability of workers in South Africa for nuclear power plant is most likely limited due to education standards and program availability; therefore a rating of 2 was given for the availability of workers to operate a plant. Nuclear power plant reactors can be reduced in size, but they are typically research reactors not used for electricity production; therefore a rating of 1 was given for the ability for a nuclear power plant operating on a small scale.
  • 45. 44 | P a g e Solar The public opinion of solar was given a rating of 4 because people like solar because it is renewable, can help save money in the long run, and is clean. A downside is the expensive costs. Operating costs for solar is rated a 4 because they are low the only costs are for maintenance and solar is usually easy to maintain [14]. Electricity Selection Criterion Weighting Factor (1-10) Rating Evaluation Public Opinion 7 4 28 Cost Operating Cost 9 4 36 Upfront Construction Cost 7 2 14 Resource Cost 3 5 15 Reliability 10 3 30 Key Impacts 8 3 24 Energy Output (MW) 9 1 9 Availability of Fuel 7 4 28 Risk Analysis Financial 8 2 16 Political 4 3 12 Disaster 9 5 45 Availability to have Workers Run the Plant 5 4 20 Ability to Operate on a Small Scale 7 5 35 Total 312
  • 46. 45 | P a g e Upfront Construction costs are very high because the technology is expensive and there needs to be a large amount of area to produce a significant amount of electricity. Therefore a rating of 2 was given. Resource cost is a 5 because solar uses the sun’s energy which is renewable and does not cost anything. Reliability is a 3 because solar does not work when there is no sun, at night or very cloudy days [14]. Key Impacts is a 3 because solar does not produce emissions but it does take up a large amount of land that could be used for farming or other, possibly more useful activities. Energy output is rated a 1 because solar is not efficient and needs a lot of space and sun to produce enough energy to power homes [14]. Availability of fuel is rated a 4 because the sun is renewable and is always there but there are cloudy periods and nights that have to be dealt with [14]. Financial risk is a 2 because solar is very expensive and there are other electricity producing means that are less expensive. There are also a lot of backup machines that are needed in case there is no sun which is also expensive and the cost of land is not cheap either. Political risk is rated a 3 because they like the public opinion and the clean side to solar; but the expensive part and the fact that it takes up a lot of land causes politicians to not favour solar plants. Disaster risk is rated a 5 because there is no chance of anything truly harmful happening with solar. Availability to have workers run the plant is rated a 4 because the only experts needed are those whole calculate the best angles for the solar collectors and those who have to do maintenance on them. Ability to operate on a small scale is rated a 5 because solar does not produce much energy and is not efficient; it is easy for solar to produce small amounts of electricity or thermal energy.
  • 47. 46 | P a g e Wind Generally the public opinion on renewable energy sources are particularly high because there are little no releases of greenhouse gases or harmful emissions. But with wind farms and wind turbines many people do not find them aesthetically pleasing, and do not want them around their homes. The opinion appears to be in the middle; therefore a rating of 3 was given for the public opinion of wind energy. Electricity Selection Criterion Weighting Factor (1-10) Rating Evaluation Public Opinion 7 3 21 Cost Operating Cost 9 3 27 Upfront Construction Cost 7 3 21 Resource Cost 3 5 15 Reliability 10 2 20 Key Impacts 8 3 24 Energy Output (MW) 9 3 27 Availability of Fuel 7 4 28 Risk Analysis Financial 8 2 16 Political 4 3 12 Disaster 9 5 45 Availability to have Workers Run the Plant 5 3 15 Ability to Operate on a Small Scale 7 5 35 Total 306
  • 48. 47 | P a g e Operating and maintenance cost of onshore and offshore wind farms is roughly $39.55/kw-a and $74/kW-a, respectively. Comparing these costs to other sources of energy, such as coal and solar power, they are roughly in the same range. Therefore a rating of 3 was given for the operating costs for a wind farm. Upfront construction costs for a wind farm can be a high cost, access roads may need to be built, and these roads must be able to carry a truck holding a long turbine blade. On offshore wind farms the costs are even higher, for example for an onshore wind farm the capital cost is approximately $2213/kW, while for an offshore farm it is $6230/kW. Comparing these to other means of energy production, they are average values; therefore a rating of 3 was given for the upfront construction costs. Since wind is always available, the resource costs are zero, therefore a rating of 5 was given. Although wind may be available and free it may not produce enough of the energy needs because wind is not the most reliable source of energy production. Therefore a rating 2 was given for the reliability of wind energy. Key impacts related to wind energy are relatively negligible. Wind farms produce little to no greenhouse gases during operation and is has a renewable energy resource. A minor impact may be finding and utilizing the appropriate land to construct a thriving wind farm. A wind farm needs an open concept to ensure wind flows through the farm. Since there are no major impacts related to wind energy, a rating of 3 was given. A typical wind farm can range from 30 MW to 400 MW depending on the size of the farm and its location, for example onshore or offshore. Wind energy has a promising outlook on energy output; therefore a rating of 3 was given for energy output. There are political risks related to wind energy, such as public complaining about noise pollution and aesthetics, which can lead to lobbyists and political figures attempting to tarnish the idea of wind energy. Therefore the rating given was a 3 for the political risk of wind energy. Wind energy does not have any major disaster risks during operation; therefore a rating of 5 was given. Wind farms may be located in remote areas, therefore the amount of people able to work at a wind farm are fairly small. Since many people do not like the way wind farms appear, they are moved to other locations further from the general public; therefore a rating of 3 is given for the availability of workers to operate the farm. Wind turbines are very versatile and be used in a smaller scale environment if necessary. A single turbine can produce anywhere from 1MW to 4.1 MW; therefore small farms can be constructed, or single use turbines can be implemented. A rating of 5 was given for the ability to operate at a smaller scale.
  • 49. 48 | P a g e Biomass The public opinion for biomass is rated a 4 because people like the idea behind renewable and clean energy sources and biomass is both. The only factor is that it is new and people are still uneducated about this energy source. Electricity Selection Criterion Weighting Factor (1-10) Rating Evaluation Public Opinion 7 4 28 Cost Operating Cost 9 2 18 Upfront Construction Cost 7 3 21 Resource Cost 3 4 12 Reliability 10 3 30 Key Impacts 8 4 32 Energy Output (MW) 9 3 27 Availability of Fuel 7 4 28 Risk Analysis Financial 8 3 24 Political 4 2 8 Disaster 9 4 36 Availability to have Workers Run the Plant 5 4 20 Ability to Operate on a Small Scale 7 1 7 Total 291
  • 50. 49 | P a g e Operating cost is a 2 because a plant needs to be maintained; the burnt biomass has to be cleaned every once in a while from inside the plant [14]. It is expensive to close down a plant for even short amounts of time. Upfront construction cost is rated at a 3 because it is setup as a typical plant and coal plants can be converted into biomass plants. It is expensive to buy land to grow the biomass and there still needs money put into the conversion [12]. Resource cost is a 4 because it is renewable but the biomass has to be bought and planted in an area that may cost money. Reliability is rated a 3 because if anything happens to the crops used for biomass than there is no power being produced and the plan needs cleaning every once and a while so it is shut down during this activity [14]. Key Impacts is a 4 because biomass can be regrown and the carbon emissions are the same as the ones released that are in the plant anyways so it is a cycle [14]. There are some emissions due to the machines needed but they are low. There is a fair bit of biomass needed so there is a large area that will be without biomass until new biomass grows there [14]. In South Africa the output for biomass energy is relatively small, but a biomass plant can have an installed capacity of 200MW, but this uses a lot of fuel to reach this capacity; therefore a rating of 3 given for energy output. Availability of fuel is rated a 4 because biomass can be grown and is renewable but large amounts are needed and if not enough land is secured there than there would be waiting for the biomass to grow which could take a long time. Financial risk is rated a 3 because if something happened to the crops than there would be money loss and there are cheaper methods to produce power that are more favourable. Political risk is rated a 2 because it is a new energy producing form and many people do not know about it or its consequences. This creates an uncertainty with politicians and they favour low cost and high power which biomass is not. Disaster risk is rated a 4 because there is not much disaster within the plant the crops that go along with a biomass plant may have some danger involved from the weather but it will grow again. Availability to have workers run the plant is rated a 4. The 4 is given to the plants that have the simple burning-to-boil-water design which can be run by non-experts that can shovel or do heavy labour as well as watch temperature and steam gages. Biomass is one of these plants and only needs experts to keep watch that everything is running smoothly. Ability to operate on a small scale is a 1 because it is a standard plant that produces power for many homes and does not have very much use or is not very efficient for running for low power designs.
  • 51. 50 | P a g e
  • 52. 51 | P a g e Appendix B – Transportation Evaluation Criteria Charts Diesel Transportation Selection Criterion Weighting Factor (1-10) Rating Evaluation Public Opinion 6 3 18 Fuel Cost 10 4 40 Reliability 9 4 36 Key Impacts 7 2 14 Availability of Fuel 8 5 40 Total 148 In regards to public opinion of diesel fuel used in transportation, there is no opinion from the general public because diesel fuel is consumed less as much compared to gasoline powered vehicles for transportation. Since diesel fuels are more directly related to truck drivers and companies, the general public does not bash or praise the use of diesel fuel. A rating of 3 was given for the public opinion of diesel fuel used in transportation. Fuel cost is an important aspect when dealing with transportation. Prices vary for diesel fuel depending on the location, and also the town or city. The rating for the fuel cost was given a value of 4. Diesel fuel engines are a particularly reliable source of transportation. The diesel engine has been around for a long time therefore being an older technology. With an old product, maintenance costs are decreased and increase the availability of the system. Since the concept of a diesel engine is particularly old and is reliable system, a rating of 4 was given for the reliability of diesel energy. There are several impacts related to the use of diesel energy, which include the release of toxic emissions. Diesel exhaust contains air contaminants such as carbon monoxide, sulphur dioxide, mercury compounds, etc. Diesel engines release more emissions than a regular gasoline engine under equivalent loads and conditions. Therefore a rating of 2 was given for the key impacts related to diesel energy. Diesel is highly available for consumers to use at a relatively low price. Diesel is manufactured in the same process as obtaining gasoline through a crude oil distillation tower. Since crude oil does not need to be refined nearly as much to produce diesel compared to gasoline, it is a cheaper fuel. A rating of the 5 was given for the availability of diesel fuel.
  • 53. 52 | P a g e Gasoline Transportation Selection Criterion Weighting Factor (1-3) Rating Evaluation Public Opinion 6 4 24 Fuel Cost 10 3 30 Reliability 9 5 45 Key Impacts 7 3 21 Availability of Fuel 8 5 40 Total 160 The public opinion of gasoline is a 4 because it is needed in most cars that are on the road and it is readily available and easy to access. There are harmful emissions that come from combustion of gas, which lowers the opinion to a 4. Fuel cost is rated a 3 because gasoline is not the most expensive but it is fairly expensive especially since most people need it on a weekly bases. Reliability is rated a 5 because gasoline has been proven to be reliable for years it gets people a far distance and does not do harm to an automobile. Key impacts is rated a 3 due to the harmful emissions that are produced by gasoline combustion in an engine. Availability of fuel is rated a 5 because there are gasoline stations everywhere, also multiple ones in that area, there are automobiles because it is the most widely used form for energy used in an automobile. Electric/Hybrid Transportation Selection Criterion Weighting Factor (1-3) Rating Evaluation Public Opinion 6 4 24 Fuel Cost 10 4 40
  • 54. 53 | P a g e Reliability 9 4 36 Key Impacts 7 4 28 Availability of Fuel 8 2 16 Total 144 There is a relatively high public opinion with electric and hybrid cars, mostly because these cars are a clean alternative to gasoline and diesel powered engines. There are several disadvantages with electric cars, such as the batteries take a required amount of time to recharge. A rating of 4 was given for the public opinion of electric and hybrid vehicles. Many electric vehicles have operate from approximately 105 MPGe (miles per gallon equivalent), meaning the distance travelled per energy consumed. 1 gallon of gasoline is equivalent to 33.7 kWh, therefore electric vehicles on average annually cost approximately $600 based on 15,000 miles annual driving and electricity cost of $0.12/kWh [31]. A rating of 4 was given for fuel cost. A rating of 4 was given for fuel cost. Electric and hybrid vehicles are not reliable compared to internal combustion engines such as diesel and natural gas. Electric vehicles are a fairly new technology and are still under development; therefore the long term effects are unknown. A rating of 4 was given for the reliability of electric and hybrid vehicles. Key impacts related to electric and hybrid cars are mass battery production, which leads to larger amounts of waste. Fortunately, electric car batteries can be recycled in the same manner regular batteries for cellphones and laptops are recycled. Another key impact is if an entire population switches to electric vehicles, the grid must be able to supply the necessary amount of energy. Therefore a rating of 4 was given for key impacts. There are no charging stations in the same manner gasoline stations exist; therefore fuel must be taken from the owner’s home. Since electric cars can only work for so long, the user must be able to make a round trip on every trip. Also, if charging were available for electric cars at stations it would take fairly long to recharge the battery; therefore a rating of 2 was given for availability of fuel.