Nepse Technical Analysis September 25 - September 29, 2016
•
0 j'aime•197 vues

Nepse Weekly Technical Analysis September 25 - September 29, 2016

Recommandé
Recommandé
Contenu connexe
Tendances
Tendances (20)
Similaire à Nepse Technical Analysis September 25 - September 29, 2016
Similaire à Nepse Technical Analysis September 25 - September 29, 2016 (19)
Plus de Kriti Capital & Investments Ltd.
Plus de Kriti Capital & Investments Ltd. (7)
Dernier
Dernier (20)
Nepse Technical Analysis September 25 - September 29, 2016
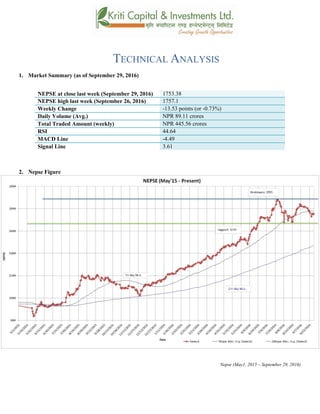
- 1. TECHNICAL ANALYSIS 1. Market Summary (as of September 29, 2016) NEPSE at close last week (September 29, 2016) 1753.38 NEPSE high last week (September 26, 2016) 1757.1 Weekly Change -13.53 points (or -0.73%) Daily Volume (Avg.) NPR 89.11 crores Total Traded Amount (weekly) NPR 445.56 crores RSI 44.64 MACD Line -4.49 Signal Line 3.61 2. Nepse Figure Nepse (May1, 2015 – September 29, 2016)
- 2. 3. Trend Analysis The Nepse index declined by 13.53 points (or down -0.73%) to close at 1753.38 last week. The index fell by - 2.05% on Sunday. However, it bounced back up the very next day by 1.53%. Nepse continues to hover below the 50-day moving average, indicating presence of short term bearish movement. Nonetheless, it is still moving well above the 200-day moving average, signifying that long term market outlook looks good. The average volume turnover last week decreased significantly to NPR 89.11 crores from NPR 141.43 crores the week prior. 4. Resistance and Support Immediate Support 1680 Support 2 1600 Immediate Resistance 1880 Resistance 2 The Nepse index hovered around mid 1700 in the course of last week. The current support and resistance level stands the same at 1680 and 1880 respectively. The market seems to be in a selling pressure as dashain festival approaches. However, long term bullish momentum continues to loom over the market, which could lead Nepse to enter 1800 territory in coming weeks. 5. Trend Indicator a.) MACD The MACD is a momentum oscillator formed by using two different types of moving averages, which provides specific buying or selling signals. When a MACD line crosses above the signal line, it is considered to be a positive sign and indicates a time to buy, and vice-versa. The Macd and the signal line, at the beginning of last week, stood at 3.44 and 12.39 respectively. In the course of the week, the macd line declined by 7.93 points, and the signal line by 8.78 points to close at - 4.49 and 3.61 points respectively. The macd line entering the negative territory, as well as moving below the signal line, signifies a bearish run in the market. b.) RSI RSI is a form of leading indicator that is believed to be most effective during periods of sideways movement. Such indicators may create numerous buy and sell signals that are useful when the market is not clearly trending upwards or downwards.
- 3. The RSI, at the beginning of last week, stood at 38.14 points. In the course of the week, it gained 6.50 points to close at 44.64 level. If the RSI continues to give a neutral stance as it is moving in a horizontal manner. c.) Bollinger Bands The Bollinger Band is a technical indicator that consists of a moving average (21-day) along with two trading bands above (upper band) and below it (lower band). The bands are an indication of volatility, which are represented by calculating standard deviation. The benchmark index moved closer towards the lower bollinger band at the beginning of last week, signifying selling pressure in the market. The gap between the upper and lower bands has further converged, indicating a decrease in market volatility.
- 4. 6. Overview The Nepse index fell by 13.53 points (or down -0.73%) to close at 1753.38 last week. Nepse is moving above the 200-day, indicating long-term positive outlook of the market. However, it is currently hovering below the 50-day moving average, suggesting a presence of short term selling pressure in the market. The macd indicator gives a bearish indication as macd line has entered the negative territory, and is moving below the signal line. The RSI gives a neutral stance as it is hovering at 44.64 level. The gap between the upper and lower bands has further converged, indicating a decrease in market volatility. The support and resistance level stands the same at 1680 and 1880 respectively.
- 5. k|fljlwsljZn]if0f !_ahf/ ;f/f+z -c;f]h!#, @)&#;Ddsf]_ aGb cªs -c;f}h !#, @)&#_ !&%#=#* pRr cªs -uPsf] ;ftf_ !&%&=! ;fKtflxs kl/jt{g – !#=%# -–)=&#k|ltzt_ b}lgscf};t Jofkf/ ¿=*(=!!s/f]8 s'n ;fKtflxsJofkf/ ¿ $$%=%^ s/f]8 cf/P;cfO{ $$=^$ PdP;L8L –$=$( l;UgnnfO{g #=^! @_ ahf/ k|j[lt Nepse (May1, 2015 – September 29, 2016)
- 6. #_ 6]«G8 ljZn]if0f uPsf] ;ftfg]K;] kl/;"rsdf!#=%#cªssf] lu/fj6 b]lvof]h;sf] kmn:j?kahf/ !,&%#=#*cªsdfaGbeof] . ;ftfsf] klxnf] lbg @=)%Ü n] tnem/]sf] ahf/ ef]ln kN6 km]l/ dflycfPsf] cj:yflyof] .cf};t sf/f]af/ kl/df0fdfeg] !$!=$# s/f]8af6*(=!! s/f]8 dfcfPsf] cj:yf b]lvof] . g]K;] kl/;"rs %) lbg] d'leËPe/]h eGbftnrn]sf] cj:yfn] 5f]6f] ;dosf] nfluahf/dflaol/; 6]«G8 b]lvPsf] 5 . t/ @)) lbg] d'leËeGbfdfly g} rln/x]sf] g]K;]n] ;du|dfahf/sf] l:ylt /fd|f] /x]sf] b]lvG5 . $_ 6]jftyfk|lt/f]w cªs glhssf] 6]jfcªs !^*) 6]jfcªs @ !^)) glhssf] k|lt/f]w cªs !**) uPsf] ;ftf g]K;] kl/;"rsdflu/fj6 g} b]lvof] / xfnsf] nflugofFk|lt/f]w cªs !**) g} /x]sf] cj:yf 5 . bz} kj{ glhscfO{/x]sf] cj:yfdfahf/ s]xL 36]sf] cj:yf /x]sf] 5 hf] g]K;]dflgs} jif{ b]lv 6]«G8 g} h:tf] b]lvG5 . %_ g]K;] 6]«G8 ;"rs s_ d'leª Pe/]hsGeh]{G; 8fOeh]{G; -PdP;L8L_ PdP;L8Ldf b'O{ cf]6f /]vf x'G5g, h;df Pp6fn] ahf/sf] lbzf kl/jt{gsf] ;+s]t u5{ eg] csf]{n] ahf/sf] k|j[lQ -6«]08_ b]vfpg] u5{ . olb PdP;L8L /]vfn] l;Ung /]vfnfO{ tnaf6 dfly sf6]dfo;nfO{ ;sf/fTds ;+s]tsf ?kdflnO{G5 / o;n] z]o/x? lsGg] ;+s]t ub{5 . ;ftfsf] z'?df PdP;L8L nfO{g tyfl;UgnnfO{g s|dzM!*=^&tyf!&=)*sf] l:yltdf /x]sf] lyof] . PdP;L8LnfO{gdflu/fj6 b]lvof] .xfnsf] nflu PdP;L8LnfO{g tyfl;UgnnfO{g s|dz M –$=$( tyf#=^! /x]sf] 5 / PdP;L8L nfO{g l;UgnnfO{g eGbftncfPsf] l:yltn] ahf/dfa'lnz l:Ylt /x]sf] b]lvG5 5 . .
- 7. v_ l/n]l6j :6«]Gy OG8]S; -cf/P;cfO{_ cf/P;cfO{ k|fljlwsljZn]if0fsf] o:tf] cf}hf/ xf], h;nfO{ Pstlkm{ ?kdfrln/x]sf] ahf/dfJofkf/ /0fgLlt agfpg a9L pkof]uL dflgG5 . To;}u/L, o;n] ahf/dfvl/b / ljlqmsf] :ki6 ;+s]t b]vfpg] u5{ . cf/P;cfO{uPsf] ;ftfsf] z'?df#*=!$cªsdf/x]sf] lyof]tyf ;ftfsf] cGTolt/ cf/P;cfO{ $$=^$cªsdf /xof].xfnsf] cj:yfdfcf/P;cfO{df ;fO{8j]h d'ed]G6 b]lvPsf] 5 . u_ af]lnªu/ Aof08 af]lnªu/ Aof08 Ps k|fljlwsljZn]if0f ;"rsxf] h;df @!–lbg] d'leËPe/]hsf ;fyb'O{ Aof08 -Pp6f dfly_ / Pp6f tn_ x'G5g . lo Aof08x?n] cl:y/tfsf] ;+s]t ub{5g, h'g :6fG88{ 8]leP;g u0fgf u/]/ kQfnufO{G5 .
- 8. g]K;] kl/;"rsuPsf] ;ftftNnf] Jof08sf]glhscfPsf] cj:yfn] ahf/df a]Rg] xf]8afhL a9]sf] ;+s]t blvG5 . pkNnf] tyftNnf] Jof08 aLrsf] b'/Ldfeg] sdLcfPsf]n]cl:yt/tfklg 36]sf] b]lvG5 . ;du{dfM uPsf] ;ftf g]K;] kl/;"rsdf!#=%#cªssf] lu/fj6 b]lvof]h;sf] kmn:j?kahf/ !&%#=#*cªsdfaGbeof] . clxn] klg @)) lbg] d'leËeGbfdflyuO{/x]sf] cj:yfn] ahf/ ;sf/fTds l:yltdf g} /x]sf] ;+s]t ub{5 . PdP;L8LnfO{gdf b]lvPsf] lu/fj6n]lsGg] xf]8afhLdf eg] sdLcfPsf]b]lvG5 . clxn] klg&) cªseGbftnem/]sf]] cf/P;cfO{n] ahf/ cf]e/ a6 l:yltdf g/x]sf] ;+s]t ub{5 / a]Rg] xf]8afhL b]lvPsf] 5 . pkNnf] tyftNnf] Jof08 aLrsf] b'/Ldfeg] cfPsf] ghlbstfn]ahf/sf] cl:y/tfeg]36]sf] ;+s]t ub{5 .xfnsf] cj:yfdfgofF 6]jfcªstyfk|lt/f]w cªs s||dzM !^*) tyf !**) sfod /x]sf] 5 .