1. Is Gold Worth Its Weight in a Portfolio?
During a weak global economy and uncertain financial markets, many investors tout the benefits of
holding gold. Some proponents claim that gold deserves a significant weighting in most investors’
portfolios. Gold’s often-cited portfolio benefits include a strong long-term return, a hedge against
inflation, and safe haven during turbulent times.
But does the evidence build a case for holding gold as a separate asset class? Let’s look at historical
returns for the answers.
Gold’s Long-Term Performance
Investors who think of gold as having strong long-term returns base their belief on two strong
performance periods in the past four decades—the most recent decade and the 1970s. These periods
account for most of gold’s price appreciation.
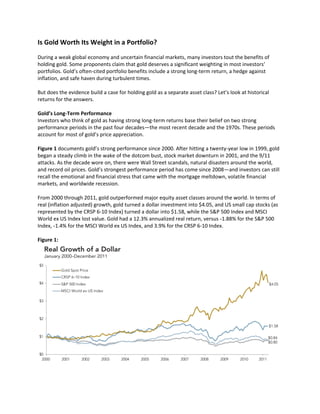
Figure 1 documents gold’s strong performance since 2000. After hitting a twenty-year low in 1999, gold
began a steady climb in the wake of the dotcom bust, stock market downturn in 2001, and the 9/11
attacks. As the decade wore on, there were Wall Street scandals, natural disasters around the world,
and record oil prices. Gold’s strongest performance period has come since 2008—and investors can still
recall the emotional and financial stress that came with the mortgage meltdown, volatile financial
markets, and worldwide recession.
From 2000 through 2011, gold outperformed major equity asset classes around the world. In terms of
real (inflation adjusted) growth, gold turned a dollar investment into $4.05, and US small cap stocks (as
represented by the CRSP 6-10 Index) turned a dollar into $1.58, while the S&P 500 Index and MSCI
World ex US Index lost value. Gold had a 12.3% annualized real return, versus -1.88% for the S&P 500
Index, -1.4% for the MSCI World ex US Index, and 3.9% for the CRSP 6-10 Index.
Figure 1:
2. For illustrative purposes only. Sources for all figures: CRSP data provided by the Center for Research in Security Prices, University of Chicago;
the S&P data are provided by Standard & Poor's Index Services Group; securities and commodities data provided by Bloomberg; MSCI data
copyright 2012, all rights reserved. Past performance is no guarantee of future results, and there is always the risk that an investor may lose
money. The indices are not available for direct investment. Performance does not reflect the expenses associated with the management of
an actual portfolio.
Now let’s step back in time to the other strong decade for gold—the 1970s. Figure 2 documents gold’s
performance relative to equities after the US dropped the gold standard in 1971. A dollar of gold in 1971
appreciated to $8.91 in real terms by January 1980, when it peaked at $850 per ounce, returning over
27% a year and far surpassing the performance of other asset groups.
Figure 2:
For illustrative purposes only. Sources for all figures: CRSP data provided by the Center for Research in Security Prices, University of Chicago;
the S&P data are provided by Standard & Poor's Index Services Group; securities and commodities data provided by Bloomberg; MSCI data
copyright 2012, all rights reserved. Past performance is no guarantee of future results, and there is always the risk that an investor may lose
money. The indices are not available for direct investment. Performance does not reflect the expenses associated with the management of
an actual portfolio.
However, much of this rapid appreciation occurred under special circumstances in which US investors
could not benefit directly.
Here’s why: In August 1971, President Nixon took the US off the gold standard, and the price was reset
to $38 an ounce. In 1973, the US government decoupled the dollar’s value from gold, and the price was
allowed to float freely. During 1974, the price of gold quickly shot up to $120 per ounce in the free
market. Beginning in 1975, the government removed ownership restrictions and US citizens were free to
directly own gold for the first time since 1933.
So, US investors could not participate in gold’s price appreciation during the first half of the 1970s, and if
you disregard those early performance years, gold loses much of its glitter. From 1975 through 1980, a
dollar invested in gold grew to only $2.37 (versus $8.91), reflecting an 18.4% annualized real rate of
return—considerably less than the 27% return for the entire decade. Compare this performance with a
28.9% real annualized return for US small cap stocks (CRSP 6-10 Index), 6.9% for the S&P 500, and 9.4%
for non-US stocks ( MSCI World ex US Index) for the shorter period.
3. Some investors who are old enough to remember the 1970s associate the higher demand for gold with
turbulent times. The decade was marked by political unrest, war, the 1973–74 bear market, two
worldwide oil shocks (1973 and 1979), stagflation, Middle East conflict, and Cold War tensions. In some
ways, the 1970s resembled the first decade of this century.
Viewed in isolation, the periods suggest that gold offers a reliable source of returns during economic
and market distress. But the details show that rising demand for gold in the US was due not only to
economic uncertainty, but also to changing monetary policy and federal legislation regarding individual
ownership of bullion.
Fortunately, times eventually improved—and from a broader historical perspective gold has not
delivered the long-term performance that some investors imagine, especially during more stable
economic periods. Figure 3 documents the real growth of a dollar invested in gold and equities over the
entire period—from 1971 through 2011. Gold has provided lower inflation-adjusted growth than other
assets ($7.33 per dollar invested) and a lower average return—4.9% per year versus 5.3% for the S&P
500, 5.0% for non-US stocks, and 7.3% for US small cap stocks.
Figure 3:
For illustrative purposes only. Sources for all figures: CRSP data provided by the Center for Research in Security Prices, University of Chicago;
the S&P data are provided by Standard & Poor's Index Services Group; securities and commodities data provided by Bloomberg; MSCI data
copyright 2012, all rights reserved. Past performance is no guarantee of future results, and there is always the risk that an investor may lose
money. The indices are not available for direct investment. Performance does not reflect the expenses associated with the management of
an actual portfolio.
If one disregards the 1971–1974 period when US investors could not own it directly, gold’s long-term
performance drops substantially. From 1975 through 2011, gold produced a real annualized return of
only 1.82% and grew an invested dollar to only $1.95 (versus the $7.33 shown above). US small cap
stocks returned 10.6% ($41.73), the S&P 500 returned 7.1% ($13.07), and non-US stocks returned 5.5%
($7.49).
4. Now let’s consider the twenty years between gold’s two high-performance periods in the 1970s and
2000s. Figure 4 shows growth of a dollar for the same asset groups from 1980 through 1999, during
gold’s period of extreme underperformance. Those decades are generally known for global economic
expansion and positive stock market returns. Yet, gold delivered a -6.5% annualized return, compared
with 10.7% for US small cap stocks, 13.3% for the S&P 500, and 9.2% for non-US stocks (MSCI World ex
US Index).
A dollar invested in gold dropped to 26 cents in real terms, while the other assets grew substantially.
Figure 4:
For illustrative purposes only. Sources for all figures: CRSP data provided by the Center for Research in Security Prices, University of Chicago;
the S&P data are provided by Standard & Poor's Index Services Group; securities and commodities data provided by Bloomberg; MSCI data
copyright 2012, all rights reserved. Past performance is no guarantee of future results, and there is always the risk that an investor may lose
money. The indices are not available for direct investment. Performance does not reflect the expenses associated with the management of
an actual portfolio.
So, from a long-term perspective, gold has not experienced a reliable or sustained rise in value. In fact,
its price appreciation has been limited to unpredictable, isolated episodes of high demand. Investors
who attempted to time these episodes exposed their wealth to potentially higher risk and to the
opportunity cost of missing out on stock market growth.
Gold as an Inflation Hedge
Some investors perceive gold as a good hedge against inflation and point to its recent record prices as
evidence. Figure 5 below shows gold’s performance in nominal and inflation-adjusted terms from its
price peak in 1980 through 2011. Gold’s price has climbed substantially in nominal terms. But when
adjusted for inflation, a dollar of gold in 1980 was worth $1.04 at the end of 2011.
5. Figure 5:
Source: Commodities data provided by Bloomberg. Past performance is no guarantee of future results, and there is always the risk that an
investor may lose money. For illustrative purposes only.
Of course, gold’s performance relative to inflation has varied according to the time frame measured. In
some periods, gold has outperformed inflation, while in other periods gold has failed to match it. For
example, from 1970 through 2005, consumer prices more than doubled while gold lost 20% of its value.1
Gold’s unreliable performance relative to inflation also comes with much higher volatility. Since 1970, its
standard deviation has been over 19%, compared with 1.2% for the Consumer Price Index (CPI).2 By this
measure, gold is over fifteen times more volatile than the CPI.
Gold as a Portfolio Diversifier
Proponents also claim that gold offers a portfolio diversification benefit due to its low historical
correlation with stocks. (Correlation measures how closely two securities or asset groups perform
relative to each other over a given time period. 3) This may be true when gold is held as an incremental
part of a broader diversified commodity strategy within a portfolio. But correlation is not the only factor
to consider in diversification. Volatility also matters, and history shows that, while gold has a long-term
return similar to the S&P 500 Index, its volatility approaches that of US small value stocks, an asset class
that historically has demonstrated a higher average return for the higher risk. So, holding gold as an
asset class can make a portfolio considerably more volatile, which may offset the potential benefit of
low correlation.
Also, according to modern financial principles, the components of a portfolio should have an expected
return. As a material input, however, gold does not offer the potential for generating income or
earnings. Its only source of return is price appreciation caused by shifting supply and demand. As shown
in historical performance, price appreciation is not a certainty.
6. These characteristics make gold a speculative asset, like currency or collectibles. If you put gold in a
vault and wait a few decades, it will not produce anything, and its value will reflect the current spot
market price. In fact, holding physical bullion may incur negative cash flows due to storage, insurance,
and other costs. In contrast, a stock reflects ownership in a business enterprise that seeks to generate
profits and produce more wealth. Investors who put their capital to work in the economy expect a
potential return from cash flows and appreciation.
Summary
The evidence raises doubt about gold as an essential component in a portfolio. Over time, gold has not
delivered significant growth relative to equities. While in real terms gold has preserved its value, it may
not closely track inflation over shorter time periods. Moreover, gold’s early and recent performance
should not obscure the two decades in which it depreciated considerably. Finally, gold is more volatile
than other asset groups and does not generate positive cash flows, reducing its potential benefit as a
portfolio stabilizer.
Famed investor Warren Buffett aptly summarized gold’s speculative nature, non-productive quality, and
high opportunity cost in a Fortune article in February:
Today, the world’s gold stock is about 170,000 metric tons. If it were all melded together, it
would form a cube of about 68 feet per side (fitting within a baseball infield). At $1,750 per
ounce, it would be worth $9.6 trillion.
With the same amount of money, you could buy all US cropland (400 million acres with
output of $200 billion annually) plus 16 Exxon Mobils (the world’s most profitable company,
one earning more than $40 billion annually), and still have about $1 trillion in cash.4
Some investors may prefer to hold a modest measure of gold in their portfolio, if only to feel better
about uncertain times, or to include gold as one of several components in a broader commodity
strategy. But they should think hard before concentrating a large part of their wealth in it.
Past performance is no guarantee of future results. All expressions of opinion are subject to change
without notice in reaction to shifting market conditions. This article is distributed for informational
purposes, and it is not to be construed as an offer, solicitation, recommendation, or endorsement of any
particular security, products or services.
Dimensional Fund Advisors LP is an investment advisor registered with the US Securities and Exchange
Commission.
Notes
1. Francesco Guerrera, “A Golden Age for Gold Loses Some of Its Luster,” Wall Street Journal, October 4, 2011.
2. Standard deviation is the statistical measure of the degree to which an individual value in a probability distribution tends to
vary from the mean of the distribution.
3. Correlation is computed into what is known as the correlation coefficient, which ranges between ‒1.0 and +1.0. Assets that
have negative correlation tend to move in opposite directions, while assets with positive correlation have more similar
performance. A zero correlation indicates no relation in performance. From 1971 to 2011, gold had a slightly negative long-
term correlation with the US large cap stocks (‒0.001) and one-month US T-bills (‒0.07), and low correlation with US small
cap stocks (+0.022). Correlation with non-US stocks was moderately positive (+0.21).
4. Warren Buffett, “Why Stocks Beat Gold and Bonds,” Fortune, February 9, 2012.