Randomness of returns_historical_asset_class_ranking_2014 skittles
•
1 j'aime•1,811 vues

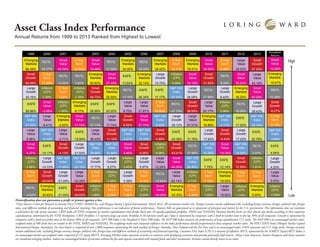
The Need for Diversification (“Skittles Chart”) Asset Class Index Performance The “Skittles Chart” is a great way to show investors the randomness of investment returns from one year to the next, reinforcing the potential benefits of Asset Class Investing as an alternative to active management.
Recommandé

Recommandé
Contenu connexe
Tendances
Tendances (20)
Similaire à Randomness of returns_historical_asset_class_ranking_2014 skittles
Similaire à Randomness of returns_historical_asset_class_ranking_2014 skittles (20)
Plus de Better Financial Education
Plus de Better Financial Education (20)
Dernier
Dernier (20)
Randomness of returns_historical_asset_class_ranking_2014 skittles
- 1. Asset Class Index Performance Annual Returns from 1999 to 2013 Ranked from Highest to Lowest* Diversification does not guarantee a profit or protect against a loss *Data Sources: Center for Research in Security Prices (CRSP), BARRA Inc. and Morgan Stanley Capital International, March 2014. All investments involve risk. Foreign securities involve additional risks, including foreign currency changes, political risks, foreign taxes, and different methods of accounting and financial reporting. Past performance is not indicative of future performance. Treasury bills are guaranteed as to repayment of principal and interest by the U.S. government. This information does not constitute a solicitation for sale of any securities. CRSP ranks all NYSE companies by market capitalization and divides them into 10 equally-populated portfolios. AMEX and NASDAQ National Market stocks are then placed into deciles according to their respective capitalizations, determined by the NYSE breakpoints. CRSP Portfolios 1-5 represent large-cap stocks; Portfolios 6-10 represent small caps; Value is represented by companies with a book-to-market ratio in the top 30% of all companies. Growth is represented by companies with a book-to-market ratio in the bottom 30% of all companies. S&P 500 Index is the Standard & Poor’s 500 Index. The S&P 500 Index measures the performance of large-capitalization U.S. stocks. The S&P 500 is an unmanaged market value- weighted index of 500 stocks that are traded on the NYSE, AMEX and NASDAQ. The weightings make each company’s influence on the index performance directly proportional to that company’s market value. The MSCI EAFE Index (Morgan Stanley Capital International Europe, Australasia, Far East Index) is comprised of over 1,000 companies representing the stock markets of Europe, Australia, New Zealand and the Far East, and is an unmanaged index. EAFE represents non-U.S. large stocks. Foreign securities involve additional risks, including foreign currency changes, political risks, foreign taxes and different methods of accounting and financial reporting. Consumer Price Index (CPI) is a measure of inflation. REITs, represented by the NAREIT Equity REIT Index, is an unmanaged market cap-weighted index comprised of 151 equity REITS. Emerging Markets index represents securities in countries with developing economies and provide potentially high returns. Many Latin American, Eastern European and Asian countries are considered emerging markets. Indexes are unmanaged baskets of securities without the fees and expenses associated with mutual funds and other investments. Investors cannot directly invest in an index. Asset Class Performance *DataSources:CenterforResearchinSecurityPrices(CRSP),BARRAInc.andMorganStanleyCapitalInternational,March2014.Allinvestmentsinvolverisk.Foreignsecuritiesinvolveadditionalrisks,includingforeign currencychanges,politicalrisks,foreigntaxes,anddifferentmethodsofaccountingandfinancialreporting.Pastperformanceisnotindicativeoffutureperformance.Treasurybillsareguaranteedastorepaymentofprincipal and interest by the U.S. government.This information does not constitute a solicitation for sale of any securities. CRSPranks all NYSE companies by market capitalization and divides them into 10 equally-populated portfolios.AMEX and NASDAQ National Market stocks are then placed into deciles according to their respective capitalizations, determined by the NYSE breakpoints. CRSPPortfolios 1-5 represent large-cap stocks; Portfolios6-10representsmallcaps;Valueisrepresentedbycompanieswithabook-to-marketratiointhetop30%ofallcompanies.Growthisrepresentedbycompanieswithabook-to-marketratiointhebottom30%of allcompanies.S&P500IndexistheStandard&Poor’s500Index.TheS&P500Indexmeasurestheperformanceoflarge-capitalizationU.S.stocks.TheS&P500isanunmanagedmarketvalue-weightedindexof500 stocksthataretradedontheNYSE,AMEXandNASDAQ.Theweightingsmakeeachcompany’sinfluenceontheindexperformancedirectlyproportionaltothatcompany’smarketvalue.TheMSCIEAFEIndex(Morgan StanleyCapitalInternationalEurope,Australasia,FarEastIndex)iscomprisedofover1,000companiesrepresentingthestockmarketsofEurope,Australia,NewZealandandtheFarEast,andisanunmanagedindex. EAFErepresentsnon-U.S.largestocks.Foreignsecuritiesinvolveadditionalrisks,includingforeigncurrencychanges,politicalrisks,foreigntaxesanddifferentmethodsofaccountingandfinancialreporting.Consumer Price Index (CPI) is a measure of inflation. REITs, represented by the NAREIT Equity REIT Index, is an unmanaged market cap-weighted index comprised of 151 equity REITS. Emerging Markets index represents 20131999 2000 2001 2002 2003 2004 2005 2006 2007 2008 2009 2010 2011 2012 Annualized Returns Emerging Markets Small Value REITs 5 Year Gov't Small Value Emerging Markets REITs Emerging Markets REITs 5 Year Gov't Emerging Markets Small Value 5 Year Gov't Large Value 66.49% 26.37% 40.59% 12.93% 74.48% 31.58% 34.00% 35.06% 39.42% 13.11% 78.51% 34.59% 9.46% 28.03% Emerging Markets 10.91% Small Growth 5 Year Gov't REITs REITs Emerging Markets Small Value Emerging Markets EAFE Large Growth Inflation (CPI) Small Value Small Growth Small Value REITs 54.06% 12.59% 13.93% 3.82% 55.82% 27.33% 13.54% 32.14% 15.70% 0.09% 70.19% 31.83% 8.29% 20.32% Small Value 12.09% Large Growth Inflation (CPI) 5 Year Gov't Inflation (CPI) Small Growth Emerging Markets REITs EAFE EAFE S&P 500 Index Large Growth Large Growth REITs Emerging Markets 30.16% 3.39% 7.62% 2.38% 54.72% 25.55% 12.16% 26.34% 11.17% -37.00% 38.09% 27.96% 6.42% 18.22% REITs 10.36% Small Value EAFE Inflation (CPI) Emerging Markets Large Value EAFE EAFE Large Value 5 Year Gov't Small Growth REITs Large Value Inflation (CPI) REITs 26.96% -3.08% 1.55% -6.17% 38.59% 20.25% 9.70% 21.87% 10.05% -37.73% 38.09% 20.17% 2.96% 18.06% 5 Year Gov't 5.13% S&P 500 Index Large Value Emerging Markets Small Value Large Value REITs Small Growth Small Value S&P 500 Index Large Growth Large Value Emerging Markets S&P 500 Index EAFE 21.04% -6.41% -2.62% -11.72% 37.13% 17.74% 6.02% 21.70% 5.49% -39.12% 37.51% 18.88% 2.11% 17.32% S&P 500 Index 4.68% Large Value S&P 500 Index Large Value Large Value EAFE Small Growth S&P 500 Index S&P 500 Index Small Growth Large Growth EAFE EAFE Small Growth Large Growth 6.99% -9.10% -2.71% -15.94% 36.43% 11.16% 4.91% 15.79% 4.99% -43.38% 31.78% 17.64% -4.43% 17.22% EAFE 4.54% Small Value Small Growth EAFE Large Growth S&P 500 Index S&P 500 Index Small Value Small Growth Inflation (CPI) Small Growth S&P 500 Index REITs Small Value S&P 500 Index 4.37% -14.17% -4.13% -21.93% 28.68% 10.88% 4.46% 9.26% 4.08% -43.41% 27.99% 15.06% -10.78% 16.00% Large Growth 4.22% Inflation (CPI) Large Growth S&P 500 Index S&P 500 Index Large Growth Large Growth Inflation (CPI) Large Growth Large Value Small Value S&P 500 Index EAFE EAFE Small Growth 2.68% -14.33% -11.89% -22.10% 17.77% 5.27% 3.42% 5.97% -12.24% -44.50% 26.46% 7.75% -12.14% 12.59% Small Growth 6.27% 5 Year Gov't Small Growth Large Growth Large Value 5 Year Gov't Inflation (CPI) Large Growth 5 Year Gov't Large Value REITs Inflation (CPI) 5 Year Gov't Emerging Markets Inflation (CPI) -1.77% -24.50% -21.05% -30.28% 2.40% 3.26% 3.39% 3.14% -15.69% -53.14% 2.72% 7.12% -18.42% 1.74% Inflation (CPI) 2.38% Emerging Markets REITs Small Growth EAFE Inflation (CPI) 5 Year Gov't 5 Year Gov't Inflation (CPI) Small Value Emerging Markets 5 Year Gov't Inflation (CPI) Large Value -4.62% -30.83% -21.44% -34.63% 1.88% 2.25% 1.36% 2.54% -18.38% -53.33% -2.40% 1.50% -19.90% 5 Year Gov't 2.07% Large Value 2.53% Small Growth 47.34% Large Value 43.19% Small Value 40.29% Large Growth 39.43% S&P 500 Index 32.39% EAFE 22.78% REITs 2.47% Inflation (CPI) 1.51% 5 Year Gov't -1.07% Emerging Markets -2.60% High Low