
Recommandé
Contenu connexe
Tendances
Tendances (20)
En vedette
En vedette (20)
Similaire à Sales Stats June 15, 2011
Similaire à Sales Stats June 15, 2011 (12)
Plus de Linda Twining
Plus de Linda Twining (20)
Dernier
Dernier (20)
Sales Stats June 15, 2011
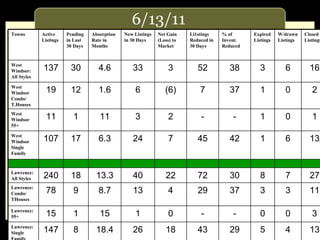
- 1. 6/13/11 Towns Active Listings Pending in Last 30 Days Absorption Rate in Months New Listings in 30 Days Net Gain (Loss) to Market Li1stings Reduced in 30 Days % of Invent. Reduced Expired Listings W/drawn Listings Closed Listings West Windsor: All Styles 137 30 4.6 33 3 52 38 3 6 16 West Windsor Condo/ T.Houses 19 12 1.6 6 (6) 7 37 1 0 2 West Windsor 55+ 11 1 11 3 2 - - 1 0 1 West Windsor Single Family 107 17 6.3 24 7 45 42 1 6 13 Lawrence: All Styles 240 18 13.3 40 22 72 30 8 7 27 Lawrence: Condo/ THouses 78 9 8.7 13 4 29 37 3 3 11 Lawrence: 55+ 15 1 15 1 0 - - 0 0 3 Lawrence: Single Family 147 8 18.4 26 18 43 29 5 4 13
- 2. 6/13/11 Towns Active Listings Pending in Last 30 Days Absorption Rate in Months New Listings in 30 Days Net Gain (Loss) to Market Listings Reduced in 30 Days % of Invent. Reduced Expired Listings W/drawn Listings Closed Listings PlainsboroAll Styles 112 17 6.6 27 10 25 22% 6 0 22 Plainsboro Condo/ THouses 69 6 11.5 17 11 13 19% 3 0 12 Plainsboro 55+ 13 4 3.25 2 (2) 2 15% 1 0 1 Plainsboro Single Family 30 7 4.3 8 1 10 33% 2 0 9 Cranbury: All Styles 29 1 29 6 5 10 34% 2 0 1
- 3. 6/13/11 Towns Active Listings Pending in Last 30 Days Absorption Rate in Months New Listings in 30 Days Net Gain (Loss) to Market Listings Reduced in 30 Days % of Invent. Reduced Expired Listings W/drawn Listings Closed Listings Ewing: All Styles 322 18 17.9 53 35 87 27 12 11 21 Ewing : Condo/ T.Houses 47 2 23.5 11 9 14 30 1 3 2 Ewing 55+: 13 1 13 2 1 - - 0 0 0 Ewing: Single Family 262 15 17.5 40 25 73 28 11 8 19 East Windsor: All Styles 247 15 16.5 42 27 64 26% 13 5 12 East Windsor: Condo/ THouses 146 8 18.3 26 18 32 22% 8 4 7 East Windsor: 55+ 13 2 6.5 1 -1 -- -- 0 0 2 East Windsor: Single Family 88 5 17.6 15 10 32 36% 5 1 3
- 4. 6/13/11 Towns Active Listings Pending in Last 30 Days Absorption Rate in Months New Listings in 30 Days Net Gain (Loss) to Market Listings Reduced in 30 Days % of Invent. Reduced Expired Listings W/drawn Listings Closed Listings Hopewell Twp. All Styles 195 11 18 34 23 55 28% 4 10 7 Hopewell Twp. Condo/ T.Houses 15 3 5 4 1 10 66% 1 0 3 Hopewell Twp.: 55+ 11 0 11 2 2 -- -- 0 0 1 Hopewell Twp Single Family 169 8 21 28 20 45 27% 3 10 3 Hamilton: All Styles 688 35 20 123 88 200 29% 21 13 52 Hamilton: Condo/ THouses 117 9 13 14 5 38 32% 5 5 8 Hamilton: 55+ 46 0 46 11 11 -- -- 0 0 4 Hamilton: Single Family 525 26 20 98 72 162 30% 16 8 40
- 5. 6/13/11 Towns Active Listings Pending in Last 30 Days Absorption Rate in Months New Listings in 30 Days Net Gain (Loss) to Market Listings Reduced in 30 Days % of Invent. Reduced Expired Listings W/drawn Listings Closed Listings Robbinsville All Styles 174 16 11 30 14 61 35% 11 5 9 Robbinsville Condo/ T.Houses 75 10 7.5 10 0 28 37% 6 3 5 Single Family 99 6 16.5 20 14 33 33%` 5 2 4 Hightstown Boro: All Styles 84 3 28 14 11 33 39% 3 4 1 Pennington 22 2 11 5 3 8 36% 1 0 2 Hopewell Boro 18 0 9999 3 3 8 44% 1 1 0
- 6. 6/13/11 Towns Active Listings Pending in Last 30 Days Absorption Rate in Months New Listings in 30 Days Net Gain (Loss) to Market Listings Reduced in 30 Days % of Invent. Reduced Expired Listings W/drawn Listings Closed Listings Princeton Boro: All Styles 60 4 15 12 8 10 17% 2 5 7 Pton -Boro Condo/ Thouses 26 2 13 4 2 2 8% 0 2 5 Pton-Boro Single Family 34 2 17 8 6 8 24% 1 3 2 Pton Twp: All Styles 184 9 20.4 35 26 42 23% 2 11 20 Pton Twp: Condo/ Thouses 23 2 11.5 6 4 2 9% 0 2 4 Pton Twp: Single Family 161 7 23 29 22 40 29% 2 9 16
- 7. 6/13/11 Towns Active Listings Pending in Last 30 Days Absorption Rate in Months New Listings in 30 Days Net Gain (Loss) to Market Listings Reduced in 30 Days % of Invent. Reduced Expired Listings W/drawn Listings Closed Listings South Brunswick All Styles 326 19 17 66 47 81 25 25 2 25 South BrunswickCondo/ T.Houses 98 7 14 24 17 25 26 10 1 11 South Brunswick 55+ 32 0 99 5 5 4 13 5 0 1 South Brunswick Single Family 196 12 16 37 25 52 27 10 1 13 Monroe: All Styles 578 32 18 133 101 120 21 41 8 64 Monroe: 55+ 351 21 17 91 70 68 19 25 4 47 Monroe: Single Family 227 11 21 42 31 52 23 16 4 17
- 8. 6/13/11 Towns Active Listings Pending in Last 30 Days Absorption Rate in Months New Listings in 30 Days Net Gain (Loss) to Market Listings Reduced in 30 Days % of Invent. Reduced Expired Listings W/drawn Listings Closed Listings Montgomery All Styles 186 28 6.6 43 15 62 33% 8 8 20 Montgomery Condo/Twnhms 31 3 10.3 6 3 7 22% 1 1 6 Single Family 155 25 6.2 37 12 55 36% 7 7 14 Hillsborough All Styles 297 40 7.4 61 21 91 31% 21 20 31 Hillsborough Condo/Twnhms 110 11 10 24 13 39 35% 3 11 13 Hillsborough Single Family 187 29 6.4 37 8 52 28% 18 9 18
Notes de l'éditeur
- Populate this table to show the local absorption rate in the various price ranges that are appropriate for your market area. Please add or delete rows as necessary to adequately reflect local conditions.
- Populate this table to show the local absorption rate in the various price ranges that are appropriate for your market area. Please add or delete rows as necessary to adequately reflect local conditions.
- Populate this table to show the local absorption rate in the various price ranges that are appropriate for your market area. Please add or delete rows as necessary to adequately reflect local conditions.
- Populate this table to show the local absorption rate in the various price ranges that are appropriate for your market area. Please add or delete rows as necessary to adequately reflect local conditions.
- Populate this table to show the local absorption rate in the various price ranges that are appropriate for your market area. Please add or delete rows as necessary to adequately reflect local conditions.
- Populate this table to show the local absorption rate in the various price ranges that are appropriate for your market area. Please add or delete rows as necessary to adequately reflect local conditions.
- Populate this table to show the local absorption rate in the various price ranges that are appropriate for your market area. Please add or delete rows as necessary to adequately reflect local conditions.
- Populate this table to show the local absorption rate in the various price ranges that are appropriate for your market area. Please add or delete rows as necessary to adequately reflect local conditions.