1. Proc. Aust. Poult. Sci. Sym. 1998...10
EVALUATING A BROILER GROWTH MODEL C.
FISHER1 and R.M. GOUS2 Summary
Simulation models of broiler growth are useful both as scientific and commercial tools. The
needs of these two areas can only be reconciled if the model is a 'glass' box, with the contents of the
model being transparent and available to the user. Models are only representations of reality and some
evaluation has to be done each time the model is used.
Evaluation can usefully be carried out in the following steps: 1. Consider the bounds of the
model; 2. Evaluate the theoretical structure of the model; 3. Test the model against existing experimental
data; 4. Evaluate the predictions of the model in practical applications.
Various aspects of evaluating the EFG Broiler Growth Model (EFG Software, Natal, S.A.) are
presented in this paper.
I. INTRODUCTION
Proving the commercial value of predictive models used in broiler production is obviously
essential; the more so if the model is itself a commercial product. Model evaluation is a multi-step
process involving not only those who develop (and sell) the model but also its users. Critically, the
process of evaluation will depend on the type of model under consideration.
The model discussed here (the EFG Broiler Growth Model) implements a theory of growth and
feed intake in broilers outlined by Emmans and Fisher (1986) and developed further by its main author
G.C. Emmans (1987, 1995). The principal features of the model are as follows: Firstly; potential growth,
a genetically determined characteristic, is defined by three growth and one feathering parameter. A
Gompertz curve relating the potential for feather-free body protein growth to post-hatching time is the
central feature. Potential body fatness is also seen as being under genetic control. Secondly; by assuming
that birds have a purpose - to achieve their potential growth of body protein - a general theory of ad
libitum feed intake can be elaborated (Emmans, 1997). Thirdly; by analysing how the environment, both
physical and nutritional, will prevent a bird achieving its potential, actual performance under defined
conditions can be computed. Fourthly; nutritional transactions (energy and amino acids only) are
considered in conventional ways except that food energy is computed as 'effective' energy (Emmans,
1994) and not in the more limited way as ME. Fifthly; by using these principles the model simulates the
growth of body and feather protein, fat, water and ash over successive intervals of time with daily
summary of outputs. At each stage the composition of the body is computed using equations based on
allometry with body protein weight. Biological and economic indexes of performance allow the results
to be assessed. Evaluating a theory-based model of this sort raises a dichotomy. On the one hand there is
a scientific need to prove the model 'wrong' so that it can be improved. Conversely there is a need to
prove the model 'right' so that it may be used. This contradiction may be resolved by seeing the model as
a 'glass' box, rather than the usual 'black' box, so that users of the model can share fully the understanding
of what it does and what it does not do. If models are to develop in both a scientific and commercial
sense then such openness seems to be essential.
1
EFG Software (Natal), Leyden Old House, Kirknewton, Midlothian, EH27 8DQ, U.K.
2
Dept of Animal and Poultry Science, University of Natal, Pietermaritzburg, South Africa.
1
2. Proc. Aust. Poult. Sci. Sym. 1998...10
H. MODEL EVALUATION
(a) Model bounds
Consideration of what the model includes and excludes is a useful first step in evaluation.
Factors included are the genotype of the bird, including feathering; flock characteristics such as stocking
density, mortality, distribution of mortality in time, and economic parameters; environmental variables
temperature and humidity; diet composition in terms of energy and amino acids and the use of controlled
feeding. Feed form, mash versus pellets, is partly implemented. Important factors that are not considered
at this stage of development include: response to temperature stress, diurnal variations in temperature
and lighting. With a theory based model desiderata for inclusion of a factor include not only its
importance but also the availability of a proper theoretical treatment that is compatible with the rest of
the model.
(b) Validating the theory
Evaluating and testing the theory that a model uses, independently of evaluating the overall
model, is an essential process. Only in this way can the model be continuously improved. Models which
become so complex that the component hypotheses cannot be independently tested may cease to be
useful from a scientific point of view.
Potential feather-free body protein growth - a Gompertz curve: the assumed Gompertz curve,
relating body protein, Bp, to time, is the central element of the growth theory of Emmans (1987, 1995).
The curve defines two of the four genetic parameters in the model and through derived allometric
relationships determines other body components. The assumption that a bird seeks to achieve its
potential allows ad libitum feed intake to be simulated.
The essential assumption is that potential growth in Bp follows a smooth, continuous path which
can be described empirically by a growth curve. The Gompertz curve is chosen because it represents the
available data better than alternative curves, because of its mathematical properties leading to derived
allometric relationships for all body components and because its parameters, although largely empirical,
can be visualised and estimated experimentally. A frequent error in growth modelling is to apply such
curves to observed growth data without applying the caveat that environmental conditions must be
non-limiting. Under limiting conditions there is no inherent reason why growth should be continuous or
smooth with respect to time, nor follow any single empirical curve. Hruby et al. (1996) describe protein
growth of modern broiler strains under putative non-limiting conditions created by choice-feeding. They
found that the Gompertz curve described their data very effectively and was statistically superior to the
other forms examined (logistic and polynomial). The parameters of the Gompertz curve can be estimated
from suitable data sets on immature birds (see Hancock et al., 1995 for an example).
The definition of energy transactions in terms of 'effective energy' (Emmans, 1994) gives the
model an important source of strength. In comparison with ME, effective energy (EE) takes account of
diet composition (crude fibre, fat, digestibility) on energy utilisation. Few data sets are available to test
the calculation of feed intake using the ideas of the effective energy system. Hakansson et al. (1978)
present one set for broilers (see Emmans, 1994) which gives strong support to the theory. However use
of these data to test the model is only partly justified since they were used by Emmans to quantify one of
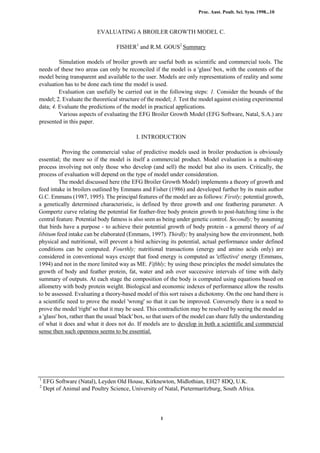
the parameters used in the prediction system. The turkey data in Figure 1 (Fisher and Emmans, 1992)
provide a valid test of the system.
2
3. Proc. Aust. Poult. Sci. Sym. 1998... 10
Figure 1. Actual feed intake and intake predicted
using the effective energy scale in growing
turkeys. The data points refer to successive Figure 2. Changes in carcass lipid in broilers given
periods of growth in male birds grown on a different crude protein levels (Gous e t a l ,
conventional high-energy feed (Fisher and 1992).
Emmans, 1992)
The idea that birds strive to achieve their potential is best examined by looking at changes in
fatness following a change in diet composition. Gous (1995) described an experiment to test this aspect
of the model at this meeting. A single result is shown in Figure 2. Birds were made fat or lean at 1kg by
feeding low and high protein levels. A range of protein levels was then given to each group during a
recovery period. It can be seen that the lipid content of the fat birds did not change greatly after 1kg,
implying a much lower lipid content in the growth. The lean birds however showed increasing fat
content. The fatness of both groups reflected the protein content given during re-alimentation but by 2kg
both groups had the same lipid content when given a sufficient level of protein. These data are consistent
with the theory used in the model that birds will strive to achieve an inherent body composition
determined by their genotype.
(c) Validating the model: comparison with experiments
Comparison of model predictions with the results of experiments provides the most readily
available method of evaluating a model. Logically all possible experiments of a given type should be
tested but this is time consuming work and such an ideal has not been achieved. The examples presented
here were selected because they were good experiments and described in the literature in sufficient
detail. In preparing this paper no experiments have been rejected because they failed to show the model
in a good light.
This type of comparison raises many complex issues and is subject to many difficulties both
theoretical and practical. The main difficulties are: Firstly; the available description of the experiment
will not contain all the information required by the model. Estimates must be used. Secondly; the
observed performance may, unknowingly, be influenced by factors which lie outside the bounds of the
model. In these circumstances calibration of model output simply to make them look like the
experimental results is not justifiable. Thirdly; the performance of the birds may not, in fact, wholly
reflect the variables that the experimenter thought were under control. This is probably a common
feature of nutrition experiments. A special case is that factors that are held constant, especially the
environment, may interact with the treatments being used; such interactions are not revealed by the
experiment but may influence model calculations.
3
4. Proc. Aust. Poult. Sci. Sym. 1998... 10
Such points are discussed below in the context of individual experiments. Comparison of the
results of a lysine response study with model predictions is shown in two ways in Figure 3. In Figure 3A
predicted performance across treatments is correlated with the experimental results. This type of
comparison is widely used in modelling, especially when the variation in the real-world results is not
subject to experimental control. The interpretation of such a comparison rests on the magnitude of the
correlation and the goodness-of-fit to the line x = y. Both these may be examined formally but the
statistical testing of such hypotheses is the subject of considerable controversy (Thornton and Hansen,
1996; Colson et al, 1995). This will not be discussed here.
A less formal test is to compare the response to the experimental variables as observed and as
predicted by the model, (see Figures 3B,C,D). This is more useful for the present purpose and this type
of graph is mostly used in this paper. At this stage formal statistical comparisons have not been made
although these could be devised, for example by comparing residual standard deviations.
(d) Amino acid response studies
Han and Baker (1993) describe responses to lysine level in broilers from days 22 to 43. The
experimental results and their reproduction using the model are shown in Figure 3. For gain-over-food
(FCE) there is a very close correlation between the observed and model results in both males and
females (Figure 3A). The responses in FCE are also quite well reproduced, especially in males (Figure
3B). These results test those components of the model concerned with nutrient utilisation; these are
generally strong. A more severe test is to look at the components of FCE separately as this requires that
responses over time and ad libitum food intake are simulated.
In males the simulation of the growth response is quite successful (Figure 3C). Simulated birds
are slightly larger at low lysine levels and, more significantly, show declining body weight at lysine
levels above 0.8%. The pattern of food intake response described by the model is considerably different
from the experiment, with higher intakes at low lysine levels and a much steeper decline at higher levels.
In females there is a similar pattern of results but overall the comparison is less good than in the males
(Figure 3D).
This experiment thus shows a reasonable agreement between the model and the experiment, but
more importantly, it reveals the serious limitations of this type of test and also, what can be learned about
nutrition experiments by using a model. In simple terms, the theory of the model envisages that the bird
attempts to eat enough food to meet its lysine requirement. Thus at low lysine levels food intake will
increase and the birds will be fatter. The model tries to analyse what factors prevent the bird eating
enough food to reach its potential and, in general and in this case, the ability to lose heat will normally be
the limiting factor. Han and Baker (1993) do not describe the environmental temperature used in this
experiment. But the birds were kept in cages in a temperature controlled building and for the model
exercise described here it was assumed that the effective temperature experienced by the birds was
constant at 21°C. This assumption is quite critical but fine-tuning is not really worthwhile since the
effective temperature experienced by a bird on deficient feed may be different from that on an adequate
feed. The deficient bird will certainly be 'colder' and may well modify its behaviour, and thus the
effective temperature, as a result. Such issues will profoundly affect the results obtained in an
experiment, but they are usually ignored. It is difficult to see how they can be taken into account in an
exercise of the kind being discussed here.
4
5. Proc. Aust. Poult. Sci. Sym. 1998... 10
1.7 0.8
Lysine
Figure 3 Responses to lysine in broilers aged 22-43d. Data from Han and Baker (1994). For simulation
the model was calibrated to give similar growth rates in males at the lysine level which was
just adequate. Birds were kept in cages and the room temperature was set at 21°C. Diets as
described by the authors with some additional calculation. A. Correlation of observed and
predicted FCE. B. Responses in FCE. C. Gain and food intake, males. D. Gain and food
intake, females.
At the higher levels of lysine, where commercial decisions are likely to be made, this
temperature effect will probably be quite small. However at these higher levels the model predicts
reductions in food intake, and fatness, as lysine increases. As fatness reduces, the birds tend to become a
bit smaller since maximum gain of other body components has already been reached (Figures 3C and
3D). These effects were not seen in the experimental data. Some approximate calculation of the response
in terms of the fat-free body show that differences in fatness account entirely for the lack of agreement
between the model and the experiment in this area of the response (these data are not shown here). The
most likely explanation is that the experimental feeds became limiting in some other nutrient and the
birds continued to eat for this in spite of having sufficient lysine. Such a nutrient may be another amino
acid or a mineral or vitamin. The use of the model encourages the consideration of such possibilities and
the improved design of experimental feeds.
5
6. Proc. Aust. Poult. Sci. Sym. 1998...10
(e) Responses to environmental temperature
The response of broilers to variations in environmental temperature presents the most severe
challenge to modellers. Apart from cold-thermogenesis, which can probably be ignored in practice, heat
is produced as a result of maintenance and activity, protein and lipid growth, digestion and nitrogen
excretion (Emmans, 1994). Heat loss to the environment at a given effective temperature will reflect
feathering, posture, blood flow, panting and so on. Effective temperature will be determined by factors
such as radiant input, conductive losses, humidity, air movement and diurnal variations.
The integration of this complexity into a single model has made quite a lot of progress (e.g. Bruce
and Clark, 1979) and is more widely applied in pig models (Moughan, et al, 1995) than in current broiler
models. However whilst the modelling is feasible it has not been demonstrated that the considerable
increase in complexity will lead to improved commercial predictions. Specifically the management of
broilers at high temperatures, in excess of about 31°C, may be too complex to benefit directly from
modelling.
The EFG Broiler Growth Model has a simple set of rules about the effect of temperature. A single
effective temperature (and humidity) is provided as input for each day. Heat loss calculations take account
of humidity, feathering, stocking density and are scaled for a given genotype and degree of maturity. Heat
production calculations are based on the effective energy scheme (Emmans, 1994) and take account of a
wide variety of factors. Specifically the model does not contain concepts of either physiological or
behavioural adaptation by the bird to temperature and thus it is not a high temperature model. Limitation
of heat loss is the most common factor determining food intake so the model reflects very sensitively the
various inputs. Even with a simple set of rules model behaviour is often very complex in this area.
Simulation of a temperature experiment is illustrated in Figure 4. Charles et al. (1981) studied
post-brooding temperatures in the range 15-27°C and also used four dietary nutrient density levels and
broilers of both sexes. The scatter diagram in Figure 4a shows that the overall correlation between
observed and simulated responses was reasonably close. The overall pattern of response in FCE (Figure
4b) is also well reproduced by the model, given the complexity of this experiment. Separate consideration
of growth and feed intake (data not shown) reveals that the response of both components to temperature is
well predicted. However the response to diet composition is less successfully simulated.
F CE Ex peri ment al
O bserv at i ons
Figure 4. Effect of temperature and diet nutrient density on broiler performance. Data from Charles
et al (1981); mixed sex broilers reared in environmental chambers to 49 days. The model
was not calibrated to the data set.
6
7. Proc. Aust. Poult. Sci. Sym. 1998...10
The model predicted that the four feeds used would support rather similar growth rates with
wide variations in feed intake. The birds themselves responded by keeping intake fairly constant across
feeds but showing wide differences in growth. The possible reasons for this difference between the
experiment and the model are legion and speculation is not really rewarding. However it should be noted
that the predicted model response is consistent with most nutritional experiments of this sort (Fisher and
Wilson, 1974) whilst this experiment showed an unusual pattern of response.
(f) Responses to dietary energy and nutrient density
Leeson et al. (1996a) describe two experiments in which dietary energy (Exp. 1) and both
energy and protein (Exp. 2) were diluted with a mixture of sand and oat hulls. Extensive dilution, up to
50%, was used, so this experiment provides a good test for a simulation model. Comparison of
experimental and model results is shown in Figure 5. In general there is good agreement between the
two. Food intake tended to be overestimated by the model; this may have reflected factors such as
temperature, feeding space or an overestimate of the feeding value of oat hulls or an underestimate of the
moisture content of the sand. None of these factors was defined in the paper describing the experiment.
The model predicted much larger responses in body fatness than were indicated by the data reported for
abdominal fat pad weight (data not shown).
Figure 5. Effect of diet dilution on broiler performance (Leeson et al, 1996a). Diet
compositions were recalculated to provide the information required by the model. The
model was not calibrated to the data set. Left-hand figure; Exp.l in which energy was
diluted. Right-hand figure; Exp 2 in which both energy and protein were diluted.
A more classical energy-protein experiment was described by Pesti and Fletcher (1983). This
provides a useful test because it involves an old genotype and thus illustrates the capacity of the model to
deal with genetic change. Also a very narrow range of response was reported so the test is a precise one.
The experimental and model predictions for FCE and body fatness are shown in Figure 6. For FCE the
agreement is very close both in pattern and amplitude of response. For fatness there is less close
agreement although part of the pattern is reproduced. In general the model sees adjustment of body
fatness as a larger component of
7
8. Proc. Aust. Poult. Sci. Sym. 1998...10
response than the birds revealed. There are many possible reasons for this: temperature is not well
defined and some features of diet design may also have influenced the actual experimental results.
The correlation of experimental and model results for the FCE data shown in Figure 6 was
0.904, being highly significant. For growth and feed intake considered separately the correlations were
negligible. This again emphasises that the prediction of the rates of growth processes over time is much
more difficult than predicting nutrient utilisation.
Figure 6. Response to energy and protein in broilers. Data from Pesti and Fletcher (1983). The
model was adjusted to a 1970's genotype (see Oldham et al. 1997) and diet
compositions were re-calculated.
(g) Controlled feeding
Controlled or restricted feeding is becoming a common feature in the broiler industry in Europe
and user control of intake is a necessary feature of the model. Since the prediction of the rate of intake
over time is the most challenging problem tackled in the model it is to be expected that removal of this
element will increase considerably the accuracy with which the model reflects the real world.
Leeson et al. (1996b) report experiments in which four dietary energy levels were fed either ad
libitum or according to a controlled intake pattern. The effect of feed restriction on growth and feed
intake is well represented by the model and Figure 7b suggests that the low feed intake (and hence high
conversion) observed at the highest energy level when fed ad libitum might be an artefact. In all cases
the response to energy is also well simulated. The overall effects of the treatments on feed conversion
(Figure 7c) are very small and the small differences between the model and the experiment probably
reflect only such issues as temperatures and feathering. The reduction in fatness with declining energy
content was overestimated somewhat in the ad libitum fed birds with almost exact agreement under
controlled feeding (Figure 7d). This emphasises that the difficult prediction is of feed intake over time
and all the factors which affect it, whilst the close agreement under controlled feeding suggests that the
rules for nutrient intake and the resultant partitioning are about correct.
8
9. Proc. Aust. Poult. Sci. Sym. 1998...10
(h) Using the model
This section on model use is included under the heading 'Model Evaluation' to stress the
importance of continuing evaluation by the model user and of the scientific transparency of the model.
Experience has shown many applications of the EFG Broiler Growth Model. These range from it
being used as a starting point in the development of 'in-house' models by large companies to a wide range
of direct applications in broiler nutrition and production decision making. The most common use is
alongside R & D programmes where a question is simultaneously addressed by the model and by an
experiment. Such application is analogous to the retrospective analyses presented above and offers the
following advantages over reliance on experiments alone. Firstly; there is much greater understanding
about the interactions between the three components involved - genotype, feed and environment. These
are all inevitably involved in the outcome of an experiment. Secondly; treatment options can be
evaluated before the experiment starts, giving a better choice of treatments. Thirdly; probable underlying
biological changes e.g. in body composition, can be followed in detail. Fourthly; assessment of a wider
range of biological outcomes can easily be made, and fifthly; economic assessment of the results under
different scenarios can be easily done.
For some types of decision the use of experiments may be either impossible or too constrained.
The use of a model then has additional value. Some examples from recent experience illustrate this. 1. A
broiler production company normally slaughtered large male birds at 55 days. With some frequency
market conditions dictated a delay in slaughtering of 7-10 days. How should the birds be fed during such
a 'holding' period? Use of the model allowed a wide range of options to be tested. 2. A broiler company
with no R & D facilities was able to re-direct policy on amino acid levels with great benefits. 3.
Experiments on feeding programmes, i.e. the sequence and timing of feeds, are difficult simply because
so many options are available and because interactions with other factors are likely to be important. An
example of using the model is shown below. 4. Restricted or controlled feeding experiments are also
very complex owing to the almost unbounded range of options concerning timing and degree of
restriction. Unravelling this complexity with a model has had great commercial benefit.
Saleh et al. (1997) report a typical 'feeding programme' experiment. Starter feed was given for
7, 14 or 21 days and a finisher feed from 21, 28 35 or 42 days to broilers killed at 56 days. All 4x3=12
options were tested. The biological effects of the treatments were very small and reproduction of this
experiment in the model is complex and not very easy. However the correlation result in Figure 8a
suggests reasonable agreement between the experimental and model results. Figure 8b shows body lipid
growth on the two treatments which gave the fattest (starter 0-14, finisher 21-56 days) and the leanest
birds (starter 0-21; finisher 42-56 days). This additional information about the changes taking place
during the experiment clearly enhances its value considerably. Economic calculation within the model
allows the results to be assessed under different scenarios and for the assessment of the results to be
made at different ages.
ni. DISCUSSION
It seems to be important to develop modelling in the scientific community if progress is to be
made. For this purpose models will have to be open. It is suggested here that developers of commercial
models can both benefit, and make a more useful contribution to the poultry industry, if they take a
similar approach.
9
10. Proc. Aust. Poult. Sci. Sym. 1998... 10
It is not possible here to discuss the many areas where further development of both theory and
modelling technique is required, nor to list the approaches which have been or might be useful.
Undoubtedly a central problem in simulation modelling is the need to consider populations of birds
rather than a single 'average' bird. The structure of the EFG Broiler Growth Model facilitates this in the
way that genotypes are described (see Emmans and Fisher, 1986) and some examples are given by Gous
(1997, in press). Similar issues in pig modelling have been discussed by Ferguson et al. (1997).
Figure 7. Restricted feeding and dietary energy level in broilers. Data from Leeson et al. (1996b).
Model predictions made without calibration.
It is clear that different parts of any model will have different strengths. In the type of model
discussed here the description of nutrient utilisation and growth, once intake is known, is relatively
strong or 'hard'. The prediction of food intake over time is much more difficult and presents more
challenging problems.
Systems of broiler production are being developed in which real-time data on bird growth and
feed intake are continuously available in addition to control of inputs. The creation of models to use such
data and to provide sophisticated methods of optimising production in such systems should be a much
simpler task than the one discussed here.
REFERENCES
Bruce, J.M. and Clark, J.J. (1979) Animal Production, 28: 285-369. Charles, D.R., Groom, CM. and
Bray, T.S.. (1981) British Poultry Science, 22: 475-481. Colson, J., Wallach, D., Bouniols, A., Denis,
J-P. and Jones, J.W. (1995) Agronomy Journal, 87: 397-402.
Emmans, G.C. and Fisher, C. (1986). In: Nutrient Requirements of Poultry and Nutritional
Research. (Eds. C. Fisher and K. N. Boorman), London: Butterworths, pp. 9-39. Emmans,
G.C. (1987) World's Poultry Science Journal, 43: 208-227. Emmans, G.C. (1995) World's Poultry
Science Journal, 51: 77-89.
10
11. Proc. Aust. Poult. Sci. Sym. 1998... 10
Emmans, G.C. (1994) British Journal of Nutrition, 71: 801-821
Emmans G.C. (1997) Journal of Theoretical Biology, 186: 189-199.
Ferguson, N.S., Gous, R.M. and Emmans, G.C. (1997) Animal Science, 64: 513-522.
Fisher, C. and Wilson, B.J. (1974) In: Energy Requirements of Poultry. (Eds. T.R. Morris and
B.M. Freeman, Edinburgh: British Poultry Science Ltd, pp. 151-184. Fisher, C. and Emmans,
G.C. (1992) Poultry Science 71, Supplement 1: 150 (abstract). Gous, R.M. (1995) Proceedings of
Australian Poultry Science Symposium, (Ed. D. Balnave)
7: 45-52.
Gous, R.M. (1997) Poultry Science (in press).
Gous, R.M., Emmans, G.C. and Fisher, C. (1992) Poultry Science 71, Supplement 1: 152. Hakansson, J.,
Eriksson, V. and Svensson, S.A. (1978) Swedish University of Agricultural
Science, Dept of Animal Husbandry, Report No 59: 1-110. Han, Y.M.
and Baker, D.H. (1994) Poultry Science, 73: 1739-1745.
Hancock, C.E., Bradford, G.D., Emmans, G.C. and Gous, R.M. (1995) British Poultry Science, 36:
247-264.
Hruby, M., Hamre, M.L. and Coon, C. (1996) Journal of Applied Poultry Research, 5: 109-115.
Leeson, S., Caston, L. and Summers, J.D. (1996a) Poultry Science, 75: 522-528. Leeson, S., Caston, L.
and Summers, J.D. (1996b) Poultry Science, 75: 529-535. Moughan, P.J., Verstegen, M.W.A. and
Visser-Reyneveld, M.I. (Eds) (1995) Modelling
growth in the pig, Wageningen: Wageningen Pers. Oldham, J.D., Emmans, G.C. and Kyriazakis,
I. (1997) Proceedings of the Nutrition Society
56: 525-534.
Pesti, G.M. and Fletcher, D.L. (1983) British Poultry Science, 24: 91-99. Saleh, E.A., Watkins, S.E. and
Waldroup, P.W. (1997) Journal of Applied Poultry Research, 6: 290-297.
Thornton, P.K. and Hansen, J.W. (1996) Agricultural Systems, 50: 411-414.
Figure 8. A feeding programme experiment (Saleh et al, 1997). The left-hand figure shows the
correlation between experimental observations and model predictions for body-weight (•),
FCR (■), abdominal fat (A), closed symbols refer to time of feeding the starter feed, open
symbols time of feeding finisher feed. All data were scaled to a single treatment to
facilitate presentation of the different responses. The right-hand figure shows the
development of body lipid in model runs which emulate two of the treatments used.
11