All daily key levels for November 28, 2014
•
0 likes•3,588 views

My daily key levels for hundreds of stocks and ETF. Stay on the right side of the market and easily spot stocks that offer buy or sell opportunities today.

Recommended
More Related Content
Similar to All daily key levels for November 28, 2014
Similar to All daily key levels for November 28, 2014 (20)
More from LunaticTrader
Recently uploaded
Recently uploaded (20)
All daily key levels for November 28, 2014
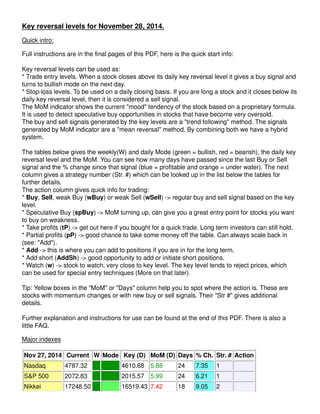
- 1. Key reversal levels for November 28, 2014. Quick intro: Full instructions are in the final pages of this PDF, here is the quick start info: Key reversal levels can be used as: * Trade entry levels. When a stock closes above its daily key reversal level it gives a buy signal and turns to bullish mode on the next day. * Stop-loss levels. To be used on a daily closing basis. If you are long a stock and it closes below its daily key reversal level, then it is considered a sell signal. The MoM indicator shows the current "mood" tendency of the stock based on a proprietary formula. It is used to detect speculative buy opportunities in stocks that have become very oversold. The buy and sell signals generated by the key levels are a "trend following" method. The signals generated by MoM indicator are a "mean reversal" method. By combining both we have a hybrid system. The tables below gives the weekly(W) and daily Mode (green = bullish, red = bearish), the daily key reversal level and the MoM. You can see how many days have passed since the last Buy or Sell signal and the % change since that signal (blue = profitable and orange = under water). The next column gives a strategy number (Str. #) which can be looked up in the list below the tables for further details. The action column gives quick info for trading: * Buy, Sell, weak Buy (wBuy) or weak Sell (wSell) -> regular buy and sell signal based on the key level. * Speculative Buy (spBuy) -> MoM turning up, can give you a great entry point for stocks you want to buy on weakness. * Take profits (tP) -> get out here if you bought for a quick trade. Long term investors can still hold. * Partial profits (pP) -> good chance to take some money off the table. Can always scale back in (see: "Add"). * Add -> this is where you can add to positions if you are in for the long term. * Add short (AddSh) -> good opportunity to add or initiate short positions. * Watch (w) -> stock to watch, very close to key level. The key level tends to reject prices, which can be used for special entry techniques (More on that later). Tip: Yellow boxes in the "MoM" or "Days" column help you to spot where the action is. These are stocks with momentum changes or with new buy or sell signals. Their "Str #" gives additional details. Further explanation and instructions for use can be found at the end of this PDF. There is also a little FAQ. Major indexes Nov 27, 2014 Current W Mode Key (D) MoM (D) Days % Ch. Str. # Action Nasdaq 4787.32 4610.68 5.88 24 7.35 1 S&P 500 2072.83 2015.57 5.99 24 6.21 1 Nikkei 17248.50 16519.43 7.42 18 9.05 2
- 2. FTSE 100 6723.40 6585.92 4.99 19 2.70 2 DAX 9974.87 9327.45 8.59 19 7.19 1 Bonds (TLT) 121.53 119.07 3.43 13 1.63 5 Gold (spot) 1189.20 1181.03 2.42 4 -0.97 30 tP $EURUSD 1.2465 1.2586 -0.89 104 -8.30 16 Oil (CL) 73.69 79.46 -3.57 41 -19.34 12 Dow Jones Composite stocks Nov 26, 2014 Current W Mode Key (D) MoM (D) Days % Ch. Str. # Action AEP 56.66 56.24 -1.05 35 4.69 2 w AES 13.82 13.64 2.65 5 -0.29 30 tP ALK 56.20 52.09 2.45 27 19.86 29 AXP 91.45 89.42 0.80 23 6.33 1 BA 134.78 128.05 8.67 18 7.52 1 CAT 105.79 101.13 5.58 21 4.20 1 CHRW 73.40 71.36 2.33 30 11.01 17 Add CNP 24.27 24.65 -1.67 9 0.66 20 spBuy CNW 48.40 46.25 5.55 14 5.22 1 CSCO 27.42 25.24 9.57 21 14.20 1 CSX 37.91 35.54 7.53 31 22.25 1 CVX 115.11 117.62 -0.33 0 0.00 39 Sell D 72.53 71.80 0.47 26 3.84 18 tP DAL 44.24 41.79 3.26 26 17.54 2 DD 71.47 70.19 4.19 18 3.36 2 DIS 91.92 89.10 0.88 26 4.53 1 DUK 79.69 80.45 -2.66 9 1.45 24 spBuy ED 62.33 61.49 -1.72 37 9.24 17 Add EIX 62.61 60.97 0.81 35 7.84 17 Add EXC 35.69 36.37 -2.70 10 -1.19 7 w EXPD 45.19 42.67 5.14 26 10.49 1 FDX 175.08 168.62 4.76 26 8.92 1 FE 36.44 36.14 -0.37 6 -0.14 2 w GE 26.87 26.19 5.54 26 6.00 2 GMT 65.45 62.99 1.63 24 7.52 17 Add GS 188.52 187.60 -0.05 23 3.10 2 w
- 3. HD 97.70 96.00 0.53 4 -1.29 6 w IBM 161.95 166.34 -2.61 44 -14.28 12 INTC 36.90 34.19 7.94 21 9.30 1 JBHT 81.82 79.25 2.71 29 8.75 1 JBLU 13.60 12.52 5.53 29 19.82 1 JNJ 107.21 106.20 -0.52 23 4.01 2 w JPM 60.34 59.79 -0.04 23 3.23 2 w KEX 102.47 106.06 -2.56 19 -6.72 12 KO 44.29 42.88 8.00 15 4.31 18 pP KSU 125.30 122.12 1.74 26 4.47 1 LSTR 78.91 75.53 4.17 28 10.58 1 LUV 39.28 37.06 2.69 27 16.63 2 MATX 34.24 29.44 9.13 28 31.79 2 MCD 96.22 94.41 5.40 19 2.47 14 MMM 158.31 153.12 5.20 26 12.36 2 MRK 59.75 58.55 1.58 19 3.09 2 MSFT 47.75 48.24 -1.11 1 0.55 3 w NEE 103.20 100.89 1.35 27 8.39 2 NI 41.82 41.12 -0.93 0 0.00 33 Buy NKE 97.80 93.95 5.89 29 11.40 2 NSC 117.20 112.89 3.82 26 10.04 2 PCG 49.94 48.62 0.36 25 7.35 2 PEG 41.21 40.09 1.39 6 1.85 1 PFE 31.10 29.83 2.76 23 6.84 17 PG 88.88 87.41 0.80 27 5.37 17 Add R 93.98 89.78 3.30 21 7.63 1 SO 46.82 46.39 -0.52 40 6.46 2 w T 35.13 35.27 -0.43 2 1.44 3 w TRV 104.37 101.15 4.96 26 10.15 2 UAL 56.60 53.47 2.51 27 17.60 2 UNH 98.11 93.91 4.71 28 11.19 17 UNP 123.31 117.72 5.34 28 16.77 13 UPS 106.98 105.24 0.76 27 8.18 2 UTX 110.16 106.64 4.60 21 3.22 13 V 257.26 239.84 7.47 26 20.62 1 VZ 50.04 50.49 -2.46 2 1.42 3 w
- 4. WMB 54.85 54.13 0.73 26 -0.18 18 tP WMT 84.98 81.39 9.29 16 9.13 2 XOM 94.48 95.83 0.17 0 0.00 39 Sell Nasdaq 100 stocks Nov 26, 2014 Current W Mode Key (D) MoM (D) Days % Ch. Str. # Action AAPL 119.00 110.50 9.16 26 15.71 1 ADBE 72.98 69.67 1.98 23 9.19 1 ADI 54.56 49.39 6.52 20 15.37 1 ADP 84.86 82.50 2.94 26 13.19 2 ADSK 61.35 58.06 5.22 23 13.09 1 AKAM 64.21 60.39 6.82 19 5.31 1 ALTR 37.24 34.88 5.56 18 8.51 1 ALXN 194.72 187.26 0.95 26 11.21 1 AMAT 23.87 22.07 4.38 21 13.40 1 AMGN 164.72 155.72 3.45 26 14.54 17 AMZN 333.57 317.80 8.02 11 7.34 18 pP ATVI 21.82 20.28 4.84 4 1.77 13 AVGO 93.78 86.70 4.93 26 13.66 1 BBBY 72.58 69.45 7.73 26 11.78 18 pP BIDU 246.03 234.45 1.33 27 12.82 17 Add BIIB 304.92 315.64 -4.07 8 -0.03 12 BRCM 43.12 41.03 3.56 25 8.59 17 CA 30.86 29.24 6.93 26 12.02 1 CELG 112.61 104.13 4.17 26 17.82 1 CERN 63.70 62.49 0.95 26 7.49 2 CHKP 76.81 74.47 4.97 24 7.02 2 CHRW 73.40 71.36 2.33 30 11.01 17 Add CHTR 168.05 155.63 6.10 5 6.31 1 CMCSA 56.86 53.99 2.73 2 2.19 1 COST 139.75 136.29 5.00 27 8.38 2 CSCO 27.42 25.24 9.57 21 14.20 1 CTRX 50.36 47.02 6.17 19 5.87 2 CTSH 53.63 50.09 5.03 23 19.10 2 CTXS 65.83 66.31 -0.49 6 1.18 12 w
- 5. DISCA 34.73 33.72 1.55 1 -0.23 9 w DISCK 33.86 34.14 1.04 18 -3.20 12 w DISH 78.24 66.88 10.00 18 23.49 1 DLTR 67.34 61.77 9.71 28 18.68 1 DTV 87.15 86.54 0.34 18 0.17 2 w EBAY 54.57 53.32 2.72 18 4.30 2 EQIX 226.46 217.55 4.87 19 7.51 2 ESRX 82.34 76.58 8.51 26 11.33 1 EXPD 45.19 42.67 5.14 26 10.49 1 EXPE 85.59 84.20 0.72 18 1.00 2 w FAST 45.24 44.06 2.97 21 4.36 13 FB 77.62 74.10 -0.40 1 2.77 5 FFIV 129.09 124.11 3.88 21 8.45 18 pP FISV 70.90 68.77 3.46 26 9.58 2 FOXA 36.32 34.64 4.05 15 4.10 1 GILD 100.30 105.30 -4.01 9 -3.09 8 GMCR 142.05 150.47 -6.31 4 -1.59 7 GOOG 540.37 545.70 -1.84 7 0.53 12 w GOOGL 547.73 555.51 -2.25 7 -0.04 12 w GRMN 57.07 55.45 5.55 30 11.42 2 HSIC 135.66 126.25 8.83 26 16.88 2 ILMN 191.90 182.85 1.18 6 1.63 1 INTC 36.90 34.19 7.94 21 9.30 1 INTU 92.24 88.20 6.23 24 9.69 18 pP ISRG 515.01 504.25 2.32 27 6.34 2 w KLAC 67.33 80.15 0.55 0 0.00 35 Sell KRFT 59.28 57.66 4.74 23 4.42 1 LBTYA 48.39 45.65 2.93 26 10.86 1 LLTC 45.55 42.67 4.13 18 6.67 13 LMCA 36.76 35.48 1.31 26 5.15 1 LMCK 36.61 35.07 1.62 26 5.74 0 LVNTA 36.35 34.45 2.86 18 3.68 18 tP MAR 77.48 73.44 2.91 26 11.63 2 MAT 30.88 30.86 0.38 4 -3.23 30 tP MDLZ 39.00 37.15 7.76 24 14.00 2 MNST 110.39 104.91 6.10 77 59.41 2
- 6. MSFT 47.75 48.24 -1.11 1 0.55 3 w MU 35.62 32.62 4.30 26 13.01 1 MXIM 29.68 28.69 -0.69 23 3.67 29 MYL 58.62 53.93 4.52 28 18.47 17 NFLX 351.16 381.29 -5.07 33 -22.18 11 NTAP 42.70 41.46 1.79 23 5.22 1 NVDA 20.92 19.40 5.42 26 14.38 1 NXPI 77.85 71.16 4.10 23 19.09 1 ORLY 180.32 174.12 2.65 27 15.37 2 PAYX 47.35 46.49 1.77 26 5.48 2 PCAR 67.36 64.34 4.36 26 13.23 1 PCLN 1166.83 1138.46 2.01 11 0.31 30 tP QCOM 72.26 72.79 -1.25 14 2.22 12 w QVCA 28.67 27.18 3.68 27 13.10 2 REGN 415.84 394.91 4.45 12 6.60 2 ROST 89.77 81.73 9.24 84 39.59 1 SBAC 120.42 113.86 6.51 26 9.44 1 SBUX 79.70 77.53 5.45 23 4.86 1 SIAL 136.53 134.73 2.52 47 0.29 1 SIRI 3.60 3.47 3.86 18 4.96 1 SNDK 104.26 95.16 8.27 18 11.40 1 SPLS 13.92 12.93 8.17 27 14.38 1 SRCL 128.10 125.28 2.02 28 8.72 1 STX 65.85 62.00 6.61 23 14.13 1 SYMC 25.93 24.90 3.87 26 9.69 1 TRIP 72.77 75.68 -3.15 56 -24.61 12 TSCO 75.69 72.30 5.11 26 22.83 18 pP TSLA 248.44 243.24 0.58 11 -0.51 2 w TXN 54.33 50.21 6.29 26 14.60 17 VIAB 75.23 72.35 5.23 8 3.06 13 VIP 5.77 6.27 -2.04 52 -31.88 16 VOD 35.65 34.14 7.27 23 12.21 2 VRSK 62.03 61.91 -1.66 23 0.36 2 w VRTX 115.39 110.66 0.01 26 5.51 5 WDC 103.67 97.84 5.69 21 11.47 1 WFM 48.36 44.61 8.55 26 27.43 2
- 7. WYNN 177.06 182.62 -1.52 15 -1.51 15 XLNX 45.49 43.30 3.08 28 11.03 1 YHOO 51.93 47.99 6.85 26 22.42 2 Popular ETF Nov 26, 2014 Current W Mode Key (D) MoM (D) Days % Ch. Str. # Action ACWI 60.80 59.21 5.73 21 3.49 1 AGQ 42.78 41.58 3.19 1 -0.51 13 w BIB 126.88 114.82 2.95 26 20.84 1 BIS 47.28 53.05 -2.88 27 -21.20 11 CEE 24.50 24.05 4.48 3 -1.05 13 CURE 128.61 117.04 4.64 26 26.47 1 DBC 21.40 22.08 -4.16 103 -19.03 16 DUST 23.78 32.09 -5.76 8 -22.19 24 spBuy DXJ 55.18 52.63 6.80 20 10.78 2 EDZ 31.85 34.50 -3.37 3 -1.06 11 EEM 42.35 41.36 3.00 3 0.33 13 EMB 114.44 113.51 2.83 3 0.34 5 EUO 20.27 20.07 1.11 95 16.16 22 tP EWA 24.15 24.71 -6.92 7 -1.87 15 EWD 33.87 32.57 6.06 24 5.09 13 EWG 28.90 27.19 8.69 18 6.96 13 EWH 22.02 21.43 2.16 3 0.92 17 EWI 14.98 14.56 4.27 3 0.27 13 EWJ 11.66 11.51 0.10 21 1.83 2 EWL 33.20 32.37 6.48 21 3.07 13 EWP 38.53 37.17 4.80 6 1.93 13 EWQ 26.45 25.53 6.55 6 2.36 13 EWS 13.48 13.28 3.22 13 0.67 13 EWT 15.84 15.55 2.81 4 0.06 1 EWU 19.36 18.92 3.75 18 2.65 13 EWW 66.58 66.38 -0.32 3 -0.83 9 w EWZ 43.25 41.20 3.20 3 0.02 9 EZA 70.59 68.32 5.54 11 3.82 18 pP EZU 38.92 37.28 7.69 6 2.83 13
- 8. FAS 122.13 113.31 4.54 24 21.50 1 FXE 123.22 123.97 -1.52 102 -8.11 32 spBuy FXI 40.93 39.11 2.01 3 1.94 1 FXY 82.71 85.84 -10.00 24 -8.19 12 GDX 20.10 19.18 4.51 6 -0.64 13 GDXJ 28.62 27.22 4.04 6 -2.55 9 w GLD 115.16 113.93 4.07 3 0.01 13 GLL 98.75 101.34 -4.69 6 -0.42 7 GREK 16.94 16.23 4.62 5 2.60 13 HYG 92.01 92.06 -1.59 16 -0.10 12 w IBB 303.87 288.57 2.97 27 11.47 1 IDX 25.42 24.87 3.32 7 0.47 14 IEF 105.78 104.84 3.15 13 0.59 5 ILF 36.80 35.54 3.67 3 -0.76 13 INDL 100.43 96.73 0.87 26 9.02 2 INDY 31.61 30.96 3.14 27 5.44 2 ITB 25.86 24.83 7.24 27 9.62 18 pP IWD 105.00 102.33 5.48 24 5.93 1 IWF 96.99 93.90 6.31 24 6.47 1 IWM 118.45 114.19 2.71 24 6.79 1 IYR 76.80 74.00 4.20 31 7.93 1 KEF 7.81 7.97 -3.86 17 -1.64 12 KRE 40.44 39.34 0.87 21 3.88 17 Add NUGT 16.01 17.25 2.65 68 -63.02 12 w OIH 41.87 44.96 -1.16 59 -21.64 31 QID 38.30 41.54 -5.68 26 -15.64 11 QLD 142.49 132.21 6.77 24 15.79 1 QQQ 105.52 101.54 6.47 24 7.72 1 ROBO 26.53 25.98 4.21 21 2.99 13 RSX 20.70 21.47 -0.15 17 -4.21 16 SCO 44.62 39.24 4.63 41 47.46 17 SDP 52.62 54.46 -0.46 38 -14.02 12 SDS 21.97 23.37 -5.68 26 -12.64 11 SH 21.74 22.41 -5.96 26 -6.50 11 SLV 15.87 15.59 3.62 1 -0.19 13 w SMH 55.18 51.63 7.40 23 12.75 1
- 9. SOCL 19.27 19.35 -1.37 6 0.73 20 spBuy SOXL 134.23 110.19 7.78 21 32.38 1 SPXL 89.78 82.54 6.75 24 19.90 1 SPXS 20.61 22.65 -5.47 26 -18.54 11 SPY 207.64 201.71 6.26 23 6.09 1 SSO 130.18 122.92 6.55 24 12.99 1 TBT 50.62 52.94 -3.69 44 -10.63 15 TECL 148.00 132.78 7.25 23 24.09 17 THD 84.38 82.25 4.37 21 2.14 1 TLT 121.53 119.07 3.43 13 1.63 5 TMF 76.73 72.24 3.59 44 15.73 5 TNA 79.08 71.40 2.70 21 10.57 1 TUR 56.90 53.25 8.32 10 6.36 1 TVIX 2.22 2.73 -2.26 26 -31.90 11 TZA 12.83 14.53 -2.74 26 -19.66 11 UBT 74.52 71.56 3.78 44 10.30 5 UCO 19.92 23.52 -4.90 41 -34.99 12 UDN 24.58 24.79 -4.22 95 -8.69 12 UGAZ 15.08 13.79 2.24 18 11.29 14 w UGL 39.63 38.88 4.07 3 -0.23 13 w UNG 22.11 21.26 3.26 18 5.29 2 UPW 98.89 96.09 -0.28 37 14.34 2 URE 104.10 96.91 4.45 31 16.21 1 USO 27.90 30.03 -4.63 41 -19.36 12 UUP 23.28 23.10 3.62 94 8.38 2 VGK 55.72 53.93 6.54 21 3.51 13 VNM 20.75 21.28 -2.13 48 -6.45 11 VNQ 80.37 77.14 3.39 31 7.89 1 VPL 59.31 59.57 -1.79 5 1.33 32 spBuy VWO 42.94 41.96 3.47 3 0.05 1 VXX 26.70 29.72 -2.88 26 -18.35 11 XLB 50.30 49.00 6.15 18 3.88 18 pP XLE 85.30 87.44 0.90 0 0.00 39 Sell XLF 24.38 23.80 3.68 23 5.91 1 XLI 57.39 55.09 6.81 26 8.30 1 XLK 42.29 40.71 6.53 23 8.08 17
- 10. XLP 48.68 47.46 6.21 27 7.87 2 XLU 45.52 44.84 -0.05 38 6.88 2 XLV 69.18 66.95 4.47 26 8.83 1 XLY 70.95 68.33 7.77 21 5.44 1 XOP 58.46 61.42 0.56 0 0.00 39 Sell YCS 86.64 80.85 10.00 24 18.10 1 YINN 33.66 29.66 1.43 3 5.19 1 S&P 500 stocks Nov 26, 2014 Current W Mode Key (D) MoM (D) Days % Ch. Str. # Action A 42.74 43.71 -1.59 46 -24.86 12 w AA 17.60 16.64 3.98 26 7.25 1 AAPL 119.00 110.50 9.16 26 15.71 1 ABBV 68.70 63.08 8.27 25 18.24 1 ABC 90.09 86.09 6.30 24 15.93 2 ABT 44.25 43.32 1.38 26 4.12 1 ACE 114.03 110.06 6.08 26 6.11 1 ACN 85.15 82.33 4.49 21 7.15 17 ACT 270.47 248.92 7.35 24 14.05 1 ADBE 72.98 69.67 1.98 23 9.19 1 ADI 54.56 49.39 6.52 20 15.37 1 ADM 53.18 50.36 8.20 16 6.40 2 ADP 84.86 82.50 2.94 26 13.19 2 ADS 284.37 277.43 1.60 29 11.13 18 tP ADSK 61.35 58.06 5.22 23 13.09 1 ADT 35.83 34.94 1.30 23 4.77 1 AEE 42.58 41.73 0.41 37 8.87 2 AEP 56.66 56.24 -1.05 35 4.69 2 w AES 13.82 13.64 2.65 5 -0.29 30 tP AET 86.91 82.84 5.36 20 9.02 2 AFL 59.68 58.84 2.10 23 2.30 13 AGN 214.00 198.70 8.08 69 31.45 2 AIG 54.61 53.31 3.07 21 3.29 18 pP AIV 37.36 35.47 4.98 35 13.45 17 AIZ 67.59 66.70 1.50 26 4.89 2 w
- 11. AKAM 64.21 60.39 6.82 19 5.31 1 ALL 67.52 65.42 6.94 26 8.90 2 ALLE 53.06 51.90 3.62 23 8.57 2 ALTR 37.24 34.88 5.56 18 8.51 1 ALXN 194.72 187.26 0.95 26 11.21 1 AMAT 23.87 22.07 4.38 21 13.40 1 AMD 2.84 2.87 0.57 56 -30.39 16 w AMG 203.17 196.21 3.55 21 2.64 13 AMGN 164.72 155.72 3.45 26 14.54 17 AMP 132.19 126.42 5.20 22 11.22 1 AMT 104.70 99.04 7.42 26 9.44 1 AMZN 333.57 317.80 8.02 11 7.34 18 pP AN 58.73 56.57 3.37 24 12.60 1 AON 91.80 87.88 7.01 21 9.42 18 pP APA 72.24 76.46 -1.06 59 -26.51 16 APC 88.46 92.93 -0.25 1 -0.55 31 APD 145.21 136.88 8.75 28 12.63 1 APH 52.98 50.59 5.41 19 5.24 1 ARG 117.47 113.98 5.10 18 5.08 18 pP ATI 35.08 33.13 5.49 3 -0.51 13 AVB 160.41 154.12 2.13 35 10.17 17 AVGO 93.78 86.70 4.93 26 13.66 1 AVP 9.71 10.43 -5.14 60 -29.59 12 AVY 49.19 46.67 5.19 23 7.50 1 AXP 91.45 89.42 0.80 23 6.33 1 AZO 568.55 553.95 3.05 26 7.81 2 BA 134.78 128.05 8.67 18 7.52 1 BAC 17.11 16.98 -0.66 21 2.03 22 tP BAX 72.40 71.27 3.78 15 1.97 14 BBBY 72.58 69.45 7.73 26 11.78 18 pP BBT 37.90 37.37 0.40 21 1.75 1 BBY 38.75 35.26 8.36 26 18.14 1 BCR 167.17 162.64 4.26 26 11.95 2 BDX 141.26 128.48 7.06 38 13.45 1 BEN 57.04 55.40 3.07 22 5.30 1 BF.B 95.11 92.06 3.43 23 7.05 1
- 12. BHI 62.58 57.78 8.80 9 1.03 2 BIIB 304.92 315.64 -4.07 8 -0.03 12 BK 40.21 38.76 4.78 20 6.60 2 BLK 357.61 339.78 5.55 23 10.59 1 BLL 66.29 64.54 0.63 1 0.79 5 BMS 39.74 38.93 2.55 13 1.38 13 BMY 58.86 56.02 3.73 26 13.17 2 BRCM 43.12 41.03 3.56 25 8.59 17 BRK-B 138.07 134.23 6.49 23 6.45 2 BSX 12.81 13.24 -2.68 4 -2.29 3 BWA 56.95 56.05 2.33 6 -0.42 30 tP BXP 129.22 125.13 2.74 35 9.05 1 C 54.13 53.00 2.25 23 5.15 1 CA 30.86 29.24 6.93 26 12.02 1 CAG 35.85 34.90 5.11 18 4.76 2 CAH 81.50 78.91 2.75 26 7.05 1 CAM 56.82 59.81 0.19 1 -2.29 31 CAT 105.79 101.13 5.58 21 4.20 1 CB 102.55 99.73 5.43 28 10.42 2 CBG 33.54 31.68 7.62 26 11.88 18 pP CBS 54.20 52.78 2.72 4 0.28 13 CCE 43.80 42.89 3.45 7 1.20 13 CCI 82.51 80.53 3.06 4 0.92 5 CCL 42.12 40.16 5.39 26 12.62 2 CELG 112.61 104.13 4.17 26 17.82 1 CERN 63.70 62.49 0.95 26 7.49 2 CF 271.64 264.29 4.49 11 2.43 2 w CFN 59.22 57.33 5.43 38 3.33 1 CHK 23.04 22.57 2.74 18 2.67 30 tP CHRW 73.40 71.36 2.33 30 11.01 17 Add CI 102.01 99.48 2.95 26 9.76 2 CINF 50.88 50.16 0.83 26 5.43 2 CL 68.69 67.29 1.77 26 5.02 17 Add CLX 99.90 100.46 -1.23 2 0.56 3 w CMA 48.55 47.58 1.03 18 2.06 29 CMCSA 56.86 53.99 2.73 2 2.19 1
- 13. CME 83.69 84.48 -2.20 3 0.16 7 w CMG 660.21 648.45 1.45 13 1.90 2 CMI 148.92 143.01 3.19 24 9.23 1 CMS 32.70 31.91 0.84 38 8.60 17 Add CNP 24.27 24.65 -1.67 9 0.66 20 spBuy CNX 40.08 38.71 4.65 20 11.64 2 COF 82.75 81.04 0.53 2 0.79 1 COG 33.42 32.83 3.57 15 6.06 2 w COH 36.66 35.04 7.55 10 4.27 13 COL 85.09 82.18 3.18 26 8.49 1 COP 70.83 72.49 2.11 0 0.00 39 Sell COST 139.75 136.29 5.00 27 8.38 2 COV 100.54 94.71 8.18 20 9.63 1 CPB 44.45 43.80 2.58 26 3.37 18 tP CRM 59.23 61.86 -5.76 5 0.02 3 CSC 63.29 60.94 5.52 26 7.73 18 pP CSCO 27.42 25.24 9.57 21 14.20 1 CSX 37.91 35.54 7.53 31 22.25 1 CTAS 73.03 71.29 2.73 81 14.81 5 CTL 40.57 40.81 -0.74 1 1.94 7 w CTSH 53.63 50.09 5.03 23 19.10 2 CTXS 65.83 66.31 -0.49 6 1.18 12 w CVC 20.20 18.58 6.41 26 10.08 1 CVS 90.89 87.92 4.58 27 11.17 2 CVX 115.11 117.62 -0.33 0 0.00 39 Sell D 72.53 71.80 0.47 26 3.84 18 tP DAL 44.24 41.79 3.26 26 17.54 2 DD 71.47 70.19 4.19 18 3.36 2 DE 86.99 85.56 0.27 3 -0.53 18 tP DFS 64.97 64.23 -0.20 18 1.60 1 w DG 65.91 64.28 4.53 27 6.65 2 DGX 64.43 62.49 3.16 14 3.37 18 pP DHI 25.36 23.94 8.18 28 17.84 18 pP DHR 83.45 80.01 6.61 26 9.17 2 DIS 91.92 89.10 0.88 26 4.53 1 DISCA 34.73 33.72 1.55 1 -0.23 9 w
- 14. DISCK 33.86 34.14 1.04 18 -3.20 12 w DLPH 71.78 68.93 5.41 26 10.91 18 pP DLTR 67.34 61.77 9.71 28 18.68 1 DNB 126.96 123.29 4.36 26 7.09 18 pP DNR 9.74 11.50 -7.22 61 -42.40 12 DO 32.22 37.29 -1.21 10 -9.85 31 DOV 81.11 79.90 3.38 21 1.80 30 pP DOW 51.76 50.03 4.36 18 4.99 2 DPS 72.89 69.73 6.19 27 12.52 1 DRI 55.86 53.68 5.05 24 11.08 2 DTE 80.67 80.11 -1.87 6 -0.68 17 Add DTV 87.15 86.54 0.34 18 0.17 2 w DUK 79.69 80.45 -2.66 9 1.45 24 spBuy DVA 76.10 76.26 -2.78 7 0.90 24 spBuy DVN 64.02 62.87 3.73 15 4.40 14 w EA 43.68 40.61 8.19 24 20.70 18 pP EBAY 54.57 53.32 2.72 18 4.30 2 ECL 113.75 112.09 2.82 14 1.54 2 w ED 62.33 61.49 -1.72 37 9.24 17 Add EFX 79.35 76.74 4.59 22 5.51 1 EIX 62.61 60.97 0.81 35 7.84 17 Add EL 73.21 73.48 0.59 16 1.32 12 w EMC 30.04 29.16 3.79 21 5.37 2 EMN 86.76 82.54 6.47 18 5.15 2 EMR 65.38 63.62 3.55 26 3.65 1 EOG 94.07 98.65 1.42 0 0.00 39 Sell EQR 71.04 67.76 2.97 35 11.51 17 EQT 92.45 91.16 0.52 23 5.55 2 w ESRX 82.34 76.58 8.51 26 11.33 1 ESS 202.21 194.91 1.25 32 9.90 17 ESV 37.15 40.37 -0.77 11 -5.33 31 ETFC 22.90 22.24 1.56 21 6.76 2 ETN 69.21 66.17 2.98 21 4.52 1 ETR 82.17 81.07 -0.57 69 9.65 2 w EW 129.16 121.55 5.06 26 21.60 17 EXC 35.69 36.37 -2.70 10 -1.19 7 w
- 15. EXPD 45.19 42.67 5.14 26 10.49 1 EXPE 85.59 84.20 0.72 18 1.00 2 w F 15.61 14.84 8.17 10 6.12 14 FAST 45.24 44.06 2.97 21 4.36 13 FB 77.62 74.10 -0.40 1 2.77 5 FCX 29.34 28.72 2.23 3 -1.25 9 w FDO 79.04 78.17 1.68 23 1.35 5 FDX 175.08 168.62 4.76 26 8.92 1 FE 36.44 36.14 -0.37 6 -0.14 2 w FFIV 129.09 124.11 3.88 21 8.45 18 pP FIS 60.76 58.18 6.28 24 10.01 1 FISV 70.90 68.77 3.46 26 9.58 2 FITB 20.29 19.86 1.46 21 4.27 14 FLIR 31.78 32.29 -4.43 5 0.47 32 spBuy FLR 66.72 65.64 4.22 5 1.20 13 w FLS 65.19 67.65 0.05 0 0.00 39 Sell FMC 55.69 57.20 -1.21 22 -2.49 31 AddSh FOSL 110.16 103.54 6.50 31 12.59 18 pP FOXA 36.32 34.64 4.05 15 4.10 1 FSLR 51.53 53.14 -2.40 47 -23.01 12 w FTI 52.18 55.61 -0.63 1 -1.95 15 FTR 7.06 6.62 7.26 25 12.06 2 GAS 52.12 52.90 -4.19 10 0.00 12 w GCI 32.74 30.83 4.41 26 6.65 13 GD 144.53 137.15 6.59 25 12.39 2 GE 26.87 26.19 5.54 26 6.00 2 GGP 26.83 25.41 5.84 35 12.31 1 GILD 100.30 105.30 -4.01 9 -3.09 8 GIS 51.85 51.18 0.82 5 0.06 13 GLW 21.07 20.06 4.04 21 6.58 1 GM 32.07 31.48 2.62 13 2.36 14 w GMCR 142.05 150.47 -6.31 4 -1.59 7 GME 37.20 42.25 -7.12 3 -1.41 11 GNW 9.11 10.56 -5.59 14 7.56 12 GOOGL 547.73 555.51 -2.25 7 -0.04 12 w GPC 101.84 97.05 6.68 28 15.78 18 pP
- 16. GPS 39.34 38.51 3.00 13 1.60 14 w GRMN 57.07 55.45 5.55 30 11.42 2 GS 188.52 187.60 -0.05 23 3.10 2 w GT 26.86 24.49 7.72 20 16.73 18 pP GWW 247.16 244.06 0.82 21 1.85 1 w HAL 47.34 52.51 -4.07 63 -29.67 11 HAR 108.75 104.54 2.90 19 -1.36 2 HAS 58.14 56.05 0.75 1 0.83 5 HBAN 10.25 9.91 2.51 21 5.67 2 HCBK 9.80 9.59 0.89 18 1.87 17 Add HCN 72.97 69.47 5.43 35 12.38 1 HCP 44.47 43.00 1.41 35 8.52 17 HD 97.70 96.00 0.53 4 -1.29 6 w HES 80.83 84.46 0.24 1 -1.60 31 HIG 41.13 39.23 7.99 26 10.98 18 pP HOG 68.29 66.22 6.29 26 9.23 2 HON 99.08 95.29 4.14 26 5.91 1 HOT 77.86 76.53 0.01 2 -0.68 9 w HP 77.73 83.93 -2.65 48 -22.66 12 HPQ 39.16 36.44 4.84 22 10.56 1 HRB 33.42 32.02 4.97 24 8.47 1 HRL 52.72 54.28 -2.53 1 2.73 3 HRS 71.57 69.34 3.40 26 7.13 2 HSP 60.29 55.89 7.90 23 15.45 2 HST 23.17 22.38 1.46 27 5.32 1 HSY 98.58 95.42 1.55 26 4.38 1 HUM 137.49 134.06 1.76 11 1.03 18 tP IBM 161.95 166.34 -2.61 44 -14.28 12 ICE 220.82 215.71 2.58 24 8.59 2 IFF 100.12 97.64 1.87 27 3.32 13 INTC 36.90 34.19 7.94 21 9.30 1 INTU 92.24 88.20 6.23 24 9.69 18 pP IP 53.37 52.00 3.10 27 10.04 2 IPG 20.28 19.30 7.29 25 9.27 1 IR 63.49 61.57 2.98 26 11.09 1 IRM 37.58 36.40 2.16 26 9.02 2
- 17. ISRG 515.01 504.25 2.32 27 6.34 2 w ITW 95.53 90.57 8.41 26 10.19 18 pP IVZ 40.46 39.52 0.30 21 3.11 1 JCI 49.89 47.90 6.18 21 12.26 2 JEC 47.47 47.34 1.04 4 -4.04 30 tP JNJ 107.21 106.20 -0.52 23 4.01 2 w JNPR 22.20 21.04 4.42 7 4.37 13 JOY 52.66 53.90 -0.55 9 0.38 15 w JPM 60.34 59.79 -0.04 23 3.23 2 w JWN 75.41 73.00 5.34 10 3.70 1 K 64.93 63.66 4.60 21 3.72 2 KEY 13.62 13.21 1.62 20 4.21 13 KIM 25.39 24.17 3.23 35 12.49 1 KLAC 67.33 80.15 0.55 0 0.00 35 Sell KMB 114.16 112.30 0.71 27 4.81 17 Add KMI 42.32 39.22 5.28 13 8.85 1 KMX 56.25 54.16 2.02 26 15.48 1 KO 44.29 42.88 8.00 15 4.31 18 pP KORS 75.83 72.83 3.74 3 2.06 13 KR 59.22 57.25 4.05 26 9.83 2 KRFT 59.28 57.66 4.74 23 4.42 1 KSS 58.67 57.14 3.83 4 -0.29 9 KSU 125.30 122.12 1.74 26 4.47 1 L 42.42 43.00 -1.60 0 0.00 35 Sell LEG 42.05 39.20 6.01 27 19.66 17 LEN 46.86 45.07 5.63 28 12.78 18 pP LH 102.15 102.23 -0.58 17 1.08 12 w LLL 124.41 119.05 3.26 24 8.32 1 LLTC 45.55 42.67 4.13 18 6.67 13 LLY 67.32 66.30 0.30 26 4.23 2 LM 56.68 53.51 6.73 26 11.31 1 LMT 189.15 184.82 1.12 24 4.12 1 LNC 57.57 54.37 6.88 22 11.77 18 pP LO 62.87 61.94 4.96 26 3.42 18 pP LOW 62.86 58.36 10.00 27 17.15 1 LRCX 82.19 77.51 2.39 26 12.11 1
- 18. LUK 23.73 24.13 0.16 0 0.00 39 Sell LUV 39.28 37.06 2.69 27 16.63 2 LVLT 49.55 46.37 5.55 22 13.70 2 LYB 89.54 91.52 1.44 41 -16.92 27 AddSh M 63.53 60.91 7.46 14 7.61 18 pP MA 86.56 81.96 4.42 26 16.80 1 MAC 79.06 70.29 10.00 35 20.56 1 MAR 77.48 73.44 2.91 26 11.63 2 MAS 24.12 23.33 5.21 14 4.01 1 MAT 30.88 30.86 0.38 4 -3.23 30 tP MCD 96.22 94.41 5.40 19 2.47 14 MCHP 45.05 42.87 2.34 18 4.52 13 MCK 208.24 202.63 3.32 26 5.49 1 MCO 100.17 98.87 2.49 26 5.85 2 w MDLZ 39.00 37.15 7.76 24 14.00 2 MDT 73.48 69.05 8.55 26 12.36 1 MET 55.87 53.55 5.00 22 7.53 1 MHFI 93.15 88.89 4.90 24 12.51 1 MHK 151.80 142.35 8.45 21 10.80 1 MJN 103.41 99.59 2.49 28 8.86 17 Add MKC 72.83 71.50 1.80 26 6.71 2 MLM 125.52 124.23 4.60 15 3.75 2 w MMC 56.48 54.42 4.82 26 9.86 2 MMM 158.31 153.12 5.20 26 12.36 2 MNK 91.64 88.04 -1.67 1 0.07 5 MNST 110.39 104.91 6.10 77 59.41 2 MO 49.72 48.35 1.65 77 18.89 17 MON 120.86 116.45 6.19 27 6.96 2 MOS 45.60 44.38 5.24 18 2.89 2 MPC 95.67 89.89 4.38 26 12.49 18 pP MRK 59.75 58.55 1.58 19 3.09 2 MRO 32.50 33.91 -0.51 53 -17.72 12 MS 35.12 34.99 0.54 23 2.39 2 w MSFT 47.75 48.24 -1.11 1 0.55 3 w MSI 65.56 63.94 3.75 27 6.17 2 MTB 126.36 122.53 3.64 18 3.05 17
- 19. MU 35.62 32.62 4.30 26 13.01 1 MUR 51.58 53.40 0.01 0 0.00 39 Sell MWV 44.73 43.60 2.74 26 6.00 18 tP MYL 58.62 53.93 4.52 28 18.47 17 NAVI 20.91 19.66 6.74 28 12.97 2 NBL 53.83 57.23 -0.08 1 -2.18 31 NBR 15.07 17.33 -3.07 59 -41.25 31 NDAQ 44.83 43.14 3.65 21 6.74 1 NE 19.71 21.52 -0.68 86 -38.83 31 NEE 103.20 100.89 1.35 27 8.39 2 NEM 19.53 20.58 0.43 59 -23.77 12 NFLX 351.16 381.29 -5.07 33 -22.18 11 NFX 32.48 32.22 2.27 13 -5.17 14 w NI 41.82 41.12 -0.93 0 0.00 33 Buy NKE 97.80 93.95 5.89 29 11.40 2 NLSN 41.71 42.21 -3.35 8 0.31 32 spBuy NOC 141.45 134.73 4.97 24 9.51 1 NOV 71.29 73.52 0.45 0 0.00 39 Sell NRG 30.92 31.60 -2.02 1 0.23 3 w NSC 117.20 112.89 3.82 26 10.04 2 NTAP 42.70 41.46 1.79 23 5.22 1 NTRS 67.61 66.29 2.63 18 2.08 2 NU 49.64 48.69 1.36 38 8.69 2 NUE 54.23 52.83 2.25 23 3.67 18 tP NVDA 20.92 19.40 5.42 26 14.38 1 NWL 36.00 35.12 4.81 14 4.14 1 NWSA 15.68 15.21 0.64 0 0.00 37 Buy OI 25.82 25.64 1.27 3 -1.19 13 w OKE 57.46 57.05 1.09 3 -1.63 9 w OMC 76.64 71.94 8.50 24 10.64 1 ORCL 41.87 40.04 6.37 18 7.30 2 ORLY 180.32 174.12 2.65 27 15.37 2 OXY 86.13 88.31 -0.64 58 -14.09 27 AddSh PAYX 47.35 46.49 1.77 26 5.48 2 PBCT 14.88 14.58 1.60 18 1.50 17 Add PBI 24.57 24.45 -0.03 1 -2.89 13 w
- 20. PCAR 67.36 64.34 4.36 26 13.23 1 PCG 49.94 48.62 0.36 25 7.35 2 PCL 41.48 40.76 2.32 31 3.83 13 PCLN 1166.83 1138.46 2.01 11 0.31 30 tP PCP 239.07 229.30 7.15 6 3.50 13 PDCO 47.77 44.43 9.40 26 14.83 1 PEG 41.21 40.09 1.39 6 1.85 1 PEP 99.35 96.88 4.12 27 6.53 17 PETM 78.21 72.56 9.71 26 13.33 1 PFE 31.10 29.83 2.76 23 6.84 17 PFG 54.18 52.05 3.69 21 6.05 1 PG 88.88 87.41 0.80 27 5.37 17 Add PGR 27.24 26.59 4.30 26 6.95 2 PH 131.69 125.21 5.95 24 13.27 18 pP PHM 21.50 20.49 6.66 28 17.81 2 PKI 45.64 43.53 5.28 21 6.69 1 PLD 42.00 40.40 1.98 28 7.58 1 PLL 97.68 91.34 7.19 27 16.41 1 PM 86.60 87.87 -3.27 8 0.31 20 spBuy PNC 88.06 85.92 1.65 21 4.90 1 PNR 68.03 67.28 1.86 24 2.46 30 tP PNW 62.37 60.52 2.04 35 9.54 2 POM 27.47 27.24 0.53 23 1.37 2 w PPG 216.95 203.55 7.83 26 9.84 1 PPL 35.24 35.66 -1.91 2 0.00 3 w PRGO 159.22 154.04 0.58 12 1.95 1 PRU 85.78 84.35 -0.72 2 -0.07 9 w PSA 186.63 180.29 1.64 35 10.03 17 PSX 79.28 75.48 5.36 4 0.34 13 PVH 124.49 119.26 6.55 14 6.19 1 PWR 33.51 33.10 -0.24 1 -0.92 9 w PX 129.88 126.77 4.38 13 2.52 1 PXD 160.81 176.18 -1.82 15 -6.66 31 QCOM 72.26 72.79 -1.25 14 2.22 12 w QEP 24.18 25.34 0.29 59 -28.23 16 R 93.98 89.78 3.30 21 7.63 1
- 21. RAI 65.20 63.41 2.74 27 9.29 2 REGN 415.84 394.91 4.45 12 6.60 2 RF 10.14 9.92 1.06 20 4.32 2 RHI 56.97 54.79 3.68 26 10.49 2 RHT 62.10 60.41 3.87 21 8.36 2 RIG 23.27 28.39 -6.16 93 -46.25 31 RL 182.07 170.84 8.29 19 8.90 1 ROK 114.65 109.91 3.20 3 0.25 13 ROP 159.53 154.70 2.76 26 7.38 1 ROST 89.77 81.73 9.24 84 39.59 1 RRC 68.76 71.98 -0.29 1 0.32 15 RSG 39.65 39.06 0.49 0 0.00 34 wBuy RTN 106.67 102.26 4.25 24 7.87 1 SAIC 50.03 48.81 0.28 24 7.38 17 Add SBUX 79.70 77.53 5.45 23 4.86 1 SCG 56.52 54.18 2.93 31 10.33 2 SCHW 28.30 28.08 -0.43 20 2.87 2 w SE 39.27 38.52 1.01 4 -0.76 13 w SEE 39.12 36.36 5.55 20 11.93 2 SHW 240.60 233.41 5.04 28 10.88 2 SIAL 136.53 134.73 2.52 47 0.29 1 SJM 101.13 102.53 -2.75 10 0.97 4 w SLB 92.81 97.69 -0.53 1 -2.13 31 SNA 136.08 130.90 3.06 29 11.78 2 SNDK 104.26 95.16 8.27 18 11.40 1 SNI 77.97 75.16 4.18 4 0.74 13 SO 46.82 46.39 -0.52 40 6.46 2 w SPG 180.69 175.85 0.44 35 7.43 1 SPLS 13.92 12.93 8.17 27 14.38 1 SRCL 128.10 125.28 2.02 28 8.72 1 SRE 111.67 109.43 0.04 1 0.60 1 STI 39.67 38.62 2.03 22 4.67 2 STJ 67.84 64.46 4.72 20 9.70 1 STT 76.87 74.72 1.79 23 7.53 1 STX 65.85 62.00 6.61 23 14.13 1 STZ 94.76 91.93 2.87 26 9.22 2
- 22. SWK 94.77 92.41 2.45 24 6.80 2 SWN 32.65 34.58 -1.24 9 -2.94 15 SWY 34.80 34.64 0.89 20 0.29 2 w SYK 92.37 87.97 7.59 25 10.65 1 SYMC 25.93 24.90 3.87 26 9.69 1 SYY 39.93 38.63 5.17 13 5.02 1 T 35.13 35.27 -0.43 2 1.44 3 w TAP 76.50 74.69 1.19 23 4.98 17 Add TDC 44.86 43.34 4.36 18 6.05 2 TE 19.68 19.09 1.18 39 10.75 17 Add TEG 71.87 70.72 1.22 35 7.70 2 TEL 63.77 60.31 5.63 21 10.71 1 TGT 72.16 66.39 10.00 13 11.26 1 THC 48.23 51.23 -2.78 20 -14.40 12 TIF 106.21 99.91 8.07 18 10.31 18 pP TJX 64.52 62.33 1.33 4 1.00 5 TMK 53.83 52.93 2.80 18 1.74 13 TMO 128.66 120.81 8.60 21 8.62 1 TRIP 72.77 75.68 -3.15 56 -24.61 12 TROW 83.11 80.65 2.51 26 6.85 1 TRV 104.37 101.15 4.96 26 10.15 2 TSCO 75.69 72.30 5.11 26 22.83 18 pP TSN 42.07 40.78 3.08 19 5.28 2 TSO 78.35 71.54 7.20 27 18.82 1 TSS 32.98 32.35 -1.27 26 7.53 1 TWC 149.53 141.72 3.55 5 5.04 13 TWX 83.79 78.46 5.29 15 6.86 1 TXN 54.33 50.21 6.29 26 14.60 17 TXT 43.29 40.82 7.17 28 18.12 18 pP TYC 42.85 42.08 -0.53 3 0.56 13 UA 71.48 68.07 4.28 14 7.33 17 UHS 104.00 101.09 2.86 6 0.84 5 UNH 98.11 93.91 4.71 28 11.19 17 UNM 33.65 33.59 -0.83 11 -1.49 14 w UNP 123.31 117.72 5.34 28 16.77 13 UPS 106.98 105.24 0.76 27 8.18 2
- 23. URBN 32.48 31.37 2.66 2 -2.02 9 URI 118.70 111.50 3.45 26 8.87 1 USB 44.38 42.77 4.57 23 8.83 2 UTX 110.16 106.64 4.60 21 3.22 13 V 257.26 239.84 7.47 26 20.62 1 VAR 89.00 84.97 5.78 22 8.06 2 VFC 74.05 70.29 8.77 26 10.77 18 pP VIAB 75.23 72.35 5.23 8 3.06 13 VLO 50.94 48.98 1.56 26 5.29 13 VMC 67.12 64.34 6.80 27 12.28 2 VNO 111.05 106.97 3.05 33 8.35 1 VRSN 60.07 59.02 0.83 26 5.94 2 w VTR 71.00 67.61 4.40 35 11.36 1 VZ 50.04 50.49 -2.46 2 1.42 3 w WAG 68.47 65.74 3.77 24 10.22 2 WAT 115.87 109.70 7.38 26 7.63 18 pP WDC 103.67 97.84 5.69 21 11.47 1 WEC 48.48 47.60 -0.82 36 9.54 17 Add WFC 54.28 52.86 2.74 23 6.04 1 WFM 48.36 44.61 8.55 26 27.43 2 WHR 183.54 167.32 8.67 28 21.55 1 WIN 10.08 9.84 0.56 0 0.00 37 Buy WLP 126.90 124.21 1.22 26 5.33 2 WM 48.70 48.88 -1.70 4 -0.16 3 w WMB 54.85 54.13 0.73 26 -0.18 18 tP WMT 84.98 81.39 9.29 16 9.13 2 WPO 660.34 645.86 1.11 14 0.64 5 WU 18.28 17.62 4.28 26 10.45 2 WY 34.92 33.89 3.60 28 6.14 1 WYN 82.50 78.96 4.06 11 4.35 1 WYNN 177.06 182.62 -1.52 15 -1.51 15 XEC 115.60 113.91 2.75 13 -3.44 30 tP XEL 33.50 32.78 0.85 35 5.85 2 XL 35.58 34.12 7.96 22 5.36 1 XLNX 45.49 43.30 3.08 28 11.03 1 XOM 94.48 95.83 0.17 0 0.00 39 Sell
- 24. XRAY 54.52 50.97 8.97 22 16.55 1 XRX 13.89 13.18 3.49 18 4.67 1 XYL 38.54 36.46 5.08 24 9.99 1 YHOO 51.93 47.99 6.85 26 22.42 2 YUM 76.75 72.82 7.84 18 7.01 1 ZION 28.89 28.62 -0.28 21 1.65 2 w ZMH 111.63 108.73 1.56 26 9.61 17 Add ZTS 44.67 40.65 8.67 23 22.05 2 Strategy numbers (Str. #) Full list of strategies corresponding to the numbers given in the "Str. #" column: #1: Fully Bullish, rallying. Stay Long. #2: Bullish, stagnating. Market peaking or consolidating. Hold. #3: Bearish, ongoing decline. Wait for daily MoM to turn back up. #4: Bearish, trying to stage a rally. Daily MoM is continuing to go up and you can still do some speculative buying as long as the stock is near a recent low. #5: Bullish, rallying. Stay long. #6: Weak Bullish, stagnating. Market peaking or consolidating. Cautious hold on remaining position (if any). #7: Bearish, ongoing decline. Wait for daily MoM to turn back up. #8: Bearish, trying to stage a rally. Daily MoM continues to go up and you can still do some speculative buying as long as the stock is near a recent low. #9: Rallying. Hold. #10: Recent rally is stagnating or reversing. Cautious hold on any remaining position. #11: Fully Bearish, ongoing decline. Stay out (or short) and wait for buy signals. #12: Bearish, stabilizing. Market trying to bottom out. Speculative buy as long as the stock is near a recent low. #13: Rallying. Hold. #14: Recent rally is stagnating or reversing. Cautious hold on any remaining position. #15: Bearish, ongoing decline. Stay out (or short) and wait for buy signals. #16: Weak Bearish, stabilizing. Market trying to bottom out. Speculative buy as long as the stock is near a recent low. #17: Fully Bullish, rally resuming. Stay Long. #18: Bullish, rally hesitating. Market peaking or consolidating. If the position shows a nice profit, then you can sell half and keep the rest. If the position is breakeven or showing a small loss then it is better to get out at this point. #19: Bearish, decline resuming. Stay out and wait for daily MoM to turn back up. #20: Bearish but trying to stage a rally. Daily MoM has turned up and you can do some speculative buying as long as the stock is near a recent low. #21: Bullish, rally resuming. Stay long. #22: Weak bullish, rally stagnating. Market peaking or consolidating. If the position shows a nice profit, then sell half and keep the rest with a stop-loss just under a recent low. If the position is breakeven or showing a small loss then it is better to get out at this point. #23: Bearish, decline resuming. Stay out and wait for daily MoM to turn back up.
- 25. #24: Bearish but trying to stage a rally. Daily MoM has turned up and you can do some speculative buying as long as the stock is near a recent low. #25: Rally resuming. Hold. #26: Recent rally is stagnating or reversing and daily MoM has turned down. If you have any position in this stock then it is better to get out and wait for a more favorable entry point. #27: Fully Bearish, decline resuming. Another leg down appears to be starting. Stay out or go short. #28: Bearish, stabilizing. Market trying to bottom out. Speculative buy as long as the stock is near a recent low. #29: Rally resuming. Hold. #30: Recent rally is stagnating or reversing and daily MoM has turned down. If you have any position in this stock then it is better to get out and wait for a more favorable entry point. #31: Bearish, decline resuming. Another leg down appears to be starting. Stay out or go short. #32: Bearish, stabilizing. Market trying to bottom out. Speculative buy as long as the stock is near a recent low. #33: Buy signal. Buy outright on the Open. Or use a buy limit order near the halfway point between the current price and the daily key level if you want to try to get in a bit cheaper. #34: Weak Buy signal. MoM keeps going down, which means this could be a fake out move. Cautious Buy on next Open or wait a day to see if MoM turns up. #35: Sell signal. Sell any remaining position at Open. This signal can be used to go short. Sell short outright on the Open. Or use a sell limit order near the halfway point between the current price and the daily key level (see table) if you want to try for a better entry point. #36: Weak sell signal. MoM continues to go up, which indicates a possible whipsaw move. Sell or put a stop-loss just below today's low. For short sellers this is a trade to avoid. #37: Buy signal. Buy outright on the Open. Or use a buy limit order near the halfway point between the current price and the daily key level if you want to try to get in a bit cheaper. #38: Weak Buy signal. MoM keeps going down, which means this could be a fake out move. With the weekly(W) trend bearish this is a trade to avoid. #39: Sell signal. Sell remaining position at Open. This signal can be used to go short. Sell short outright on today's Open. Or use a sell limit order near the halfway point between the current price and the daily key level (see table) if you want to try for a better entry point. #40: Weak sell signal. MoM continues to go up, which indicates a possible whipsaw move. Sell or put a stop-loss just below today's low. Trading styles: * Conservative investors should go with the normal buy and sell signals (#33 - #40) only and can negate the info about speculative buys and short selling. This is a trend following method, so you will not buy at the bottom and there will be some “give-back” at the end of a trend. The aim is to participate in the bulk of a move with a minimum of risk. * Short selling can be done on signals #27, #31, #35 and #39. It is not for everybody. When you are convinced the market (or a particular stock) is overvalued and ready for a drop, then you can use these signals to go short. MoM turning down after a weak rally gives good entry points, that's what we have in #27 and #31. Good chances also come along when a stock has been in bullish mode for a long time with MoM cruising above +8 for extended periods. You can then look to go short on a #35 signal after a double top or flat topping range. A good second chance to go short may appear on a #39 signal. Profit (or loss) is to be taken when the next regular buy signal appears (#33, #34, #37, #38). * Speculative buying opportunities appear when MoM starts going up for a stock that has been in
- 26. bearish(red) mode for a while. This is the case on signals #4, #8, #12, #16, #20, #24, #28 and #32. These signals can allow you to pick up stocks within days of a major low (especially with #28 and #32), but some care needs to be taken. Try to buy near the recent low, and use a properly positioned stop-loss, e.g. just below the recent low, because not all those speculative buys will work. Keep losers small and let the profits run. You can take some partial profits when the stock comes close to its daily key level and let the rest run for a regular buy if the stock breaks out above the daily key level (which make it a normal buy trade per #33 or #37). Note: struggling companies may never recover, so this method is best used on ETFs or on stocks of companies that are in good financial shape. The MoM indicator The MoM indicator shows market momentum on a numeric scale between +10 and -10. You could compare it to the Richter scale for earthquakes, or a market thermometer if you want. Various levels in the MoM indicator correspond to market mood as follows: * +8 to +10: very optimistic – euphoric * +5 to +8: optimistic * +3 to +5 : positive * -3 to +3: neutral * -3 to -5: negative * -8 to -5: pessimistic * -10 to -8: very pessimistic – depressed Besides the level itself, we also pay attention to the direction. In a healthy bull market, the MoM will be rising together with the market. When MoM starts going down in a bull market (green), it is a first indication that the market may have peaked (or about to do so), and that’s when market mode sets to light green. In a rising market you will typically find MoM hovering between +3 and +10. Market pullbacks will generally end with MoM bottoming out in the neutral zone ( -3 to +3) before turning back up. In a declining market you will typically find MoM hovering between -3 and -10. Market rebounds will generally end with MoM peaking out in the neutral zone ( -3 to +3) before turning back down. Q & A Q: Where can I find more information about these key levels and MoM indicator you use? A: You can find more materials here: http://lunatictrader.wordpress.com/key-reversal-levels/. More will be added in the near future as well as example trades. Q: I am a fundamental investor, can I do anything with these key levels? A: Well, even if you select stocks based on fundamentals it will make a difference when you buy (sell) them. Better timing can make a big difference, even for a long term buy and hold investor. For example if your analysis shows you that company XYZ is great value, then you can still wait until the key reversal levels give a buy signal ( or a speculative buy) to get in. Just try and see whether it improves your entries. Q: Your predictions for yesterday didn't work very well. But your table always shows a lot of blue (profits). Why should I believe this? A: The key reversal levels are not a prediction, they are an approach to trading. All you can do is try it in your own trading and see if it works. It will naturally take more than one day to see if a method is good or not. You can also verify the "%Ch." numbers if you want. Just take the Open on the day
- 27. after the buy (sell) signal was given and calculate the change to date. Q: A stock I own is already trading below its key reversal level intraday. So it will probably turn to bearish mode tomorrow. Do I need to wait for the Open tomorrow to sell this stock? A: If going into the close you see that one of your stocks is almost certain to close below the key level then you can already sell it with a MOC (market on close) order. Sometimes this will give you a slightly better exit than waiting another day. Q: Do I need to take all buy signals in the list? A: No. If for example IBM gives a buy signal but you do not believe in that company, then you just skip that one. It is also possible that a stock jumps 20% on good news and is already too far above the daily key level when the buy signal appears. In that case you can wait until the price comes back to the daily key level to pick it up. So, that's where you can always use some discretion. Q: Do I need to take all sell signals for stocks I own? What if I am sure my stock will recover soon? A: If you intend to use these key reversals properly, then the answer is: yes, always sell when a stock has closed below its daily key level. True, sometimes a stock will come right back after giving a sell signal, but many more times that doesn't happen and the stock just keeps sinking for some reason that you may not hear about until weeks later (and maybe 10% lower). Then you will be happy if you sold on the key reversal sell signal. This is a discipline thing. Also remember, if the stock happens to come right back then it will climb back above its key level and give a buy signal. We can then just buy it right back. That would costs us a few %, but that's a small price to pay for avoiding big losers. Q: How many winners can I expect with this method? A: It is better to ask how big the winners will be versus the losers. You may have only 40% winners and still come out well ahead. You can always see in the table what kind of winners you can expect. There are always stocks that show 10% or better profits (see % Ch.) if you had taken the latest buy signal (or shorted the latest sell). If you stick to buying stocks that are only a few % above their daily key levels when they give a buy signal then you will keep most of your losses small. A stock crashing overnight is always possible, so proper diversification is always needed. Q: If a stock crashes 30% and falls below the daily key reversal then it will give a Sell signal tomorrow. That doesn't help me today and I do not want to suffer the risk of such big losses. What to do? A: A large adverse move overnight can never be ruled out. A well diversified portfolio will offer some protection already. But you can use a disaster stop-loss, which I would put 5 or 10% below the key reversal level. That will sometimes get you out of a crashing stock before the losses get even bigger. If you have questions, then you can contact me on my blog: http://LunaticTrader.wordpress.com On Twitter: https://twitter.com/lunatictrader1 Or find me on Scutify.com and ask away: http://www.scutify.com/profiles/scutifier.aspx?q=LunaticTrader Happy Trading, Danny (aka LunaticTrader)
- 28. © 2014 LunaticTrader.Wordpress.com Disclaimer Investing in stocks, forex or commodities is risky. No guarantee can be given that the opinions or predictions given on this site will be correct. LunaticTrader cannot in any way be responsible for eventual losses you may incur if you trade based on the information given on this site. Hypothetical or simulated performance results have certain inherent limitations. Unlike an actual performance record, simulated results do not represent actual trading. Also, since the trades have not actually been executed, the results may have under- or over-compensated for the impact, if any, of certain market factors, such as lack of liquidity. Simulated trading programs in general are also subject to the fact that they are designed with the benefit of hindsight. No representation is being made that any account will or is likely to achieve profits or losses similar to those shown. The information on this site should not be considered as a recommendation to engage in the purchase and/or sale of any stock, futures contract and/or options. You should be aware of all the risks associated with trading, and seek the advice from your own independent financial advisor before you make any investment decisions. Trade at your own risk and responsibility.