SlideShare a Scribd company logo
1 of 33
Download to read offline
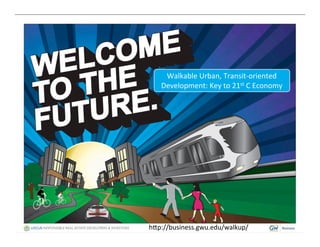
Walkable	
  Urban,	
  Transit-­‐oriented	
  
    Development:	
  Key	
  to	
  21st	
  C	
  Economy	


h@p://business.gwu.edu/walkup/	
  
`	
  
Arlington	
  Starts	
  Transforms	
  in	
  1980s:	
  
Rail	
  Transit,	
  Overlay	
  Zoning	
  &	
  Mgmt	
  
1980s:	
  Ex-­‐Sears	
  Stores	
                                          Same	
  Place	
  Today	


 Two	
  blocks	
  north	
  and	
  south,	
  single	
  family	
  housing	
  that	
  is	
  highest	
  priced	
  in	
  
                    Arlington	
  on	
  $/foot	
  basis:	
  Best	
  of	
  Two	
  Worlds	
  
                   10%	
  of	
  the	
  land=50%+	
  of	
  government	
  revenues	
  
         Among	
  best	
  schools	
  in	
  Country…new	
  housing	
  has	
  0.4	
  per	
  unit	


Metropolitan	
  Land	
  Use	
  Op]ons	
  
                Economic	
            Regionally	
  	
                          Local-­‐	
  
                Role	
                Significant	
                             Serving	
  
   Form	
  
              	
                  Place—e.g.	
  TOD	
                   Neighborhood	
  
              	
                  1-­‐2%	
  of	
  Metro	
  Area	
      3-­‐7%	
  of	
  Metro	
  Area	
  
  Walkable	
  Urban	


                        Edge	
  City	
                      Bedroom	
  
Drivable	
  	
  Sub-­‐Urban	
     5-­‐7%	
  of	
  Metro	
  Area	
          Community	


                                                                      80-­‐85%	
  of	
  Metro	
  Area	


Rail	
  Transit,	
  especially	
  streetcars	
  
   Rock	
  Creek	
  Railway,	
  DC,	
  1903	
                            Salt	
  Lake	
  City-­‐1920s	


West	
  End	
  &	
  Atlanta	
  Street	
  Car-­‐1920s	
     Pacific	
  Electric,	
  Los	
  Angeles-­‐1918	
  
How	
  to	
  Pay	
  for	
  Transit?	
  Local	
  Taxes	


                                 But	
  Also…Value	
  Capture	
  &	
  TIFIA	
  
                                                ProgressiveAPTURE—PUBLIC	
  (TIF)	
  &	
  PRIVATE	
  Latching
                                                   VALUE	
  C Real Estate Cash Flows with Value
                                                                 GentrificaNon	
  Pays	
  Transit	
  
                                   +
                                 250%


                                                                             Value Latching
                                 200%
Value Creation / Cash Flow ($)


                                 150%


                                 100%


                                 50%


                                  0%
                                        1   2    3       4   5      6    7      8      9       10   11   12   13   14   15    16   17    18   19   20
                                            Short Term                              Mid Term                                 Long Term
                                                                                           Time (years)
Christopher	
  B.	
  Leinberger	
  
   Land	
  use	
  strategist,	
  developer,	
  author,	
  researcher,	
  professor	
  
                            (www.cleinberger.com)	
  
•  The	
  Op'on	
  of	
  Urbanism;	
  
   Inves'ng	
  in	
  a	
  New	
  American	
  
   Dream,	
  Island	
  Press,	
  2008	
  
•  The	
  Next	
  Slum?,	
  The	
  Atlan]c	
  
   Monthly,	
  March,	
  2008	
  	
  
•  Here	
  Comes	
  the	
  
   Neighborhood,	
  The	
  Atlan]c	
  
•  “The	
  Death	
  of	
  the	
  Fringe	
  
   Suburbs”,	
  New	
  York	
  Times,	
  
   November	
  26,	
  2011	
  
•  “Now	
  Coveted,	
  A	
  Walkable	
  
   Convenient	
  Place”,	
  New	
  
   York	
  Times,	
  May	
  25,	
  2012	
  

More Related Content

Similar to Walkable urban-tod

LTC, Jack R. Widmeyer Transportation Research Conference, Going to San Bernar...
LTC, Jack R. Widmeyer Transportation Research Conference, Going to San Bernar...LTC, Jack R. Widmeyer Transportation Research Conference, Going to San Bernar...
LTC, Jack R. Widmeyer Transportation Research Conference, Going to San Bernar...LTC @ CSUSB
 
Smart City Orchestration via Integrated Decision Analytics
Smart City Orchestration via Integrated Decision AnalyticsSmart City Orchestration via Integrated Decision Analytics
Smart City Orchestration via Integrated Decision AnalyticsBiomatica BV
 
Smart City Orchestration
Smart City OrchestrationSmart City Orchestration
Smart City OrchestrationScott Mongeau
 
Startupfest 2017: Micah Kotch (URBAN-X)
Startupfest 2017: Micah Kotch (URBAN-X)Startupfest 2017: Micah Kotch (URBAN-X)
Startupfest 2017: Micah Kotch (URBAN-X)Startupfest
 
14 15 vmt_sb375-1
14 15 vmt_sb375-114 15 vmt_sb375-1
14 15 vmt_sb375-1Mei Chi Lo
 
360 degrees
360 degrees360 degrees
360 degreesHitReach
 
Architecting Smart City Solutions: Analytics-based Financial Engineering
Architecting Smart City Solutions: Analytics-based Financial EngineeringArchitecting Smart City Solutions: Analytics-based Financial Engineering
Architecting Smart City Solutions: Analytics-based Financial EngineeringScott Mongeau
 

Similar to Walkable urban-tod (12)

LTC, Jack R. Widmeyer Transportation Research Conference, Going to San Bernar...
LTC, Jack R. Widmeyer Transportation Research Conference, Going to San Bernar...LTC, Jack R. Widmeyer Transportation Research Conference, Going to San Bernar...
LTC, Jack R. Widmeyer Transportation Research Conference, Going to San Bernar...
 
1qtr16
1qtr161qtr16
1qtr16
 
100 years of transport in Canberra Australia.ppt
100 years of transport in Canberra Australia.ppt100 years of transport in Canberra Australia.ppt
100 years of transport in Canberra Australia.ppt
 
Infrastructure, Urban Growth, & Global Competitiveness
Infrastructure, Urban Growth, & Global CompetitivenessInfrastructure, Urban Growth, & Global Competitiveness
Infrastructure, Urban Growth, & Global Competitiveness
 
Smart City Orchestration via Integrated Decision Analytics
Smart City Orchestration via Integrated Decision AnalyticsSmart City Orchestration via Integrated Decision Analytics
Smart City Orchestration via Integrated Decision Analytics
 
Smart City Orchestration
Smart City OrchestrationSmart City Orchestration
Smart City Orchestration
 
Case studies in new york city property development
Case studies in new york city property developmentCase studies in new york city property development
Case studies in new york city property development
 
Startupfest 2017: Micah Kotch (URBAN-X)
Startupfest 2017: Micah Kotch (URBAN-X)Startupfest 2017: Micah Kotch (URBAN-X)
Startupfest 2017: Micah Kotch (URBAN-X)
 
14 15 vmt_sb375-1
14 15 vmt_sb375-114 15 vmt_sb375-1
14 15 vmt_sb375-1
 
10.26.22.pptx
10.26.22.pptx10.26.22.pptx
10.26.22.pptx
 
360 degrees
360 degrees360 degrees
360 degrees
 
Architecting Smart City Solutions: Analytics-based Financial Engineering
Architecting Smart City Solutions: Analytics-based Financial EngineeringArchitecting Smart City Solutions: Analytics-based Financial Engineering
Architecting Smart City Solutions: Analytics-based Financial Engineering
 

More from Metropolitan Area Planning Council

Presentation by Gregory Miao, Esq., Metropolitan Area Planning Council Munici...
Presentation by Gregory Miao, Esq., Metropolitan Area Planning Council Munici...Presentation by Gregory Miao, Esq., Metropolitan Area Planning Council Munici...
Presentation by Gregory Miao, Esq., Metropolitan Area Planning Council Munici...Metropolitan Area Planning Council
 
Presentation by Jeff Bagg, Central Massachusetts Regional Planning Commission...
Presentation by Jeff Bagg, Central Massachusetts Regional Planning Commission...Presentation by Jeff Bagg, Central Massachusetts Regional Planning Commission...
Presentation by Jeff Bagg, Central Massachusetts Regional Planning Commission...Metropolitan Area Planning Council
 

More from Metropolitan Area Planning Council (20)

Autonomous Vehicles
Autonomous Vehicles Autonomous Vehicles
Autonomous Vehicles
 
EV Ride and Drive Event
EV Ride and Drive Event EV Ride and Drive Event
EV Ride and Drive Event
 
Autonomous Vehicles: Boston’s approach
Autonomous Vehicles: Boston’s approachAutonomous Vehicles: Boston’s approach
Autonomous Vehicles: Boston’s approach
 
Electric Vehicles
Electric VehiclesElectric Vehicles
Electric Vehicles
 
Opening Remarks and Introduction of Panelists
Opening Remarks and Introduction of PanelistsOpening Remarks and Introduction of Panelists
Opening Remarks and Introduction of Panelists
 
State of Equity Five-Year Update
State of Equity Five-Year UpdateState of Equity Five-Year Update
State of Equity Five-Year Update
 
Presentation by Gregory Miao, Esq., Metropolitan Area Planning Council Munici...
Presentation by Gregory Miao, Esq., Metropolitan Area Planning Council Munici...Presentation by Gregory Miao, Esq., Metropolitan Area Planning Council Munici...
Presentation by Gregory Miao, Esq., Metropolitan Area Planning Council Munici...
 
Presentation by Jeff Bagg, Central Massachusetts Regional Planning Commission...
Presentation by Jeff Bagg, Central Massachusetts Regional Planning Commission...Presentation by Jeff Bagg, Central Massachusetts Regional Planning Commission...
Presentation by Jeff Bagg, Central Massachusetts Regional Planning Commission...
 
Municipal IT Collaboration
Municipal IT CollaborationMunicipal IT Collaboration
Municipal IT Collaboration
 
IT Strategic Planning Arlington's Approach
IT Strategic Planning Arlington's ApproachIT Strategic Planning Arlington's Approach
IT Strategic Planning Arlington's Approach
 
MassIT: Activating IT Resources at the State Level
MassIT: Activating IT Resources at the State LevelMassIT: Activating IT Resources at the State Level
MassIT: Activating IT Resources at the State Level
 
I.T. Regionalization
I.T. RegionalizationI.T. Regionalization
I.T. Regionalization
 
Vision board
Vision boardVision board
Vision board
 
Vision board
Vision boardVision board
Vision board
 
Feedback boards from PlanAshland December 7, 2015 Forum
Feedback boards from PlanAshland December 7, 2015 ForumFeedback boards from PlanAshland December 7, 2015 Forum
Feedback boards from PlanAshland December 7, 2015 Forum
 
PlanAshland Forum 12/7/2015
PlanAshland Forum 12/7/2015 PlanAshland Forum 12/7/2015
PlanAshland Forum 12/7/2015
 
Presentations from the MAPC Fall Council Meeting
Presentations from the MAPC Fall Council MeetingPresentations from the MAPC Fall Council Meeting
Presentations from the MAPC Fall Council Meeting
 
Reardon mapc joint_housingcommittee_9_29_15
Reardon mapc joint_housingcommittee_9_29_15Reardon mapc joint_housingcommittee_9_29_15
Reardon mapc joint_housingcommittee_9_29_15
 
Chelsea asthma prevalence
Chelsea asthma prevalenceChelsea asthma prevalence
Chelsea asthma prevalence
 
Cost burdened households
Cost burdened householdsCost burdened households
Cost burdened households
 

Walkable urban-tod

  • 1. Walkable  Urban,  Transit-­‐oriented   Development:  Key  to  21st  C  Economy   h@p://business.gwu.edu/walkup/  
  • 2.
  • 3.
  • 4.
  • 5.
  • 7.
  • 8.
  • 9.
  • 10.
  • 11. Arlington  Starts  Transforms  in  1980s:   Rail  Transit,  Overlay  Zoning  &  Mgmt   1980s:  Ex-­‐Sears  Stores   Same  Place  Today       Two  blocks  north  and  south,  single  family  housing  that  is  highest  priced  in   Arlington  on  $/foot  basis:  Best  of  Two  Worlds   10%  of  the  land=50%+  of  government  revenues   Among  best  schools  in  Country…new  housing  has  0.4  per  unit    
  • 12.
  • 13.
  • 14.
  • 15.
  • 16.
  • 17.
  • 18.
  • 19.
  • 20.
  • 21.
  • 22.
  • 23.
  • 24.
  • 25.
  • 26.
  • 27. Metropolitan  Land  Use  Op]ons   Economic   Regionally     Local-­‐   Role   Significant   Serving   Form     Place—e.g.  TOD   Neighborhood     1-­‐2%  of  Metro  Area   3-­‐7%  of  Metro  Area   Walkable  Urban       Edge  City   Bedroom   Drivable    Sub-­‐Urban   5-­‐7%  of  Metro  Area   Community     80-­‐85%  of  Metro  Area    
  • 28.
  • 29.
  • 30. Rail  Transit,  especially  streetcars   Rock  Creek  Railway,  DC,  1903   Salt  Lake  City-­‐1920s   West  End  &  Atlanta  Street  Car-­‐1920s   Pacific  Electric,  Los  Angeles-­‐1918  
  • 31. How  to  Pay  for  Transit?  Local  Taxes       But  Also…Value  Capture  &  TIFIA   ProgressiveAPTURE—PUBLIC  (TIF)  &  PRIVATE  Latching VALUE  C Real Estate Cash Flows with Value GentrificaNon  Pays  Transit   + 250% Value Latching 200% Value Creation / Cash Flow ($) 150% 100% 50% 0% 1 2 3 4 5 6 7 8 9 10 11 12 13 14 15 16 17 18 19 20 Short Term Mid Term Long Term Time (years)
  • 32.
  • 33. Christopher  B.  Leinberger   Land  use  strategist,  developer,  author,  researcher,  professor   (www.cleinberger.com)   •  The  Op'on  of  Urbanism;   Inves'ng  in  a  New  American   Dream,  Island  Press,  2008   •  The  Next  Slum?,  The  Atlan]c   Monthly,  March,  2008     •  Here  Comes  the   Neighborhood,  The  Atlan]c   •  “The  Death  of  the  Fringe   Suburbs”,  New  York  Times,   November  26,  2011   •  “Now  Coveted,  A  Walkable   Convenient  Place”,  New   York  Times,  May  25,  2012