SlideShare une entreprise Scribd logo
1  sur  14
Maiko Yoshida


GOLD MEDAL HEIGHTS
The table below gives the height (in centimeters) achived by the gold medalists at various
Olympic Games.
Year     1932 1936 1948 1952 1956 1960 1964 1968 1972 1976 1980
Height 197      203     198    204     212    216     218     224    223     225    236
(cm)


Using technology, plot the data points on a graph. Define all variables used and state
any parameters clearly. Discuss any possible constraints of the task.
Note: The Olympic Games were not held in 1940 and 1944.


Year     8      9       12     13      14     15      16      17     18      19     20
Height 1.97     2.03    1.98   2.04    2.12   2.16    2.18    2.24   2.23    2.25   2.36
(cm)


X=1900+4x
Y=100y
Maiko Yoshida


If the numbers were big, a computational error would be big, as well. In order to avoid
this, and also to calculate easily, I scaled the numbers.
Year:      X=1900+4x
                     Ex. 1932=1900+4(8) x=8
Height:    Y=100y
                     Ex. 197=100(1.97) y=1.97


Parameters
y   ax 2 bx c


a represents a direction and how the graph opens
          For example, if a is positive value, it means the quadratic graph open to
          upward.
                                            b
the relationship between a and b is x
                                            2a
c represents y-intersect


Possible constraints are that X can only be 8,9,10,11,12,13,14,15,16,17,18,19,20.
y can only be positive real number.


What type of function models the behaviour of the graph? Explain why you chose
this function. Analytically create an equation to model the data in the above table.


The height once decreases but basically it increases, as years pass so I think quadratic
equation is the best fit. I picked three examples up to make a manual equation to model
the data. I used 1932, 1960 and 1980 because these are at the first year, last year and
middle year of the data so it can be said that these three points are typical of this graph.
For creating the equation, I used matrix.
First year (1932) 1.97=64a+8b+c
Middle year (1960) 2.16=225a+15b+c
Last year (1980) 2.36=400a+20b+c
Maiko Yoshida


 64     8    1   a      1.97
225    15 1      b = 2.16
400    20 1      c   2.38

y     0.0010714286 x 2 0.0025 x 1.881428571


On a new set of axes, draw your model function and the original graph. Comment
on any differences. Discuss the limitations of your model. Refine your model if
necessary.


My model function almost fits the original dots but some point such as x=12 or 13 do not
suit to the graph. In order to refine the graph, I focused on the turning point. In this graph,
there are 4 turning points. Therefore, I made quintic equation.
y     ax 5 bx 4 cx 3 dx 2 ex      f
Maiko Yoshida


This equation seems much better to fit the graph within x=8 to 20.


Use technology to find another function that models the data. On a new set of axes,
draw both your model functions. Comment on any differences.
I tried several equations by using logger-pro and checked the RMSE, which means Root
Mean Square Error. The smaller this value, the graph is much better fit.


y   ax 2 bx c
                Quadratic function RMSE=0.03868
Maiko Yoshida


y= a bx cx 2 dx 3
              Cubic function RMSE=0.03942


y   aln(bx)
              Natural log function RMSE=0.05681
Maiko Yoshida


y   alog(bx)
               Base-10 logarithm RMSE=0.05681


y   mx b
                Linear function RMSE=0.04523


Because RMSE of quadratic function is the smallest value, it can be said that quadratic
equation is the best fitted function.
Maiko Yoshida


The graph which shown above is the auto fit quadratic function


The graph which shown above is the manual quadratic function.
Maiko Yoshida


The graph which two graphs combined is shown below.


The RMSE of manual equation is 0.0480387.
The RMSE of auto fit equation is 0.03868.
Although there are some errors between manual equation and auto fit equation, it seems
almost same because two of RMSE are nearly same, as well.
Maiko Yoshida


Had the Games been held in 1940 and 1944, estimate what the winning heights
would have been and justify your answers.
Year: 1940
If I use the manual fit quadratic equation, the formula would be
1940 1900 4        x
x 10
y   0.00107 102 0.0025 10 1.881
y   2.013
Y   100 2.013 201.3
                                                                      A. 201.3 cm


If I use the auto fit quadratic equation, the formula would be
1940 1900 4        x
x 10
y   0.00181 102 0.0203 10 2.027
y   2.005
Y   100 2.005 200.5


                                                                       A. 200.5cm


Year: 1944
If I use the manual fit quadratic equation, the formula would be
1944 1900 4        x
x 11
y 0.00107 112 0.0025 10 1.881
y 2.035
Y 100 2.035 203.5


                                                                       A. 203.5cm
Maiko Yoshida


If I use the auto fit quadratic equation, the formula would be
1944 1900 4        x
x 11
y   0.00181 112 0.0203 11 2.027
y   2.02
Y   100 2.022 202.2
                                                                           A. 202.2cm


The answers are appropriate because the answers which I got are almost same value as the
graph above.


Use your model to predict the winning height in 1984 and in 2016. Comment on
your answers.


Year: 1984
If I use the manual fit quadratic equation, the formula would be
1984 1900 4        x
x 21
y   0.00107 212 0.0025 21 1.881
y   2.405
Y   100 2.405 240.5
                                                                            A. 240.5cm


If I use the auto fit quadratic equation, the formula would be
1984 1900 4        x
x 21
y 0.00181 212 0.0203 21 2.027
y 2.398
Y 100 2.398 239.8


                                                                            A. 239.8cm
Maiko Yoshida


       Year: 2016
       If I use the manual fit quadratic equation, the formula would be
       2016 1900 4             x
       x 29
       y     0.00107 292 0.0025 29 1.881
       y     2.853
       Y     100 2.853 285.3
                                                                                       A. 285.3cm


       If I use the auto fit quadratic equation, the formula would be
       2016 1900 4             x
       x 29
       y     0.00181 292 0.0203 29 2.027
       y     2.961
       Y     100 2.961 296.1
                                                                                   A. 296.1cm


       As year passes, the value of height is going to be unbelievable number because the human
       will never achieve 285 or 296.1cm. Therefore, the quadratic function gradually cannot be
       used as the year passes.


       The following table gives the winning heights for all the other Olympic Games since
       1986.
Year   1896 1904 1908 1912 1920 1928 1984 1988 1992 1996 2000 2004 2008
Height 190     180       191       193   193   194   235   238    234     239    235     236    236
(cm)
       I scaled again.
Maiko Yoshida


Year     -1    1        2    3      5     7      21     22     23    24     25     26        27
Height 1.90 1.80 1.91 1.93 1.93 1.94 2.35 2.38 2.34 2.39 2.35 2.36 2.36
(cm)


How well does your model fit the additional data?


As graph shows, the quadratic equation does not fit the dots very well. If I use the
quadratic equation, human can achieve 280cm in 2060. Obviously, human cannot jump
280cm so the equation which I used has restriction. Therefore, it can be said that this is
interpolated example.
Maiko Yoshida


Discuss the overall trend from 1896 to 2008, with specific references to significant
fluctuations.


At first, the slope of the graph seems constant except in 1904. However, from 1936 to
1980, the sloop becomes steep. Then, the slope seems to be constant again from 1980.
Maiko Yoshida


What modifications, if any, need to be made to your model to fit the new data?
The graph looks like arc tangent which function is constant at first, then becomes sharp
and be constant again. Because the ability of human’s jump does not increase forever, it
should be stable in the end. Therefore, I will use a   atan x b even though the value of
RMSE is big.

Contenu connexe

Tendances

Rigid-jointed_frame_analysis_1458662758
Rigid-jointed_frame_analysis_1458662758Rigid-jointed_frame_analysis_1458662758
Rigid-jointed_frame_analysis_1458662758GURUPRASADSHIKHARE2
 
Vector mechanics for engineers statics 7th chapter 5
Vector mechanics for engineers statics 7th chapter 5 Vector mechanics for engineers statics 7th chapter 5
Vector mechanics for engineers statics 7th chapter 5 Nahla Hazem
 
Linear regression
Linear regressionLinear regression
Linear regressionTech_MX
 
Math Section 2.1 ECC Etudes
Math Section 2.1 ECC EtudesMath Section 2.1 ECC Etudes
Math Section 2.1 ECC EtudesDavidYeeElCamino
 
15 regression basics
15 regression basics15 regression basics
15 regression basicsgaurav arora
 
Isometric drawings
Isometric drawingsIsometric drawings
Isometric drawingsdean dundas
 
Honors Part 2
Honors Part 2Honors Part 2
Honors Part 2sarahgib
 
3 d solid modeling
3 d solid modeling3 d solid modeling
3 d solid modelingmanuelhgomez
 
Graphs of linear equation
Graphs of linear equationGraphs of linear equation
Graphs of linear equationJunila Tejada
 

Tendances (10)

Rigid-jointed_frame_analysis_1458662758
Rigid-jointed_frame_analysis_1458662758Rigid-jointed_frame_analysis_1458662758
Rigid-jointed_frame_analysis_1458662758
 
Vector mechanics for engineers statics 7th chapter 5
Vector mechanics for engineers statics 7th chapter 5 Vector mechanics for engineers statics 7th chapter 5
Vector mechanics for engineers statics 7th chapter 5
 
Linear regression
Linear regressionLinear regression
Linear regression
 
Math Section 2.1 ECC Etudes
Math Section 2.1 ECC EtudesMath Section 2.1 ECC Etudes
Math Section 2.1 ECC Etudes
 
15 regression basics
15 regression basics15 regression basics
15 regression basics
 
Isometric drawings
Isometric drawingsIsometric drawings
Isometric drawings
 
Honors Part 2
Honors Part 2Honors Part 2
Honors Part 2
 
Shape
ShapeShape
Shape
 
3 d solid modeling
3 d solid modeling3 d solid modeling
3 d solid modeling
 
Graphs of linear equation
Graphs of linear equationGraphs of linear equation
Graphs of linear equation
 

En vedette (8)

Scatterbrain2
Scatterbrain2Scatterbrain2
Scatterbrain2
 
Light Pollution Analysis in Northern Illinois
Light Pollution Analysis in Northern IllinoisLight Pollution Analysis in Northern Illinois
Light Pollution Analysis in Northern Illinois
 
Final essay
Final essayFinal essay
Final essay
 
Politica tic
Politica ticPolitica tic
Politica tic
 
Catcher in the rye
Catcher in the ryeCatcher in the rye
Catcher in the rye
 
Bits & Pieces II
Bits & Pieces IIBits & Pieces II
Bits & Pieces II
 
IA Math
IA MathIA Math
IA Math
 
Tourism essay
Tourism essayTourism essay
Tourism essay
 

Similaire à Ia

Math IA
Math IAMath IA
Math IA_kong
 
Math ia 2
Math ia 2Math ia 2
Math ia 2NonnieZ
 
Statistics assignment and homework help service
Statistics assignment and homework help serviceStatistics assignment and homework help service
Statistics assignment and homework help serviceTutor Help Desk
 
Mathematics TAKS Exit Level Review
Mathematics TAKS Exit Level ReviewMathematics TAKS Exit Level Review
Mathematics TAKS Exit Level Reviewguest3f17823
 
The least square method
The least square methodThe least square method
The least square methodkevinlefol
 
Straight-Line-Equation..ppt
Straight-Line-Equation..pptStraight-Line-Equation..ppt
Straight-Line-Equation..pptsupreo
 
Linear programming graphical method
Linear programming graphical methodLinear programming graphical method
Linear programming graphical methodDr. Abdulfatah Salem
 
Straight line-equation.
Straight line-equation.Straight line-equation.
Straight line-equation.SajidPervez2
 
Solution of matlab chapter 3
Solution of matlab chapter 3Solution of matlab chapter 3
Solution of matlab chapter 3AhsanIrshad8
 
M210 Songyue.pages__MACOSX._M210 Songyue.pagesM210-S16-.docx
M210 Songyue.pages__MACOSX._M210 Songyue.pagesM210-S16-.docxM210 Songyue.pages__MACOSX._M210 Songyue.pagesM210-S16-.docx
M210 Songyue.pages__MACOSX._M210 Songyue.pagesM210-S16-.docxsmile790243
 
Sriram1000991882-Report-FractureMechanics
Sriram1000991882-Report-FractureMechanicsSriram1000991882-Report-FractureMechanics
Sriram1000991882-Report-FractureMechanicsSriram Sambasivam
 
Calculus II Project - The Glass
Calculus II Project - The GlassCalculus II Project - The Glass
Calculus II Project - The GlassRebeccaFenter
 
Quadratic graphs- features
Quadratic graphs- featuresQuadratic graphs- features
Quadratic graphs- featuresNadineThomas4
 
Shear Force Diagram and its exampls
Shear Force Diagram and its examplsShear Force Diagram and its exampls
Shear Force Diagram and its examplsJaydrath Sindhav
 

Similaire à Ia (16)

Math IA
Math IAMath IA
Math IA
 
Math ia 2
Math ia 2Math ia 2
Math ia 2
 
Statistics assignment and homework help service
Statistics assignment and homework help serviceStatistics assignment and homework help service
Statistics assignment and homework help service
 
Mathematics TAKS Exit Level Review
Mathematics TAKS Exit Level ReviewMathematics TAKS Exit Level Review
Mathematics TAKS Exit Level Review
 
The least square method
The least square methodThe least square method
The least square method
 
Section 1-6
Section 1-6Section 1-6
Section 1-6
 
Straight-Line-Equation..ppt
Straight-Line-Equation..pptStraight-Line-Equation..ppt
Straight-Line-Equation..ppt
 
Linear programming graphical method
Linear programming graphical methodLinear programming graphical method
Linear programming graphical method
 
Straight line-equation.
Straight line-equation.Straight line-equation.
Straight line-equation.
 
Solution of matlab chapter 3
Solution of matlab chapter 3Solution of matlab chapter 3
Solution of matlab chapter 3
 
M210 Songyue.pages__MACOSX._M210 Songyue.pagesM210-S16-.docx
M210 Songyue.pages__MACOSX._M210 Songyue.pagesM210-S16-.docxM210 Songyue.pages__MACOSX._M210 Songyue.pagesM210-S16-.docx
M210 Songyue.pages__MACOSX._M210 Songyue.pagesM210-S16-.docx
 
Presentation2 stats
Presentation2 statsPresentation2 stats
Presentation2 stats
 
Sriram1000991882-Report-FractureMechanics
Sriram1000991882-Report-FractureMechanicsSriram1000991882-Report-FractureMechanics
Sriram1000991882-Report-FractureMechanics
 
Calculus II Project - The Glass
Calculus II Project - The GlassCalculus II Project - The Glass
Calculus II Project - The Glass
 
Quadratic graphs- features
Quadratic graphs- featuresQuadratic graphs- features
Quadratic graphs- features
 
Shear Force Diagram and its exampls
Shear Force Diagram and its examplsShear Force Diagram and its exampls
Shear Force Diagram and its exampls
 

Plus de MaikoYoshida

Catcher in the rye
Catcher in the ryeCatcher in the rye
Catcher in the ryeMaikoYoshida
 
小学生に向けての原発のスピーチ
小学生に向けての原発のスピーチ小学生に向けての原発のスピーチ
小学生に向けての原発のスピーチMaikoYoshida
 

Plus de MaikoYoshida (7)

Catcher in the rye
Catcher in the ryeCatcher in the rye
Catcher in the rye
 
Rashomon essay
Rashomon essayRashomon essay
Rashomon essay
 
Landlord essay
Landlord essayLandlord essay
Landlord essay
 
Landlord essay
Landlord essayLandlord essay
Landlord essay
 
Equilibrium lab
Equilibrium labEquilibrium lab
Equilibrium lab
 
小学生に向けての原発のスピーチ
小学生に向けての原発のスピーチ小学生に向けての原発のスピーチ
小学生に向けての原発のスピーチ
 
Language CCI ppt
Language CCI pptLanguage CCI ppt
Language CCI ppt
 

Dernier

Partners Life - Insurer Innovation Award 2024
Partners Life - Insurer Innovation Award 2024Partners Life - Insurer Innovation Award 2024
Partners Life - Insurer Innovation Award 2024The Digital Insurer
 
Unblocking The Main Thread Solving ANRs and Frozen Frames
Unblocking The Main Thread Solving ANRs and Frozen FramesUnblocking The Main Thread Solving ANRs and Frozen Frames
Unblocking The Main Thread Solving ANRs and Frozen FramesSinan KOZAK
 
Salesforce Community Group Quito, Salesforce 101
Salesforce Community Group Quito, Salesforce 101Salesforce Community Group Quito, Salesforce 101
Salesforce Community Group Quito, Salesforce 101Paola De la Torre
 
Axa Assurance Maroc - Insurer Innovation Award 2024
Axa Assurance Maroc - Insurer Innovation Award 2024Axa Assurance Maroc - Insurer Innovation Award 2024
Axa Assurance Maroc - Insurer Innovation Award 2024The Digital Insurer
 
From Event to Action: Accelerate Your Decision Making with Real-Time Automation
From Event to Action: Accelerate Your Decision Making with Real-Time AutomationFrom Event to Action: Accelerate Your Decision Making with Real-Time Automation
From Event to Action: Accelerate Your Decision Making with Real-Time AutomationSafe Software
 
Exploring the Future Potential of AI-Enabled Smartphone Processors
Exploring the Future Potential of AI-Enabled Smartphone ProcessorsExploring the Future Potential of AI-Enabled Smartphone Processors
Exploring the Future Potential of AI-Enabled Smartphone Processorsdebabhi2
 
08448380779 Call Girls In Friends Colony Women Seeking Men
08448380779 Call Girls In Friends Colony Women Seeking Men08448380779 Call Girls In Friends Colony Women Seeking Men
08448380779 Call Girls In Friends Colony Women Seeking MenDelhi Call girls
 
Developing An App To Navigate The Roads of Brazil
Developing An App To Navigate The Roads of BrazilDeveloping An App To Navigate The Roads of Brazil
Developing An App To Navigate The Roads of BrazilV3cube
 
Presentation on how to chat with PDF using ChatGPT code interpreter
Presentation on how to chat with PDF using ChatGPT code interpreterPresentation on how to chat with PDF using ChatGPT code interpreter
Presentation on how to chat with PDF using ChatGPT code interpreternaman860154
 
Handwritten Text Recognition for manuscripts and early printed texts
Handwritten Text Recognition for manuscripts and early printed textsHandwritten Text Recognition for manuscripts and early printed texts
Handwritten Text Recognition for manuscripts and early printed textsMaria Levchenko
 
A Call to Action for Generative AI in 2024
A Call to Action for Generative AI in 2024A Call to Action for Generative AI in 2024
A Call to Action for Generative AI in 2024Results
 
A Domino Admins Adventures (Engage 2024)
A Domino Admins Adventures (Engage 2024)A Domino Admins Adventures (Engage 2024)
A Domino Admins Adventures (Engage 2024)Gabriella Davis
 
Data Cloud, More than a CDP by Matt Robison
Data Cloud, More than a CDP by Matt RobisonData Cloud, More than a CDP by Matt Robison
Data Cloud, More than a CDP by Matt RobisonAnna Loughnan Colquhoun
 
EIS-Webinar-Prompt-Knowledge-Eng-2024-04-08.pptx
EIS-Webinar-Prompt-Knowledge-Eng-2024-04-08.pptxEIS-Webinar-Prompt-Knowledge-Eng-2024-04-08.pptx
EIS-Webinar-Prompt-Knowledge-Eng-2024-04-08.pptxEarley Information Science
 
Tata AIG General Insurance Company - Insurer Innovation Award 2024
Tata AIG General Insurance Company - Insurer Innovation Award 2024Tata AIG General Insurance Company - Insurer Innovation Award 2024
Tata AIG General Insurance Company - Insurer Innovation Award 2024The Digital Insurer
 
The Codex of Business Writing Software for Real-World Solutions 2.pptx
The Codex of Business Writing Software for Real-World Solutions 2.pptxThe Codex of Business Writing Software for Real-World Solutions 2.pptx
The Codex of Business Writing Software for Real-World Solutions 2.pptxMalak Abu Hammad
 
The Role of Taxonomy and Ontology in Semantic Layers - Heather Hedden.pdf
The Role of Taxonomy and Ontology in Semantic Layers - Heather Hedden.pdfThe Role of Taxonomy and Ontology in Semantic Layers - Heather Hedden.pdf
The Role of Taxonomy and Ontology in Semantic Layers - Heather Hedden.pdfEnterprise Knowledge
 
Mastering MySQL Database Architecture: Deep Dive into MySQL Shell and MySQL R...
Mastering MySQL Database Architecture: Deep Dive into MySQL Shell and MySQL R...Mastering MySQL Database Architecture: Deep Dive into MySQL Shell and MySQL R...
Mastering MySQL Database Architecture: Deep Dive into MySQL Shell and MySQL R...Miguel Araújo
 
TrustArc Webinar - Stay Ahead of US State Data Privacy Law Developments
TrustArc Webinar - Stay Ahead of US State Data Privacy Law DevelopmentsTrustArc Webinar - Stay Ahead of US State Data Privacy Law Developments
TrustArc Webinar - Stay Ahead of US State Data Privacy Law DevelopmentsTrustArc
 
IAC 2024 - IA Fast Track to Search Focused AI Solutions
IAC 2024 - IA Fast Track to Search Focused AI SolutionsIAC 2024 - IA Fast Track to Search Focused AI Solutions
IAC 2024 - IA Fast Track to Search Focused AI SolutionsEnterprise Knowledge
 

Dernier (20)

Partners Life - Insurer Innovation Award 2024
Partners Life - Insurer Innovation Award 2024Partners Life - Insurer Innovation Award 2024
Partners Life - Insurer Innovation Award 2024
 
Unblocking The Main Thread Solving ANRs and Frozen Frames
Unblocking The Main Thread Solving ANRs and Frozen FramesUnblocking The Main Thread Solving ANRs and Frozen Frames
Unblocking The Main Thread Solving ANRs and Frozen Frames
 
Salesforce Community Group Quito, Salesforce 101
Salesforce Community Group Quito, Salesforce 101Salesforce Community Group Quito, Salesforce 101
Salesforce Community Group Quito, Salesforce 101
 
Axa Assurance Maroc - Insurer Innovation Award 2024
Axa Assurance Maroc - Insurer Innovation Award 2024Axa Assurance Maroc - Insurer Innovation Award 2024
Axa Assurance Maroc - Insurer Innovation Award 2024
 
From Event to Action: Accelerate Your Decision Making with Real-Time Automation
From Event to Action: Accelerate Your Decision Making with Real-Time AutomationFrom Event to Action: Accelerate Your Decision Making with Real-Time Automation
From Event to Action: Accelerate Your Decision Making with Real-Time Automation
 
Exploring the Future Potential of AI-Enabled Smartphone Processors
Exploring the Future Potential of AI-Enabled Smartphone ProcessorsExploring the Future Potential of AI-Enabled Smartphone Processors
Exploring the Future Potential of AI-Enabled Smartphone Processors
 
08448380779 Call Girls In Friends Colony Women Seeking Men
08448380779 Call Girls In Friends Colony Women Seeking Men08448380779 Call Girls In Friends Colony Women Seeking Men
08448380779 Call Girls In Friends Colony Women Seeking Men
 
Developing An App To Navigate The Roads of Brazil
Developing An App To Navigate The Roads of BrazilDeveloping An App To Navigate The Roads of Brazil
Developing An App To Navigate The Roads of Brazil
 
Presentation on how to chat with PDF using ChatGPT code interpreter
Presentation on how to chat with PDF using ChatGPT code interpreterPresentation on how to chat with PDF using ChatGPT code interpreter
Presentation on how to chat with PDF using ChatGPT code interpreter
 
Handwritten Text Recognition for manuscripts and early printed texts
Handwritten Text Recognition for manuscripts and early printed textsHandwritten Text Recognition for manuscripts and early printed texts
Handwritten Text Recognition for manuscripts and early printed texts
 
A Call to Action for Generative AI in 2024
A Call to Action for Generative AI in 2024A Call to Action for Generative AI in 2024
A Call to Action for Generative AI in 2024
 
A Domino Admins Adventures (Engage 2024)
A Domino Admins Adventures (Engage 2024)A Domino Admins Adventures (Engage 2024)
A Domino Admins Adventures (Engage 2024)
 
Data Cloud, More than a CDP by Matt Robison
Data Cloud, More than a CDP by Matt RobisonData Cloud, More than a CDP by Matt Robison
Data Cloud, More than a CDP by Matt Robison
 
EIS-Webinar-Prompt-Knowledge-Eng-2024-04-08.pptx
EIS-Webinar-Prompt-Knowledge-Eng-2024-04-08.pptxEIS-Webinar-Prompt-Knowledge-Eng-2024-04-08.pptx
EIS-Webinar-Prompt-Knowledge-Eng-2024-04-08.pptx
 
Tata AIG General Insurance Company - Insurer Innovation Award 2024
Tata AIG General Insurance Company - Insurer Innovation Award 2024Tata AIG General Insurance Company - Insurer Innovation Award 2024
Tata AIG General Insurance Company - Insurer Innovation Award 2024
 
The Codex of Business Writing Software for Real-World Solutions 2.pptx
The Codex of Business Writing Software for Real-World Solutions 2.pptxThe Codex of Business Writing Software for Real-World Solutions 2.pptx
The Codex of Business Writing Software for Real-World Solutions 2.pptx
 
The Role of Taxonomy and Ontology in Semantic Layers - Heather Hedden.pdf
The Role of Taxonomy and Ontology in Semantic Layers - Heather Hedden.pdfThe Role of Taxonomy and Ontology in Semantic Layers - Heather Hedden.pdf
The Role of Taxonomy and Ontology in Semantic Layers - Heather Hedden.pdf
 
Mastering MySQL Database Architecture: Deep Dive into MySQL Shell and MySQL R...
Mastering MySQL Database Architecture: Deep Dive into MySQL Shell and MySQL R...Mastering MySQL Database Architecture: Deep Dive into MySQL Shell and MySQL R...
Mastering MySQL Database Architecture: Deep Dive into MySQL Shell and MySQL R...
 
TrustArc Webinar - Stay Ahead of US State Data Privacy Law Developments
TrustArc Webinar - Stay Ahead of US State Data Privacy Law DevelopmentsTrustArc Webinar - Stay Ahead of US State Data Privacy Law Developments
TrustArc Webinar - Stay Ahead of US State Data Privacy Law Developments
 
IAC 2024 - IA Fast Track to Search Focused AI Solutions
IAC 2024 - IA Fast Track to Search Focused AI SolutionsIAC 2024 - IA Fast Track to Search Focused AI Solutions
IAC 2024 - IA Fast Track to Search Focused AI Solutions
 

Ia

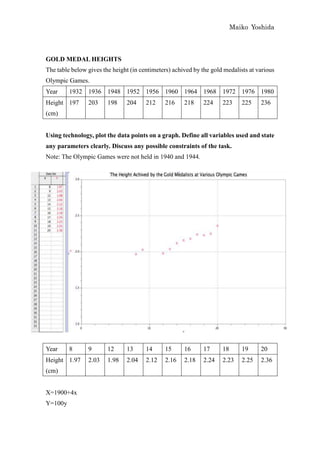
  • 1. Maiko Yoshida GOLD MEDAL HEIGHTS The table below gives the height (in centimeters) achived by the gold medalists at various Olympic Games. Year 1932 1936 1948 1952 1956 1960 1964 1968 1972 1976 1980 Height 197 203 198 204 212 216 218 224 223 225 236 (cm) Using technology, plot the data points on a graph. Define all variables used and state any parameters clearly. Discuss any possible constraints of the task. Note: The Olympic Games were not held in 1940 and 1944. Year 8 9 12 13 14 15 16 17 18 19 20 Height 1.97 2.03 1.98 2.04 2.12 2.16 2.18 2.24 2.23 2.25 2.36 (cm) X=1900+4x Y=100y
  • 2. Maiko Yoshida If the numbers were big, a computational error would be big, as well. In order to avoid this, and also to calculate easily, I scaled the numbers. Year: X=1900+4x Ex. 1932=1900+4(8) x=8 Height: Y=100y Ex. 197=100(1.97) y=1.97 Parameters y ax 2 bx c a represents a direction and how the graph opens For example, if a is positive value, it means the quadratic graph open to upward. b the relationship between a and b is x 2a c represents y-intersect Possible constraints are that X can only be 8,9,10,11,12,13,14,15,16,17,18,19,20. y can only be positive real number. What type of function models the behaviour of the graph? Explain why you chose this function. Analytically create an equation to model the data in the above table. The height once decreases but basically it increases, as years pass so I think quadratic equation is the best fit. I picked three examples up to make a manual equation to model the data. I used 1932, 1960 and 1980 because these are at the first year, last year and middle year of the data so it can be said that these three points are typical of this graph. For creating the equation, I used matrix. First year (1932) 1.97=64a+8b+c Middle year (1960) 2.16=225a+15b+c Last year (1980) 2.36=400a+20b+c
  • 3. Maiko Yoshida 64 8 1 a 1.97 225 15 1 b = 2.16 400 20 1 c 2.38 y 0.0010714286 x 2 0.0025 x 1.881428571 On a new set of axes, draw your model function and the original graph. Comment on any differences. Discuss the limitations of your model. Refine your model if necessary. My model function almost fits the original dots but some point such as x=12 or 13 do not suit to the graph. In order to refine the graph, I focused on the turning point. In this graph, there are 4 turning points. Therefore, I made quintic equation. y ax 5 bx 4 cx 3 dx 2 ex f
  • 4. Maiko Yoshida This equation seems much better to fit the graph within x=8 to 20. Use technology to find another function that models the data. On a new set of axes, draw both your model functions. Comment on any differences. I tried several equations by using logger-pro and checked the RMSE, which means Root Mean Square Error. The smaller this value, the graph is much better fit. y ax 2 bx c Quadratic function RMSE=0.03868
  • 5. Maiko Yoshida y= a bx cx 2 dx 3 Cubic function RMSE=0.03942 y aln(bx) Natural log function RMSE=0.05681
  • 6. Maiko Yoshida y alog(bx) Base-10 logarithm RMSE=0.05681 y mx b Linear function RMSE=0.04523 Because RMSE of quadratic function is the smallest value, it can be said that quadratic equation is the best fitted function.
  • 7. Maiko Yoshida The graph which shown above is the auto fit quadratic function The graph which shown above is the manual quadratic function.
  • 8. Maiko Yoshida The graph which two graphs combined is shown below. The RMSE of manual equation is 0.0480387. The RMSE of auto fit equation is 0.03868. Although there are some errors between manual equation and auto fit equation, it seems almost same because two of RMSE are nearly same, as well.
  • 9. Maiko Yoshida Had the Games been held in 1940 and 1944, estimate what the winning heights would have been and justify your answers. Year: 1940 If I use the manual fit quadratic equation, the formula would be 1940 1900 4 x x 10 y 0.00107 102 0.0025 10 1.881 y 2.013 Y 100 2.013 201.3 A. 201.3 cm If I use the auto fit quadratic equation, the formula would be 1940 1900 4 x x 10 y 0.00181 102 0.0203 10 2.027 y 2.005 Y 100 2.005 200.5 A. 200.5cm Year: 1944 If I use the manual fit quadratic equation, the formula would be 1944 1900 4 x x 11 y 0.00107 112 0.0025 10 1.881 y 2.035 Y 100 2.035 203.5 A. 203.5cm
  • 10. Maiko Yoshida If I use the auto fit quadratic equation, the formula would be 1944 1900 4 x x 11 y 0.00181 112 0.0203 11 2.027 y 2.02 Y 100 2.022 202.2 A. 202.2cm The answers are appropriate because the answers which I got are almost same value as the graph above. Use your model to predict the winning height in 1984 and in 2016. Comment on your answers. Year: 1984 If I use the manual fit quadratic equation, the formula would be 1984 1900 4 x x 21 y 0.00107 212 0.0025 21 1.881 y 2.405 Y 100 2.405 240.5 A. 240.5cm If I use the auto fit quadratic equation, the formula would be 1984 1900 4 x x 21 y 0.00181 212 0.0203 21 2.027 y 2.398 Y 100 2.398 239.8 A. 239.8cm
  • 11. Maiko Yoshida Year: 2016 If I use the manual fit quadratic equation, the formula would be 2016 1900 4 x x 29 y 0.00107 292 0.0025 29 1.881 y 2.853 Y 100 2.853 285.3 A. 285.3cm If I use the auto fit quadratic equation, the formula would be 2016 1900 4 x x 29 y 0.00181 292 0.0203 29 2.027 y 2.961 Y 100 2.961 296.1 A. 296.1cm As year passes, the value of height is going to be unbelievable number because the human will never achieve 285 or 296.1cm. Therefore, the quadratic function gradually cannot be used as the year passes. The following table gives the winning heights for all the other Olympic Games since 1986. Year 1896 1904 1908 1912 1920 1928 1984 1988 1992 1996 2000 2004 2008 Height 190 180 191 193 193 194 235 238 234 239 235 236 236 (cm) I scaled again.
  • 12. Maiko Yoshida Year -1 1 2 3 5 7 21 22 23 24 25 26 27 Height 1.90 1.80 1.91 1.93 1.93 1.94 2.35 2.38 2.34 2.39 2.35 2.36 2.36 (cm) How well does your model fit the additional data? As graph shows, the quadratic equation does not fit the dots very well. If I use the quadratic equation, human can achieve 280cm in 2060. Obviously, human cannot jump 280cm so the equation which I used has restriction. Therefore, it can be said that this is interpolated example.
  • 13. Maiko Yoshida Discuss the overall trend from 1896 to 2008, with specific references to significant fluctuations. At first, the slope of the graph seems constant except in 1904. However, from 1936 to 1980, the sloop becomes steep. Then, the slope seems to be constant again from 1980.
  • 14. Maiko Yoshida What modifications, if any, need to be made to your model to fit the new data? The graph looks like arc tangent which function is constant at first, then becomes sharp and be constant again. Because the ability of human’s jump does not increase forever, it should be stable in the end. Therefore, I will use a atan x b even though the value of RMSE is big.