EIA Drilling Productivity Report - Mar 2015
•
0 j'aime•642 vues

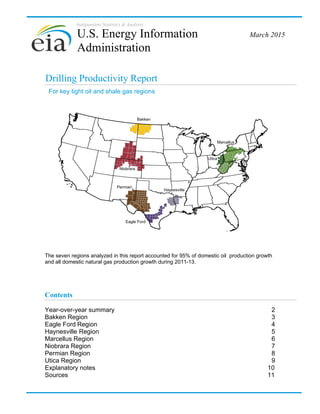
The monthly report from the U.S. Energy Information Administration showing production of oil and gas broken out by the 7 major commercially active shale plays in the U.S.

Recommandé
Recommandé
Contenu connexe
Tendances
Tendances (19)
Similaire à EIA Drilling Productivity Report - Mar 2015
Similaire à EIA Drilling Productivity Report - Mar 2015 (12)
Plus de Marcellus Drilling News
Plus de Marcellus Drilling News (20)
Dernier
Dernier (8)
EIA Drilling Productivity Report - Mar 2015
- 1. Independent Statistics & Analysis Drilling Productivity Report The seven regions analyzed in this report accounted for 95% of domestic oil production growth and all domestic natural gas production growth during 2011-13. March 2015 For key tight oil and shale gas regions U.S. Energy Information Administration Contents Year-over-year summary 2 Bakken Region 3 Eagle Ford Region 4 Haynesville Region 5 Marcellus Region 6 Niobrara Region 7 Permian Region 8 Utica Region 9 Explanatory notes 10 Sources 11 Bakken Marcellus Niobrara Haynesville Eagle Ford Permian Utica
- 2. U. S. Energy Information Administration | Drilling Productivity Report 0 400 800 1,200 1,600 2,000 2,400 2,800 Bakken Eagle Ford Haynesville Marcellus Niobrara Permian Utica April-2014 April-2015 Oil production thousand barrels/day 0 3,000 6,000 9,000 12,000 15,000 18,000 Bakken Eagle Ford Haynesville Marcellus Niobrara Permian Utica April-2014 April-2015 Natural gas production million cubic feet/day 0 250 500 750 1,000 1,250 1,500 Bakken Eagle Ford Haynesville Marcellus Niobrara Permian Utica April-2014 April-2015 New-well oil production per rig barrels/day 0 1,000 2,000 3,000 4,000 5,000 6,000 7,000 8,000 9,000 Bakken Eagle Ford Haynesville Marcellus Niobrara Permian Utica April-2014 April-2015 New-well gas production per rig thousand cubic feet/day (700) (600) (500) (400) (300) (200) (100) 0 Bakken Eagle Ford Haynesville Marcellus Niobrara Permian Utica April-2014 April-2015 Legacy gas production change million cubic feet/day (150) (125) (100) (75) (50) (25) 0 Bakken Eagle Ford Haynesville Marcellus Niobrara Permian Utica April-2014 April-2015 Legacy oil production change thousand barrels/day drilling data through February projected production through April March 2015 Drilling Productivity Report Year-over-year summary -20 -10 0 10 20 30 40 50 60 70 80 90 Bakken Eagle Ford Haynesville Marcellus Niobrara Permian Utica April-2014 April-2015 thousand barrels/day Indicated monthly change in oil production (Apr vs. Mar) -100 -50 0 50 100 150 200 250 300 Bakken Eagle Ford Haynesville Marcellus Niobrara Permian Utica April-2014 April-2015 million cubic feet/day Indicated monthly change in gas production (Apr vs. Mar) 2
- 3. U. S. Energy Information Administration | Drilling Productivity Report 0 200 400 600 800 1,000 1,200 1,400 2007 2008 2009 2010 2011 2012 2013 2014 2015 Oil production thousand barrels/day Bakken Region -50 0 50 100 Mar 1,328 Mbbl/d Production from new wells Legacy production change Net change Apr 1,320 Mbbl/d thousand barrels/day Bakken Region +72 -80 -8 Indicated change in oil production (Apr vs. Mar) -50 0 50 100 Mar 1,557 MMcf/d Production from new wells Legacy production change Net change Apr 1,549 MMcf/d Indicated change in natural gas production (Apr vs. Mar) million cubic feet/day Bakken Region +73 -81 -8 0 50 100 150 200 250 0 100 200 300 400 500 600 2007 2008 2009 2010 2011 2012 2013 2014 2015 new-well oil production per rig rig count New-well oil production per rig barrels/day Bakken Region Rig count rigs (90) (80) (70) (60) (50) (40) (30) (20) (10) 0 2007 2008 2009 2010 2011 2012 2013 2014 2015 Legacy oil production change thousand barrels/day Bakken Region (90) (80) (70) (60) (50) (40) (30) (20) (10) 0 2007 2008 2009 2010 2011 2012 2013 2014 2015 Legacy gas production change million cubic feet/day Bakken RegionBakken Region 0 1,000 2,000 3,000 4,000 5,000 6,000 7,000 2007 2008 2009 2010 2011 2012 2013 2014 2015 Bakken Region Natural gas production million cubic feet/day 0 50 100 150 200 250 0 600 1,200 1,800 2,400 3,000 3,600 2007 2008 2009 2010 2011 2012 2013 2014 2015 new-well gas production per rig rig count New-well gas production per rig thousand cubic feet/day Bakken Region Rig count rigs drilling data through February projected production through April March 2015 Drilling Productivity Report Monthly additions from one average rig April barrels/day March barrels/day month over month Oil +15 Gas thousand cubic feet/day month over month +11 Bakken Region million cubic feet/day month over month 595April thousand cubic feet/day March 584 592 577 thousand barrels/day month over month Oil -8 Gas -8 3
- 4. U. S. Energy Information Administration | Drilling Productivity Report 0 300 600 900 1,200 1,500 1,800 2007 2008 2009 2010 2011 2012 2013 2014 2015 Oil production thousand barrels/day Eagle Ford Region -50 0 50 100 150 200 Mar 1,733 Mbbl/d Production from new wells Legacy production change Net change Apr 1,723 Mbbl/d thousand barrels/day Eagle Ford Region +131 -141 -10 Indicated change in oil production (Apr vs. Mar) 0 100 200 300 400 Mar 7,518 MMcf/d Production from new wells Legacy production change Net change Apr 7,532 MMcf/d Indicated change in natural gas production (Apr vs. Mar) million cubic feet/day Eagle Ford Region +332 -318 +14 0 50 100 150 200 250 300 350 0 100 200 300 400 500 600 700 2007 2008 2009 2010 2011 2012 2013 2014 2015 new-well oil production per rig rig count New-well oil production per rig barrels/day Eagle Ford Region Rig count rigs (160) (140) (120) (100) (80) (60) (40) (20) 0 2007 2008 2009 2010 2011 2012 2013 2014 2015 Legacy oil production change thousand barrels/day Eagle Ford Region (350) (300) (250) (200) (150) (100) (50) 0 2007 2008 2009 2010 2011 2012 2013 2014 2015 Legacy gas production change million cubic feet/day Eagle Ford RegionEagle Ford Region 0 2,000 4,000 6,000 8,000 10,000 2007 2008 2009 2010 2011 2012 2013 2014 2015 Eagle Ford Region Natural gas production million cubic feet/day 0 50 100 150 200 250 300 350 0 600 1,200 1,800 2,400 3,000 3,600 4,200 2007 2008 2009 2010 2011 2012 2013 2014 2015 new-well gas production per rig rig count New-well gas production per rig thousand cubic feet/day Eagle Ford Region Rig count rigs drilling data through February projected production through April March 2015 Drilling Productivity Report Monthly additions from one average rig April barrels/day March barrels/day month over month Oil +20 Gas thousand cubic feet/day month over month +20 Eagle Ford Region million cubic feet/day month over month 1,732April thousand cubic feet/day March 1,712 680 660 thousand barrels/day month over month Oil -10 Gas +14 4
- 5. U. S. Energy Information Administration | Drilling Productivity Report barrels/day 0 400 800 1,200 1,600 2,000 2007 2008 2009 2010 2011 2012 2013 2014 2015 Oil production thousand barrels/day Haynesville Region 0.0 1.0 2.0 Mar 57 Mbbl/d Production from new wells Legacy production change Net change Apr 57 Mbbl/d thousand barrels/day Haynesville Region +1 -1 +0 Indicated change in oil production (Apr vs. Mar) -150 -50 50 150 250 350 Mar 7,055 MMcf/d Production from new wells Legacy production change Net change Apr 7,135 MMcf/d Indicated change in natural gas production (Apr vs. Mar) million cubic feet/day Haynesville Region +293 -213 +80 0 50 100 150 200 250 300 0 200 400 600 800 1,000 2007 2008 2009 2010 2011 2012 2013 2014 2015 new-well oil production per rig rig count New-well oil production per rig barrels/day Haynesville Region Rig count rigs (3) (2) (1) 0 2007 2008 2009 2010 2011 2012 2013 2014 2015 Legacy oil production change thousand barrels/day Haynesville Region (600) (500) (400) (300) (200) (100) 0 2007 2008 2009 2010 2011 2012 2013 2014 2015 Legacy gas production change million cubic feet/day Haynesville RegionHaynesville Region 0 2,000 4,000 6,000 8,000 10,000 12,000 2007 2008 2009 2010 2011 2012 2013 2014 2015 Haynesville Region Natural gas production million cubic feet/day 0 50 100 150 200 250 300 0 1,000 2,000 3,000 4,000 5,000 6,000 7,000 2007 2008 2009 2010 2011 2012 2013 2014 2015 new-well gas production per rig rig count New-well gas production per rig thousand cubic feet/day Haynesville Region Rig count rigs drilling data through February projected production through April March 2015 Drilling Productivity Report Monthly additions from one average rig April March barrels/day month over month Oil 0 Gas thousand cubic feet/day month over month +111 Haynesville Region million cubic feet/day month over month 5,955April thousand cubic feet/day March 5,844 24 24 thousand barrels/day month over month Oil +0 Gas +80 5
- 6. U. S. Energy Information Administration | Drilling Productivity Report Marcellus Region 0 500 1,000 1,500 2,000 2,500 3,000 2007 2008 2009 2010 2011 2012 2013 2014 2015 Oil production thousand barrels/day Marcellus Region 0.0 1.0 2.0 3.0 4.0 Mar 57 Mbbl/d Production from new wells Legacy production change Net change Apr 57 Mbbl/d thousand barrels/day Marcellus Region +3 -3 +0 Indicated change in oil production (Apr vs. Mar) 0 200 400 600 800 1,000 Mar 16,712 MMcf/d Production from new wells Legacy production change Net change Apr 16,787 MMcf/d Indicated change in natural gas production (Apr vs. Mar) million cubic feet/day Marcellus Region +709 -634 +75 0 30 60 90 120 150 0 300 600 900 1,200 1,500 2007 2008 2009 2010 2011 2012 2013 2014 2015 new-well oil production per rig rig count New-well oil production per rig barrels/day Marcellus Region Rig count rigs (3) (2) (1) 0 2007 2008 2009 2010 2011 2012 2013 2014 2015 Legacy oil production change thousand barrels/day Marcellus Region (700) (600) (500) (400) (300) (200) (100) 0 2007 2008 2009 2010 2011 2012 2013 2014 2015 Legacy gas production change million cubic feet/day Marcellus RegionMarcellus Region 0 2,000 4,000 6,000 8,000 10,000 12,000 14,000 16,000 18,000 2007 2008 2009 2010 2011 2012 2013 2014 2015 Marcellus Region Natural gas production million cubic feet/day 0 30 60 90 120 150 0 1,500 3,000 4,500 6,000 7,500 9,000 2007 2008 2009 2010 2011 2012 2013 2014 2015 new-well gas production per rig rig count New-well gas production per rig thousand cubic feet/day Marcellus Region Rig count rigs drilling data through February projected production through April March 2015 Drilling Productivity Report Monthly additions from one average rig April barrels/day March barrels/day month over month Oil 0 Gas thousand cubic feet/day month over month +47 million cubic feet/day month over month 8,130April thousand cubic feet/day March 8,083 36 36 thousand barrels/day month over month Oil +0 Gas +75 6
- 7. U. S. Energy Information Administration | Drilling Productivity Report 0 200 400 600 800 1,000 2007 2008 2009 2010 2011 2012 2013 2014 2015 Oil production thousand barrels/day Niobrara Region -10 0 10 20 30 40 50 Mar 418 Mbbl/d Production from new wells Legacy production change Net change Apr 413 Mbbl/d thousand barrels/day Niobrara Region +34 -39 -5 Indicated change in oil production (Apr vs. Mar) -50 0 50 100 150 200 Mar 4,767 MMcf/d Production from new wells Legacy production change Net change Apr 4,752 MMcf/d Indicated change in natural gas production (Apr vs. Mar) million cubic feet/day Niobrara Region +142 -157 -15 0 20 40 60 80 100 120 140 0 100 200 300 400 500 600 2007 2008 2009 2010 2011 2012 2013 2014 2015 new-well oil production per rig rig count New-well oil production per rig barrels/day Niobrara Region Rig count rigs (45) (40) (35) (30) (25) (20) (15) (10) (5) 0 2007 2008 2009 2010 2011 2012 2013 2014 2015 Legacy oil production change thousand barrels/day Niobrara Region (180) (160) (140) (120) (100) (80) (60) (40) (20) 0 2007 2008 2009 2010 2011 2012 2013 2014 2015 Legacy gas production change million cubic feet/day Niobrara RegionNiobrara Region 0 1,000 2,000 3,000 4,000 5,000 6,000 2007 2008 2009 2010 2011 2012 2013 2014 2015 Niobrara Region Natural gas production million cubic feet/day 0 20 40 60 80 100 120 140 0 600 1,200 1,800 2,400 3,000 3,600 2007 2008 2009 2010 2011 2012 2013 2014 2015 new-well gas production per rig rig count New-well gas production per rig thousand cubic feet/day Niobrara Region Rig count rigs drilling data through February projected production through April March 2015 Drilling Productivity Report Monthly additions from one average rig April barrels/day March barrels/day month over month Oil +23 Gas thousand cubic feet/day month over month +25 Niobrara Region million cubic feet/day month over month 1,906April thousand cubic feet/day March 1,881 455 432 thousand barrels/day month over month Oil -5 Gas -15 7
- 8. U. S. Energy Information Administration | Drilling Productivity Report 0 200 400 600 800 1,000 1,200 1,400 1,600 1,800 2,000 2,200 2007 2008 2009 2010 2011 2012 2013 2014 2015 Oil production thousand barrels/day Permian Region 0 25 50 75 100 125 Mar 1,961 Mbbl/d Production from new wells Legacy production change Net change Apr 1,982 Mbbl/d thousand barrels/day Permian Region +90 -69 +21 Indicated change in oil production (Apr vs. Mar) 0 50 100 150 200 250 Mar 6,403 MMcf/d Production from new wells Legacy production change Net change Apr 6,428 MMcf/d Indicated change in natural gas production (Apr vs. Mar) million cubic feet/day Permian Region +172 -147 +25 0 100 200 300 400 500 600 0 50 100 150 200 250 300 2007 2008 2009 2010 2011 2012 2013 2014 2015 new-well oil production per rig rig count New-well oil production per rig barrels/day Permian Region Rig count rigs (80) (70) (60) (50) (40) (30) (20) (10) 0 2007 2008 2009 2010 2011 2012 2013 2014 2015 Legacy oil production change thousand barrels/day Permian Region (160) (140) (120) (100) (80) (60) (40) (20) 0 2007 2008 2009 2010 2011 2012 2013 2014 2015 Legacy gas production change million cubic feet/day Permian RegionPermian Region 0 2,000 4,000 6,000 8,000 10,000 12,000 2007 2008 2009 2010 2011 2012 2013 2014 2015 Permian Region Natural gas production million cubic feet/day 0 100 200 300 400 500 600 0 300 600 900 1,200 1,500 1,800 2007 2008 2009 2010 2011 2012 2013 2014 2015 new-well gas production per rig rig count New-well gas production per rig thousand cubic feet/day Permian Region Rig count rigs drilling data through February projected production through April March 2015 Drilling Productivity Report Monthly additions from one average rig April barrels/day March barrels/day month over month Oil +38 Gas thousand cubic feet/day month over month +57 Permian Region million cubic feet/day month over month 459April thousand cubic feet/day March 402 240 202 thousand barrels/day month over month Oil +21 Gas +25 8
- 9. U. S. Energy Information Administration | Drilling Productivity Report Utica Region 0 50 100 150 200 250 2007 2008 2009 2010 2011 2012 2013 2014 2015 Oil production thousand barrels/day Utica Region 0.0 2.0 4.0 6.0 Mar 59 Mbbl/d Production from new wells Legacy production change Net change Apr 62 Mbbl/d thousand barrels/day Utica Region +5 -2 +3 Indicated change in oil production (Apr vs. Mar) 0 50 100 150 Mar 1,920 MMcf/d Production from new wells Legacy production change Net change Apr 1,970 MMcf/d Indicated change in natural gas production (Apr vs. Mar) million cubic feet/day Utica Region +101 -51 +50 0 5 10 15 20 25 30 35 0 200 400 600 800 2007 2008 2009 2010 2011 2012 2013 2014 2015 new-well oil production per rig rig count New-well oil production per rig barrels/day Utica Region Rig count rigs (3) (2) (1) 0 2007 2008 2009 2010 2011 2012 2013 2014 2015 Legacy oil production change thousand barrels/day Utica Region (50) (40) (30) (20) (10) 0 10 2007 2008 2009 2010 2011 2012 2013 2014 2015 Legacy gas production change million cubic feet/day Utica RegionUtica Region 0 500 1,000 1,500 2,000 2,500 2007 2008 2009 2010 2011 2012 2013 2014 2015 Utica Region Natural gas production million cubic feet/day 0 5 10 15 20 25 30 35 0 1,200 2,400 3,600 4,800 2007 2008 2009 2010 2011 2012 2013 2014 2015 new-well gas production per rig rig count New-well gas production per rig thousand cubic feet/day Utica Region Rig count rigs drilling data through February projected production through April March 2015 Drilling Productivity Report Monthly additions from one average rig April barrels/day March barrels/day month over month Oil +9 Gas thousand cubic feet/day month over month +135 million cubic feet/day month over month 4,738April thousand cubic feet/day March 4,603 234 225 thousand barrels/day month over month Oil +3 Gas +50 9
- 10. U. S. Energy Information Administration | Drilling Productivity Report March 2015Explanatory notes Drilling Productivity Report The Drilling Productivity Report uses recent data on the total number of drilling rigs in operation along with estimates of drilling productivity and estimated changes in production from existing oil and natural gas wells to provide estimated changes in oil1 and natural gas2 production for seven key regions. EIA’s approach does not distinguish between oil-directed rigs and gas-directed rigs because once a well is completed it may produce both oil and gas; more than half of the wells do that. Monthly additions from one average rig Monthly additions from one average rig represent EIA’s estimate of an average rig’s3 contribution to production of oil and natural gas from new wells.4 The estimation of new-well production per rig uses several months of recent historical data on total production from new wells for each field divided by the region's monthly rig count, lagged by two months.5 Current- and next-month values are listed on the top header. The month-over-month change is listed alongside, with +/- signs and color-coded arrows to highlight the growth or decline in oil (brown) or natural gas (blue). New-well oil/gas production per rig Charts present historical estimated monthly additions from one average rig coupled with the number of total drilling rigs as reported by Baker Hughes. Legacy oil and natural gas production change Charts present EIA’s estimates of total oil and gas production changes from all the wells other than the new wells. The trend is dominated by the well depletion rates, but other circumstances can influence the direction of the change. For example, well freeze-offs or hurricanes can cause production to significantly decline in any given month, resulting in a production increase the next month when production simply returns to normal levels. Projected change in monthly oil/gas production Charts present the combined effects of new-well production and changes to legacy production. Total new-well production is offset by the anticipated change in legacy production to derive the net change in production. The estimated change in production does not reflect external circumstances that can affect the actual rates, such as infrastructure constraints, bad weather, or shut-ins based on environmental or economic issues. Oil/gas production Charts present all oil and natural gas production from both new and legacy wells since 2007. This production is based on all wells reported to the state oil and gas agencies. Where state data are not immediately available, EIA estimates the production based on estimated changes in new-well oil/gas production and the corresponding legacy change. Footnotes: 1. Oil production represents both crude and condensate production from all formations in the region. Production is not limited to tight formations. The regions are defined by all selected counties, which include areas outside of tight oil formations. 2. Gas production represents gross (before processing) gas production from all formations in the region. Production is not limited to shale formations. The regions are defined by all selected counties, which include areas outside of shale formations. 3. The monthly average rig count used in this report is calculated from weekly data on total oil and gas rigs reported by Baker Hughes. 4. A new well is defined as one that began producing for the first time in the previous month. Each well belongs to the new-well category for only one month. Reworked and recompleted wells are excluded from the calculation. 5. Rig count data lag production data because EIA has observed that the best predictor of the number of new wells beginning production in a given month is the count of rigs in operation two months earlier. 10
- 11. U. S. Energy Information Administration | Drilling Productivity Report March 2015Sources Drilling Productivity Report The data used in the preparation of this report come from the following sources. EIA is solely responsible for the analysis, calculations, and conclusions. Drilling Info (http://www.drillinginfo.com) Source of production, permit, and spud data for counties associated with this report. Source of real-time rig location to estimate new wells spudded and completed throughout the United States. Baker Hughes (http://www.bakerhughes.com) Source of rig and well counts by county, state, and basin. North Dakota Oil and Gas Division (https://www.dmr.nd.gov/oilgas) Source of well production, permit, and completion data in the counties associated with this report in North Dakota Railroad Commission of Texas (http://www.rrc.state.tx.us) Source of well production, permit, and completion data in the counties associated with this report in Texas Pennsylvania Department of Environmental Protection (https://www.paoilandgasreporting.state.pa.us/publicreports/Modules/Welcome/Welcome.aspx) Source of well production, permit, and completion data in the counties associated with this report in Pennsylvania West Virginia Department of Environmental Protection (http://www.dep.wv.gov/oil-and- gas/Pages/default.aspx) Source of well production, permit, and completion data in the counties associated with this report in West Virginia Colorado Oil and Gas Conservation Commission (http://cogcc.state.co.us) Source of well production, permit, and completion data in the counties associated with this report in Colorado Wyoming Oil and Conservation Commission (http://wogcc.state.wy.us) Source of well production, permit, and completion data in the counties associated with this report in Wyoming Louisiana Department of Natural Resources (http://dnr.louisiana.gov) Source of well production, permit, and completion data in the counties associated with this report in Louisiana Ohio Department of Natural Resources (http://oilandgas.ohiodnr.gov) Source of well production, permit, and completion data in the counties associated with this report in Ohio 11