PA Independent Fiscal Office Research Brief on Marcellus Taxation
•
1 like•510 views

A pathetic attempt to justify a huge tax increase on Marcellus drillers in Pennsylvania by the partisan (and taxpayer funded) organization called the Independent Fiscal Office. According to their "analysis" PA drillers paid an effective tax rate of 5.3% in 2010 and today pay an effective rate of 2.1%, which is horse manure.

Recommended
Recommended
More Related Content
What's hot
What's hot (20)
Viewers also liked
Viewers also liked (17)
Similar to PA Independent Fiscal Office Research Brief on Marcellus Taxation
Similar to PA Independent Fiscal Office Research Brief on Marcellus Taxation (20)
More from Marcellus Drilling News
More from Marcellus Drilling News (20)
Recently uploaded
Recently uploaded (20)
PA Independent Fiscal Office Research Brief on Marcellus Taxation
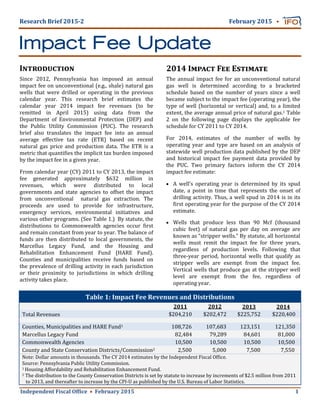
- 1. Independent Fiscal Of ice February 2015 1 Research Brief 2015‐2 February 2015 Impact Fee Update Since 2012, Pennsylvania has imposed an annual impact fee on unconventional (e.g., shale) natural gas wells that were drilled or operating in the previous calendar year. This research brief estimates the calendar year 2014 impact fee revenues (to be remitted in April 2015) using data from the Department of Environmental Protection (DEP) and the Public Utility Commission (PUC). The research brief also translates the impact fee into an annual average effective tax rate (ETR) based on recent natural gas price and production data. The ETR is a metric that quanti ies the implicit tax burden imposed by the impact fee in a given year. From calendar year (CY) 2011 to CY 2013, the impact fee generated approximately $632 million in revenues, which were distributed to local governments and state agencies to offset the impact from unconventional natural gas extraction. The proceeds are used to provide for infrastructure, emergency services, environmental initiatives and various other programs. (See Table 1.) By statute, the distributions to Commonwealth agencies occur irst and remain constant from year to year. The balance of funds are then distributed to local governments, the Marcellus Legacy Fund, and the Housing and Rehabilitation Enhancement Fund (HARE Fund). Counties and municipalities receive funds based on the prevalence of drilling activity in each jurisdiction or their proximity to jurisdictions in which drilling activity takes place. I Table 1: Impact Fee Revenues and Distributions 2011 2012 2013 2014 Total Revenues $204,210 $202,472 $225,752 $220,400 Counties, Municipalities and HARE Fund1 108,726 107,683 123,151 121,350 Marcellus Legacy Fund 82,484 79,289 84,601 81,000 Commonwealth Agencies 10,500 10,500 10,500 10,500 County and State Conservation Districts/Commission2 2,500 5,000 7,500 7,550 Note: Dollar amounts in thousands. The CY 2014 estimates by the Independent Fiscal Of ice. Source: Pennsylvania Public Utility Commission. 1 Housing Affordability and Rehabilitation Enhancement Fund. 2 The distribution to the County Conservation Districts is set by statute to increase by increments of $2.5 million from 2011 to 2013, and thereafter to increase by the CPI‐U as published by the U.S. Bureau of Labor Statistics. 2014 I F E The annual impact fee for an unconventional natural gas well is determined according to a bracketed schedule based on the number of years since a well became subject to the impact fee (operating year), the type of well (horizontal or vertical) and, to a limited extent, the average annual price of natural gas.1 Table 2 on the following page displays the applicable fee schedule for CY 2011 to CY 2014. For 2014, estimates of the number of wells by operating year and type are based on an analysis of statewide well production data published by the DEP and historical impact fee payment data provided by the PUC. Two primary factors inform the CY 2014 impact fee estimate: A well’s operating year is determined by its spud date, a point in time that represents the onset of drilling activity. Thus, a well spud in 2014 is in its irst operating year for the purpose of the CY 2014 estimate. Wells that produce less than 90 Mcf (thousand cubic feet) of natural gas per day on average are known as “stripper wells.” By statute, all horizontal wells must remit the impact fee for three years, regardless of production levels. Following that three‐year period, horizontal wells that qualify as stripper wells are exempt from the impact fee. Vertical wells that produce gas at the stripper well level are exempt from the fee, regardless of operating year.
- 2. Independent Fiscal Of ice February 2015 2 Based on the analysis, the following well counts were used to inform the CY 2014 impact fee estimate:2 1,360 new wells (in operating year 1); 5,909 existing wells (1,199 in operating year 2, 1,282 in year 3 and 3,428 in year 4); and 1,093 stripper wells that are not subject to the impact fee (not shown in Figure 1). This includes horizontal stripper wells in their fourth operating year and vertical stripper wells. Without the exemption for horizontal stripper wells, the number of wells in their fourth operating year in 2014 would be considerably higher than the 3,428 wells cited in the above bullet. The CY 2014 impact fee estimate is $220.4 million, which is based on the published fee schedule and the estimated well counts listed in Figure 1. The CY 2014 impact fee differs from previous years in two respects. First, 2014 was the first year that the number of unconventional wells spud in Pennsylvania exceeded the number spud in the prior year. Due to that outcome, the statute requires the PUC to apply a regional inflation adjustment to the fee schedule. The inflation adjustment will increase collections by an estimated $1.2 million. Second, 2014 was the first year in which horizontal stripper wells were eligible for an exemption after paying the fee for three years (i.e., in their fourth operating year). The horizontal stripper well exemption will decrease collections by an estimated $8.7 million. Table 2: Impact Fee Schedule for Horizontal Wells1 Operating Year CY 2011 CY 20122 CY 2013 CY 20143 1 $50,000 $45,000 $50,000 $50,300 2 ‐ 35,000 40,000 40,200 3 ‐ ‐ 30,000 30,200 4 ‐ ‐ ‐ 20,100 Source: Pennsylvania Public Utility Commission. 1 Vertical wells are subject to 20 percent of the fee levied on horizontal wells. 2 The fees for CY 2012 are lower than the fees for other years because the annual average price of natural gas on the New York Mercantile Exchange ($2.78 per MMbtu) dropped below the $3.00 per MMbtu threshold established in statute. 3 Includes a regional in lationary adjustment of 0.6% as reported by the Pennsylvania Public Utility Commission. Source: Pennsylvania Public Utility Commission and Pennsylvania Department of Environmental Protection. The CY 2014 estimate by the Independent Fiscal Of ice. 1 New wells are wells spud in the corresponding year that remit the impact fee. Existing wells are wells spud in prior years that remit the impact fee. 2 The irst year of the impact fee was 2011. All wells in that year were classi ied as new, regardless of spud date. Figure 1: New and Existing Wells1 (1,500) 500 2,500 4,500 6,500 New Existing New Existing New Existing New 2014201320122011 1,188 5,089 1,309 4,015 4,022 232 52 215 311 58 Horizontal Vertical 5,738 1,347 13 171 2
- 3. Independent Fiscal Of ice February 2015 3 E T R Because the impact fee does not directly respond to the price of natural gas or the volume of production, it does not provide a measure of tax burden relative to natural gas sales. For that purpose, this research brief computes an annual average ETR.3 The ETR is equal to the annual impact fee revenues divided by the total market value of unconventional natural gas production. The market value is equal to the product of (1) the annual average regional price of natural gas net of post‐production costs and (2) the total production of all unconventional wells. The ETR represents an average for all wells in operation during the year. In general, older wells with low production will have higher ETRs, while new wells with much higher production will have lower ETRs. For 2014, the market value of unconventional natural gas produced in Pennsylvania is estimated to be $10.5 trillion. (See Table 3.) The estimate uses these data: Table 3: Impact Fee Annual Effective Tax Rates Calendar Year Impact Fee Unconventional Price of Market Revenues Production (MMcf) Gas ($/Mcf)1 Value2 2011 $204,210 1,072,600 $3.60 $3,865,200 2012 202,472 2,041,700 2.14 4,360,000 2013 225,752 3,103,900 2.89 8,963,800 2014 220,400 4,070,600 2.59 10,545,900 Note: Dollar amounts in thousands. MMcf is million cubic feet. The CY 2014 estimates by the Independent Fiscal Of ice. Source: Pennsylvania Public Utility Commission, Department of Environmental Protection (last accessed on February 25, 2015) and BENTEK Energy. 1 Dominion South spot price converted to dollars per Mcf using Pennsylvania heat content, net of post‐production costs. 2 Does not include natural gas liquids (NGLs); see page 4 for more information. Annual ETR 5.3% 4.6 2.5 2.1 Production of more than four trillion cubic feet. This estimate is based on statewide well production data published by DEP. An annual average price of $3.41 per Mcf, prior to the deduction of post‐production costs. This estimate is based on trades at the Dominion South hub. (See page 4 for additional detail.) Post‐production costs of $0.82 per Mcf. This estimate includes costs for gathering, processing and transporting gas to markets. Such costs are deducted to approximate the value of gas at the wellhead, the point at which producers calculate their tax liability in states that levy a severance tax. “Wet” gas from the southwestern portion of the state requires higher processing costs to separate natural gas liquids. (See page 4 for additional detail.) Therefore, the post‐production costs deducted from the price are a weighted average of approximately $1.47 per Mcf for wet gas and $0.77 per Mcf for dry gas in 2014.4 Figure 2: Dominion South versus Henry Hub: 2011‐2014 $0.00 $1.00 $2.00 $3.00 $4.00 $5.00 $6.00 Jan‐11 Jul‐11 Jan‐12 Jul‐12 Dec‐12 Jul‐13 Dec‐13 Jul‐14 Dec‐14 Spot Prices per MMBtu Dominion South Henry Hub Source: U.S. Energy Information Administration and BENTEK Energy.
- 4. Independent Fiscal Of ice February 2015 4 Table 4: Natural Gas Liquids Production in Pennsylvania Year Barrels Price per Barrel1 Market Value 2011 684,300 $55.52 $38,000 2012 1,786,600 40.44 72,200 2013 2,955,500 36.92 109,100 2014 3,982,700 36.51 145,400 Note: Dollar amounts in thousands. Source: Pennsylvania Department of Environmental Protection (last accessed on February 25, 2015) and U.S. Energy Information Administration. 1 The price of NGLs in dollars per MMBtu converted to dollars per barrel based on national averages reported by the EIA. The annual ETR for 2011 to 2014 has declined in each successive year. (See Table 3.) The main cause of that trend was the dramatic increase in production over the time period. For 2014, the ETR of 2.1 percent represents a reduction of 0.4 percentage points from the 2013 level. Consistent with the trend, the decline in the 2014 ETR is predominantly motivated by an increase in production (31.1 percent). If prices had remained stable, then the decline in the ETR would have been greater. R P N G The Henry Hub spot price is commonly used as a proxy for the price of natural gas throughout the United States.5 The Henry Hub is a market center in Louisiana that provides interconnections between pipelines, access to processing plants, temporary storage between trades and an electronic trading platform to facilitate instantaneous price discovery. It is also a delivery point for futures contracts traded on the New York Mercantile Exchange (NYMEX). There are also dozens of natural gas hubs located in other states, including several within Pennsylvania. The prices quoted at these Pennsylvania hubs have historically tracked closely to the Henry Hub, so that the Henry Hub price served as an effective proxy for the price Pennsylvania producers received for their gas. However, beginning in summer 2014, prices at the Pennsylvania hubs diverged from the Henry Hub so dramatically that the Henry Hub price may no longer serve as an accurate proxy for the prices received by Pennsylvania producers. (See Figure 2 on the previous page.) This price divergence was due to various factors such as strong regional production gains, insufficient pipeline capacity and temporary storage constraints. As a result, this brief does not use the Henry Hub as a proxy for the prices received by Pennsylvania producers. Rather, this brief uses the price at Dominion South, which was the most active hub in the Marcellus region in terms of the volume of gas traded. As shown in Figure 2, the Dominion South spot price was significantly lower than the Henry Hub for the last half of 2014. The price trends for the other Pennsylvania hubs mirror this pattern.6 N G L Certain unconventional gas wells in Pennsylvania produce various hydrocarbons along with “dry,” consumer‐grade natural gas (i.e., methane). The term “wet” natural gas applies to a mixture of hydrocarbons (ethane, propane, butane, pentane and natural gasoline) and non‐hydrocarbons (water vapor, carbon dioxide, hydrogen sul ide, nitrogen and helium) existing together with methane in a gaseous state. The hydrocarbons, called natural gas liquids (NGLs), are separated from methane and are used by industries such as petrochemical manufacturing.7 Major NGL producers such as Texas and Oklahoma levy a severance tax on NGLs at the same rate as oil. Because Pennsylvania does not levy a severance tax on NGLs, they have been excluded from the estimated market value of production when calculating ETRs. If NGLs were included in the ETR calculation, then the ETR would decline by roughly 0.1 percentage point. Table 4 presents data on the amount and market value of NGLs produced from unconventional wells in Pennsylvania by year.
- 5. Independent Fiscal Of ice February 2015 5 Table 5: Share of Impact Fee Revenues Year Wells Revenues Share 2014 New $67,900 30.8% Existing 152,500 69.2 New 58,608 26.0 Existing1 167,144 74.0 2012 New 59,673 29.5 Existing 142,799 70.5 Note: Dollar amounts in thousands. The CY 2014 estimate by the Independent Fiscal Of ice. Source: Pennsylvania Public Utility Commission. 1 The impact fee schedule changed from CY 2012 to CY 2013 because the annual average price of natural gas on the New York Mercantile Exchange rose above the $2.99 per MMbtu threshold established in statute. 2013 2015 O The outlook for the CY 2015 impact fee (to be remitted in April 2016) remains uncertain due to natural gas price volatility and the implications for production. Three factors could affect impact fee revenues for CY 2015: If prices remain subdued, it is unclear how that may impact the number of new wells drilled. The highest impact fee is levied on wells in their first year of operation. For CY 2014, new wells are projected to generate $67.9 million (30.8 percent) of impact fee revenues. (See Table 5.) If the number of new wells subject to the impact fee declines by 10 percent, then the revenues from new wells in CY 2015 would fall to $61.1 million. Revenues from new wells are important to total impact fee collections because they generally offset the decline in fees received for existing wells as they age. The per‐well impact fee decreases each year for operating years two through four. However, nearly half of 2014 wells are in operating year four and will not be subject to a lower fee in operating year five (CY 2015) under the current fee schedule. If the remaining wells that are estimated to be subject to the impact fee for CY 2014 continue to be subject to the fee for CY 2015, then the revenues from those wells will decline by $38.2 million based on the current fee schedule. In practice, some of those wells will not be subject to the impact fee for CY 2015 because they are plugged or qualify for the stripper well exemption. If the average natural gas price falls below $3.00 per MMBtu on the NYMEX, then the per‐well impact fee will decline by roughly $5,000 compared to 2014 levels. (Only wells in operating year 3 would be unaffected.) The EIA forecasts that the Henry Hub spot price (on which the NYMEX is based) will average $3.05 MMBtu for 2015. For the first six weeks of 2015, the NYMEX price ranged from $2.62 to $3.32, with an average of $2.90. If the price of gas had been below $3.00 in 2014, then the impact fee would have generated approximately $29.3 million less. Natural gas prices are a key factor that will help to determine the number of new wells drilled. Typically, regional prices are driven by national trends. However, local structural issues could also impact regional prices in 2015. For example, a number of new pipelines are either awaiting approval or are under construction. New pipelines may increase the regional price of gas by easing storage and transportation constraints, allowing more gas to reach large markets along the east coast. It may also encourage producers to uncap wells that have been drilled, but do not currently produce. Similar to price projections, there is also uncertainty regarding production levels for 2015. For recent years, unconventional Marcellus shale wells have recorded dramatic output gains due to technological improvements that have increased the estimated ultimate recovery (EUR or lifetime output) of new wells. It is unclear whether further technological improvements can continue to increase production at such a rapid pace. The outlook for the 2015 ETR will depend on (1) the number of new wells drilled, (2) regional prices and (3) well production levels. Regional prices will be crucial due to their impact on market value and the incentives to drill new wells or uncap existing wells. Signi icant production gains have been the main reason for the reduction in the ETR since 2011. The level of production will likely play a key role once again for the 2015 ETR, motivated by possible technological advancements and new well EURs. In general, the ETR will move inversely with price and production levels; therefore, if price or production levels increase (decline), then the ETR will likely decline (increase).
- 6. Independent Fiscal Of ice February 2015 6 Rachel Carson State Of ice Building, 2nd Floor 400 Market Street Harrisburg, PA 17105 E‐mail: contact@ifo.state.pa.us Website: www.ifo.state.pa.us Staff Acknowledgements: Mark Stalczynski, Kyle Stewart and Neil Bakshi Independent Fiscal Of ice Endnotes 1. The annual average price of natural gas is the settled price for near‐month contracts on the New York Mercantile Exchange, which is based on the delivery price of natural gas at the Henry Hub in Louisiana. 2. The DEP statewide well production data suggest that 62 wells were plugged in 2014, and those wells are not included in the well count for the impact fee estimate. An additional 17 wells were reported as active in the irst half of 2014, but were not found in the second half production data published as of February 25, 2015. Those wells are not included in the well count for the impact fee estimate. 3. An alternative ETR is the lifetime ETR, which is the average rate over all future years for a single, new well; this measure is best used to quantify the prospective tax burden on new wells across states. (See the IFO’s previous publication, Natural Gas Extraction: An Interstate Tax Comparison, for an analysis using the lifetime ETR.) 4. Post‐production cost estimates taken from Range Resources investor presentation, January 15, 2015. 5. A spot price is a cash price paid for “immediate delivery,” which is often the next business day. Spot prices are unique to each transaction and are commonly averaged per day, month, or year. Futures trading involves contracts for delivery at a future date, which are then traded on an exchange. This analysis does not take into account futures prices or privately‐ negotiated transactions. 6. The selection of Dominion South as the proxy for the price received by Pennsylvania producers was con irmed by industry sources. The criterion used was the volume of gas traded at the hub rather than the total low passing through, since it is the volume traded that receives the price. The hubs considered in this analysis were limited to those located within Pennsylvania, because it was more certain that their volume traded re lected gas originating from Pennsylvania wells. These are the hubs known as Dominion South, Transco‐Leidy, TGP Zone 4, and TETCO‐M3. When weighted by the volume of gas traded, an average of the four hub prices does not differ enough from Dominion South to signi icantly change the ETR calculation. 7. For the purpose of this estimate, natural gas liquids (NGLs) refers to all hydrocarbons separated from wet natural gas. The DEP records and reports NGLs as barrels of condensate in the production data. Other publications may limit the term “condensates” to heavier hydrocarbons such as pentanes and/or natural gasoline. In the early years of the impact fee, some producers reported barrels of condensate as barrels of oil, but no longer do so. Data Sources Statewide well production data for natural gas are from the Pennsylvania Department of Environmental Protection and can be found at https://www.paoilandgasreporting.state.pa.us/publicreports/Modules/Welcome/Welcome.aspx. Act 13 impact fee public data are from the Pennsylvania Public Utility Commission and can be found at http:// www.puc.state.pa.us/ iling_resources/issues_laws_regulations/act_13_impact_fee_.aspx. Annual energy price data are from the U.S. Energy Information Administration and can be found at http://www.eia.gov/.