Slides from IEA Medium-Term Oil Market Report
•
1 j'aime•1,453 vues

Charts and graphs slide presentation used to announce the International Energy Agency's Medium-Term Oil Market Report (MTOMR) at a London conference on May 14, 2013. The new MTOMR report calls the abundance of American shale oil a "supply shock" for the worldwide oil market. The report also predicts American imports from OPEC countries will decrease by nearly 40% in the next five years (see the last slide).

Recommandé
Contenu connexe
Tendances
Tendances (20)
Similaire à Slides from IEA Medium-Term Oil Market Report
Similaire à Slides from IEA Medium-Term Oil Market Report (20)
Plus de Marcellus Drilling News
Plus de Marcellus Drilling News (20)
Dernier
Dernier (20)
Slides from IEA Medium-Term Oil Market Report
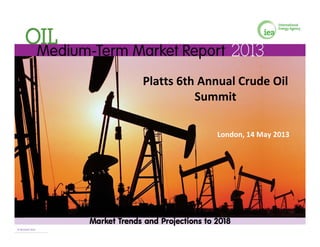
- 1. l h l d ilPlatts 6th Annual Crude Oil Summit London, 14 May 2013 © OECD/IEA 2013© OECD/IEA 2013
- 2. A pivotal time in oil markets 7.0 mb/d Medium-Term Oil Market Balance 4.0 5.0 6.0 1.0 2.0 3.0 -1.0 0.0 2004 2005 2006 2007 2008 2009 2010 2011 2012 2013 2014 2015 2016 2017 2018 Implied OPEC Spare Capacity World Demand Growth World SupplyCapacity Growth © OECD/IEA 2013
- 3. Demand: rise of the non-OECD region Global Oil Demand Growth 7.5% 2.5% 5.0% -2.5% 0.0% -5.0% 2000 2004 2008 2012 2016 OECD Non-OECD © OECD/IEA 2013
- 4. Transport still drives oil use… …but transport gas is around the corner Global Road Transport Sector Gasoline Demand kb/dGlobal Road Transport Sector 60% 80% 100% Gasoline Demand, kb/d 15 000 0% 20% 40% 10 000 0% 1990 2000 2010 2015 2018 Gasoline Diesel Natural gas LPG Others 5 000 1998 2002 2006 2010 2014 2018 OECD Non-OECD © OECD/IEA 2013
- 5. US & Iraq lead supply growth mb/d Global Liquids Growth 2012-18 0.5 6.0 8.4 8 10 Crude US Light Tight Oil NGLs Non-Conv Biofuels Processing Gain 2.3 2.3 0 6 1.4 2.0 2.4 6.0 2 4 6 1.8 1.0 2.8 2.30.6 0 2 OPEC* Non-OPEC Total * OPEC crude is capacity additionsO C c ude s capac ty add t o s Global Refinery processing gains included in Non-OPEC © OECD/IEA 2013
- 6. New trends in capital expenditures Tight oil deepwater spending on the riseTight oil, deepwater spending on the rise Annual Capex by Oil Type 500 600 80% 90% 100% %) Annual Capex by Oil Type 300 400 40% 50% 60% 70% $Billion e of Capex (% Total Capex (RHS) Other Oil Sands Deepwater Tight Oil 100 200 0% 10% 20% 30% $ Shar 22% 16% 7% 14% -0% 2004 2006 2008 2010 2012 2014 2016 2018 2020 Source: IEA Analysis of Rystad Energy. Oil deposits only. © OECD/IEA 2013
- 7. Non-OPEC supply: West Side story 1 4 mb/d Non-OPEC Supply - Yearly Change 0.6 1.0 1.4 -0.2 0.2 -1.0 -0.6 1995 1998 2001 2004 2007 2010 2013 2016 NAM LAM OECD EUR FSU China Africa PG & Biofuels Other Non-OPEC Total © OECD/IEA 2013
- 8. OPEC capacity growth hits hurdles Growth now forecast at 1.75 mb/d, to 36.75 mb/d mb/d Change in OPEC Crude Oil 0 4 0.6 0.8 1.0 1.2 mb/d Change in OPEC Crude Oil Production Capacity 0 6 -0.4 -0.2 0.0 0.2 0.4 -0.8 -0.6 2012 2013 2014 2015 2016 2017 2018 Iran Iraq UAE Saudi Arabia Oth T t l OPECOther Total OPEC © OECD/IEA 2013
- 9. Mid. East leads OPEC capacity growth Iraq, Saudi Arabia and UAE offset Iran decline Incremental OPEC Crude P d ti C it 2012 18 Lib Nigeria UAE Angola Iraq Production Capacity 2012-18 E d Qatar Algeria Kuwait Venezuela Libya -1.2 -0.8 -0.4 0.0 0.4 0.8 1.2 1.6 Iran Saudi Arabia Ecuador mb/d © OECD/IEA 2013
- 10. Biofuels supplies grow to 2.4 mb/d 2 5 mb/d 1.5 2.0 2.5 0 0 0.5 1.0 0.0 2012 2013 2014 2015 2016 2017 2018 Rest of Global Biofuels OECD EUR Biofuels Brazil Biofuels US BiofuelsBrazil Biofuels US Biofuels © OECD/IEA 2013
- 11. Rise of the non-OECD refining titans Global CDU capacity seen up by 9.5 mb/d; refining capacity gets more sophisticated Regional Share of CDU Expansions China 45% Other Asia 14% Latin America 14%14% Middle East 22% Other 5% © OECD/IEA 2013 China leads CDU additions
- 12. N. American refining: focus on upgrading & desulpherisation 0.5 mb/d NorthAmerican Capacity Additions 0 2 0.3 0.4 0.0 0.1 0.2 -0.3 -0.2 -0.1 2012 2013 2014 2015 2016 2017 2018 Crude Distillation Upgrading Desulphurisation © OECD/IEA 2013 Latin America still an import magnet
- 13. Crude trade contracts, flows shift Atlantic‐to‐Pacific trade edges upAtlantic‐to‐Pacific trade edges up Crude Exports in 2018 and Growth in 2012-18 for Key Trade Routes* (million barrels per day) * E l d I t R i l T d* Excludes Intra-Regional Trade OECD Europe 0.3 (+0.1) 2.9 (-1.4) 3.1 (-0.6) 3.9 (-0.9) 0.3 (-0.8) China Europe 1.3 (-0.3) 1.4 (+0.7) OECD Pacific 0.7 (+0.3) ( ) North America ( ) 2.9 1.6 (0.3) 1.2 (+0.4) -0.3 1.5 1.7 (+0.8) 6.2 (+0.8) Other Asia (-1) 0.5 (+0.4) © OECD/IEA 2013 0.5 Red number in brackets denotes growth in period 2011-18 (+0)
- 14. N. American imports plunge Origin of North American Crude Imports in 2012 and 2018 ( ) 1.1 0.3 2012 0.3 0.2 2018 (million barrels per day) 2.7 1.5 1.7 1.2 1.5 Middle East Latin America Africa Others Middle East Latin America Africa Others © OECD/IEA 2013