SlideShare une entreprise Scribd logo
1  sur  88
Télécharger pour lire hors ligne
Prepared in cooperation with the
West Virginia Department of Environmental Protection, Division of Water and Waste Management
Water Quality of Groundwater and Stream Base Flow in the
Marcellus Shale Gas Field of the Monongahela River Basin,
West Virginia, 2011–12
Monongahela
River Basin
Monongahela
River Basin
Scientific Investigations Report 2014–5233
U.S. Department of the Interior
U.S. Geological Survey
Cover.  The extent of the Marcellus Shale in West Virginia and the location of the Monongahela River Basin and its major streams. See
figure 1 for an explanation of the extent of the Marcellus Shale. Marcellus Shale thickness from Schwietering and Bocan (2011).
Water Quality of Groundwater and Stream
Base Flow in the Marcellus Shale Gas Field
of the Monongahela River Basin,
West Virginia, 2011–12
By Douglas B. Chambers, Mark D. Kozar, Terence Messinger, Michon L. Mulder,
Adam J. Pelak, and Jeremy S. White
Prepared in cooperation with the
West Virginia Department of Environmental Protection,
Division of Water and Waste Management
Scientific Investigations Report 2014–5233
U.S. Department of the Interior
U.S. Geological Survey
U.S. Department of the Interior
SALLY JEWELL, Secretary
U.S. Geological Survey
Suzette M. Kimball, Acting Director
U.S. Geological Survey, Reston, Virginia: 2015
For more information on the USGS—the Federal source for science about the Earth, its natural and living
resources, natural hazards, and the environment, visit http://www.usgs.gov or call 1–888–ASK–USGS.
For an overview of USGS information products, including maps, imagery, and publications,
visit http://www.usgs.gov/pubprod
Any use of trade, firm, or product names is for descriptive purposes only and does not imply endorsement by the
U.S. Government.
Although this information product, for the most part, is in the public domain, it also may contain copyrighted materials
as noted in the text. Permission to reproduce copyrighted items must be secured from the copyright owner.
Suggested citation:
Chambers, D.B., Kozar, M.D., Messinger, Terence, Mulder, M.L., Pelak, A.J., and White, J.S., 2015, Water quality
of groundwater and stream base flow in the Marcellus Shale Gas Field of the Monongahela River Basin, West Vir-
ginia, 2011–12: U.S. Geological Survey Scientific Investigations Report 2014–5233, 75 p., http://dx.doi.org/10.3133/
sir20145233.
ISSN 2328-0328 (online)
iii
Acknowledgments
The authors thank Katherine S. Paybins, Jessica L. Wood, and Hugh E. Bevans of the U.S.
Geological Survey (USGS) for helping with the collection of samples during the groundwater
survey and base-flow survey. Thanks also go to Jeffrey E. Bailey, West Virginia Department
of Environmental Protection, Division of Water and Waste Management, for assistance in
understanding land-use patterns in the study area and in surface-water site selection. Lisa
Senior and Michael Bradley of the USGS are thanked for their thoughtful reviews that have
improved this report.
iv
Contents
Abstract ...........................................................................................................................................................1
Introduction ....................................................................................................................................................2
Purpose and Scope..............................................................................................................................6
Description of Study Area....................................................................................................................6
Physiography and Climate...........................................................................................................6
Geologic Setting............................................................................................................................7
Land Use.........................................................................................................................................9
Methods of Study.................................................................................................................................11
Site Selection..............................................................................................................................11
Groundwater ......................................................................................................................11
Surface Water ...................................................................................................................11
Sampling Methods......................................................................................................................15
Groundwater Sampling ....................................................................................................15
Base-Flow Sampling ........................................................................................................15
Methods of Analysis...................................................................................................................18
Geospatial Analyses..........................................................................................................18
Statistical Analyses...........................................................................................................18
Quality Assurance......................................................................................................................18
Blank Samples....................................................................................................................18
Replicate Samples.............................................................................................................18
Quality-Assurance Results..........................................................................................................................19
Groundwater Samples ..............................................................................................................19
Base-Flow Samples....................................................................................................................19
Water Quality in the Monongahela River Basin .....................................................................................19
Specific Conductance, Total Dissolved Solids, and pH ................................................................19
Specific Conductance................................................................................................................20
Total Dissolved Solids................................................................................................................22
pH..................................................................................................................................................22
Major Ions.............................................................................................................................................22
Trace Elements.....................................................................................................................................32
Naturally Occurring Radioactive Materials....................................................................................40
Isotopes.................................................................................................................................................41
Groundwater Survey..................................................................................................................42
Base-Flow Survey.......................................................................................................................42
Dissolved Gases...................................................................................................................................45
Water-Quality Patterns ......................................................................................................................47
Summary........................................................................................................................................................52
References Cited..........................................................................................................................................53
Appendix 1. Data for groundwater samples collected as part of the Marcellus Shale baseline
survey, Monongahela River Basin, West Virginia, June–September 2011............................62
Appendix 2. Data for base-flow samples collected as part of the Marcellus Shale baseline
survey, Monongahela River Basin, West Virginia, July–October 2012..................................70
v
Figures
	 1.  Map showing extent of the Marcellus Shale in the Monongahela River Basin
in West Virginia..............................................................................................................................3
	 2.  Maps showing A, thickness of the Marcellus Shale, wells completed in the
Marcellus Shale, and horizontal wells, and B, locations of all gas wells, including
abandoned wells, Monongahela River Basin and vicinity, West Virginia, 2012..................4
	 3.  Geologic map of the Monongahela River Basin in West Virginia.........................................8
	 4.  Map showing coal mines in the Monongahela River Basin and adjacent areas
in West Virginia............................................................................................................................10
	 5.  Map showing groundwater survey sites in the Monongahela River Basin,
West Virginia, June–September 2011......................................................................................13
	 6.  Flow chart showing the process for stratifying stream-water sampling sites.................16
	 7.  Map showing streams, stream sampling sites, gas wells completed in the
Marcellus Shale through 2012 showing gas production through 2010,
and average thickness of the Marcellus Shale by HUC-12..................................................17
	 8.  Boxplots showing distribution of specific conductance for samples collected
as part of the Marcellus Shale baseline study, 2011–12, and historical specific
conductance for samples collected in the Monongahela River Basin,
West Virginia: A, groundwater samples and B, base-flow samples...................................21
	 9.  Boxplots showing distribution of specific conductance for samples collected
as part of the Marcellus Shale baseline study, Monongahela River Basin,
West Virginia, 2011–12, grouped by gas production type: A, groundwater
samples and B, base-flow samples..........................................................................................21
	 10.  Boxplots showing distribution of pH in samples collected as part of the
Marcellus Shale baseline study, 2011–12, and historical pH in samples
from the Monongahela River Basin, West Virginia: A, groundwater samples
and B, base-flow samples..........................................................................................................22
	 11.  Boxplots showing distribution of pH in samples collected as part of
the Marcellus Shale baseline study in the Monongahela River Basin,
West Virginia, 2011–12: A, groundwater samples and B, base-flow samples. .................23
	 12.  Piper diagrams showing major ion composition of samples collected as part
of the Marcellus Shale baseline study, 2011–12, from the Monongahela River
Basin, West Virginia: A, groundwater survey samples classified by geologic
formation and B, base-flow survey samples...........................................................................24
	 13.  Boxplots showing distribution of major-ion concentrations in groundwater
and base-flow samples collected as part of the Marcellus Shale baseline study,
2011–12, and historical major-ion concentrations, Monongahela River Basin,
West Virginia: A, calcium, B, sodium, C, magnesium, D, potassium, E, chloride,
F, sulfate, G, bromide, and H, fluoride......................................................................................25
	 14.  Boxplots showing distribution of major-ion concentrations in groundwater
and base-flow samples collected as part of the baseline study, Monongahela
River Basin, West Virginia, 2011–12, grouped by gas production bin: A, calcium,
B, sodium, C, magnesium, D, potassium, E, chloride, F, sulfate, G, bromide,
and H, fluoride..............................................................................................................................28
	 15.  Boxplots showing distribution of trace-element concentrations in groundwater
and base-flow samples collected as part of the Marcellus Shale baseline study,
2011–12, and historical trace-element concentrations, Monongahela River Basin,
West Virginia: A, aluminum, B, iron, C, manganese, D, barium, and E, strontium
in base flow only..........................................................................................................................34
vi
	 16.  Boxplots showing distribution of trace-element concentrations in groundwater
and base-flow samples collected as part of the baseline study, 2011–12,
Monongahela River Basin, West Virginia, grouped by gas production bin:
A, aluminum, B, iron, C, manganese, D, barium, E, strontium, F, cobalt,
G, molybdenum, and H, arsenic.................................................................................................36
	 17.  Boxplots showing distribution of uranium concentrations in groundwater and
base-flow samples collected as part of the Marcellus Shale baseline study,
Monongahela River Basin, West Virginia, 2011–12, grouped by gas production
bin: A, groundwater samples and B, base-flow samples.....................................................41
	 18.  Graphs showing oxygen and hydrogen isotopic composition of water
in A, groundwater samples and B, base-flow samples collected as part
of the Marcellus Shale baseline study in the Monongahela River Basin,
West Virginia, 2011–12, and the Global Meteoric Water Line..............................................42
	 19.  Graphs showing isotopic signatures of dissolved methane in 11 groundwater
samples collected as part of the Marcellus Shale baseline study,
Monongahela River Basin, West Virginia, 2011, in samples from the Pittsburgh
Coal, in a Marcellus Shale gas separation tank, and in various other sources:
A, deep, microbially stimulated methane; B, biogenic, thermogenic, and mixed
source methane; and C, predominantly thermogenic methane signature.........................43
	 20.  Graph showing isotopic composition of dissolved inorganic carbon in base-flow
samples collected as part of the Marcellus Shale baseline study,
Monongahela River Basin, West Virginia, 2012......................................................................44
	 21.  Graph showing concentrations of dissolved nitrogen in relation to concentrations
of dissolved argon in samples from 39 wells and 2 springs collected as part
of the baseline study, Monongahela River Basin, West Virginia, 2011,
with associated estimates of recharge temperature and excess air,
based on normalized sea-level concentrations.....................................................................46
	 22.  Diagram showing principal component axis scores for the two principal
components for selected groundwater samples collected as part
of the Marcellus Shale baseline study, Monongahela River Basin,
West Virginia, 2011......................................................................................................................48
	 23.  Map showing concentrations of methane in groundwater samples collected
as part of the Marcellus Shale baseline study, Monongahela River Basin,
West Virginia, 2011, and the location of mined coal seams and geologic
structural features.......................................................................................................................50
	 24.  Graphs showing concentration of constituent or property in relation to the mining
intensity, measured as the sum of mined areas in the 12-digit hydrologic unit
code areas, expressed as a proportion of the HUC-12 surface area for A, sulfate
and B, specific conductance in base-flow samples collected as part of the
Marcellus Shale baseline survey, Monongahela River Basin, West Virginia, 2012.........51
vii
Tables
	 1.  Water-quality properties, major ions, trace elements, naturally occurring
radioactive materials, and dissolved gases analyzed for in groundwater
and surface-water samples from the Marcellus Shale baseline survey,
Monongahela River Basin, West Virginia, 2011–12................................................................12
	 2.  Site information for wells and springs sampled for the groundwater survey
as part of the Marcellus Shale baseline survey, Monongahela River Basin,
West Virginia, June–September 2011......................................................................................14
	 3.  Site information for streams sampled during base flow as part of the Marcellus
Shale baseline survey, Monongahela River Basin, West Virginia,
July–October 2012.......................................................................................................................57
	 4.  Statistical summary of water-quality field measurements and major ions
in samples collected for the groundwater survey and base-flow survey
as part of the Marcellus Shale baseline survey, Monongahela River Basin,
West Virginia, 2011–12................................................................................................................20
	 5.  Statistical summary of trace elements in samples collected for the groundwater
survey and the base-flow survey as part of the Marcellus Shale baseline survey,
West Virginia, 2011–12................................................................................................................33
	 6.  Statistical summary of naturally occurring radioactive materials in groundwater
and base-flow samples collected as part of the Marcellus Shale baseline survey,
Monongahela River Basin, West Virginia, 2011–12................................................................40
	 7.  Statistical summary of dissolved gases in groundwater samples collected
as part of the Marcellus Shale baseline survey, Monongahela River Basin,
West Virginia, 2011......................................................................................................................46
	 8.  Principal component loadings from analysis of 23 variables potentially
affecting groundwater quality in the Monongahela River Basin
in West Virginia, 2011..................................................................................................................48
viii
Conversion Factors
Inch/Pound to SI
Multiply By To obtain
Length
foot (ft) 0.3048 meter (m)
mile (mi) 1.609 kilometer (km)
Area
square mile (mi2
) 259.0 hectare (ha)
square mile (mi2
) 2.590 square kilometer (km2
)
Volume
barrel (bbl), (petroleum,
1 barrel=42 gal)
0.1590 cubic meter (m3
)
gallon (gal) 3.785 liter (L)
gallon (gal) 0.003785 cubic meter (m3
)
gallon (gal) 3.785 cubic decimeter (dm3
)
million gallons (Mgal) 3,785 cubic meter (m3
)
cubic foot (ft3
) 28.32 cubic decimeter (dm3
)
cubic foot (ft3
) 0.02832 cubic meter (m3
)
thousand cubic feet (Mcf) 28.32 cubic meter (m3
)
Flow rate
cubic foot per second (ft3
/s) 0.02832 cubic meter per second (m3
/s)
cubic foot per second per square
mile [(ft3
/s)/mi2
]
0.01093 cubic meter per second per
square kilometer [(m3
/s)/km2
]
Pressure
atmosphere, standard (atm) 101.3 kilopascal (kPa)
Bar 100 kilopascal (kPa)
inch of mercury at 60ºF (in Hg) 3.377 kilopascal (kPa)
Radioactivity
picocurie per liter (pCi/L) 0.037 becquerel per liter (Bq/L)
Temperature in degrees Celsius (°C) may be converted to degrees Fahrenheit (°F) as follows:
°F=(1.8×°C)+32
Temperature in degrees Fahrenheit (°F) may be converted to degrees Celsius (°C) as follows:
°C=(°F-32)/1.8
Vertical coordinate information is referenced to the North American Vertical Datum of 1988
(NAVD 88).
Horizontal coordinate information is referenced to the North American Datum of 1983 (NAD 83).
Elevation, as used in this report, refers to distance above the vertical datum.
Specific conductance is given in microsiemens per centimeter at 25 degrees Celsius (µS/cm at
25 °C).
Concentrations of chemical constituents in water are given either in milligrams per liter (mg/L)
or micrograms per liter (µg/L).
Radioactivity of chemical constituents in water are given in picocuries per liter (pCi/L).
Water quality of groundwater and stream base flow in
the Marcellus Shale Gas Field of the Monongahela River
Basin, West Virginia, 2011–12
By Douglas B. Chambers, Mark D. Kozar, Terence Messinger, Michon L. Mulder1
, Adam J. Pelak1
,
and Jeremy S. White
Abstract
The Marcellus Shale gas field underlies portions of New
York, Pennsylvania, Ohio, Virginia, Maryland, Tennessee,
and West Virginia. Development of hydraulic fracturing and
horizontal drilling technology led to extensive development
of gas from the Marcellus Shale beginning about 2007. The
need to identify and monitor changes in water-quality condi-
tions related to development of the Marcellus Shale gas field
prompted the U.S. Geological Survey, in cooperation with
the West Virginia Department of Environmental Protection,
Division of Water and Waste Management, to document water
quality for comparison with water quality in samples collected
at a future date. The identification of change in water-quality
conditions over time is more difficult if baseline water-quality
conditions have not been documented.
U.S. Geological Survey personnel sampled groundwater
and surface water in West Virginia’s Monongahela River Basin
during 2011–12. A groundwater survey, in which 39 wells and
2 springs were sampled, was conducted during June through
September 2011. A base-flow survey was conducted during
July through October 2012; 50 stream sites were sampled
under base-flow conditions in this survey.
Because additives to hydraulic fracturing fluids are vari-
able and decrease in flowback water over a relatively short
time, water-quality analyses for this study focused on docu-
menting the water-quality characteristics typical of water from
shallow aquifers; water derived from contact with the Marcel-
lus Shale (flowback from hydraulic fracturing or formation
water); and water with constituents from conventional oil and
gas development, sewage effluent, and coal-mine drainage. All
samples were analyzed for field properties (water temperature,
pH, specific conductance, dissolved oxygen, and turbidity),
major ions, trace elements, naturally occurring radioactive
materials, and stable isotopes.
In addition to documenting baseline water-quality condi-
tions for an area of shale-gas development, these data were
examined for patterns in water quality. Groundwater and
base-flow survey data were compared to historical data from
the Monongahela River Basin in West Virginia. Additionally,
groundwater- and base-flow survey samples were grouped by
Marcellus Shale gas production in the subbasin in which that
sampling site was located.
The comparisons of data collected as part of this study
with historical data identified few differences. No signifi-
cant difference was found in a comparison of groundwater
survey data and historical data. Base-flow survey samples
differed significantly from historical data for pH, chloride,
and strontium, all of which had higher concentrations in the
base-flow survey samples. Differences in pH are likely related
to changes in mining regulation beginning in 1977. Concentra-
tions of chloride and strontium elevated above background
concentrations may be related to saline groundwater; saline
water is within 300 feet of the land surface in parts of the
study area.
In the comparison of base-flow survey samples grouped
by shale-gas-production setting, significant differences were
found for fluoride and barium. Concentrations of fluoride and
barium were higher in stream subbasins with active Marcellus
Shale production than in subbasins not near active Marcellus
Shale production. Elevated fluoride and barium are associated
with deep brines.
Generally, naturally occurring radioactive materials were
not found in elevated concentrations in either groundwater or
base-flow samples. Only 3 samples, 2 from the groundwater
survey and one from the base-flow survey, exceeded the U.S.
Environmental Protection Agency maximum contaminant
level for radium isotopes of 5.0 picocurie per liter for either
a single isotope or a combined value of radium-226 and
radium-228.
Stable isotope composition indicates broad similarity
among surface water, shallow groundwater, and precipitation
in the region. Neither shallow groundwater nor surface water1
West Virginia University.
2   Water quality in the Marcellus Shale Gas Field of the Monongahela River Basin, West Virginia, 2011–12
showed a marked similarity with the deep brines associated
with shale gas. In most of the groundwater survey samples,
38 of 41 samples, dissolved gas profiles were similar to those
previously found in samples from shallow, domestic wells in
the region.
This study provides a baseline of water-quality condi-
tions in the Monongahela River Basin in West Virginia during
the early phases of development of the Marcellus Shale gas
field. Although not all inclusive, the results of this study
provide a set of reliable water-quality data against which
future data sets can be compared and the effects of shale-gas
development may be determined.
Introduction
Natural gas in West Virginia was reported as early as
1774, followed by the first documented industrial use in the
State, fueling brine boilers, in 1841 (White, 1904). Since that
time, natural gas has been an integral component of West
Virginia’s and the Nation’s energy supply. Since about 2007,
the development of hydraulic fracturing and horizontal drill-
ing technology has led to extensive development of gas from
the Marcellus Shale in the Monongahela River Basin in West
Virginia (figs. 1 and 2).
Much of Nation’s historical gas production has been
from “conventional” gas fields, geographically discrete accu-
mulations with distinct water-hydrocarbon contacts (Schenk
and Pollastro, 2002). The localized nature, high permeability,
and high recovery factors of conventional gas accumulations
make them amenable to extraction by vertical drilling. In
contrast, shale gas resources form within organic-rich shale
source rock (U.S. Energy Information Administration, 2012).
The low permeability of the shale greatly inhibits the gas
from migrating to more permeable reservoir rocks. Although
some shale formations have long been known to be rich in
gas, little gas could be obtained from them using conven-
tional drilling techniques. Improvements in drilling technolo-
gies, specifically horizontal drilling and hydraulic fracturing,
have made recovery of shale-gas reserves economically
feasible.
The Marcellus Shale is a formation of Devonian age that
underlies large parts of New York, Pennsylvania, Ohio, and
West Virginia, and smaller parts of Virginia, Maryland, and
Tennessee. The Marcellus Shale ranges in depth from about
2,000 feet below mean sea level (MSL) along the western
edge of its extent to greater than 6,000 feet below MSL
along the eastern edge, with the thicker deposits occurring
at greater depths. A recent assessment estimated that 84,198
billion cubic feet of natural gas and 3,379 million barrels of
natural gas liquids are technically recoverable from the Mar-
cellus Shale (Coleman and others, 2011). On the basis of the
2009 consumption of 23 trillion cubic feet (ft3
), this is enough
natural gas to meet the needs of the entire Nation for about 15
years (Coleman and others, 2011).
The low permeability and low recovery factors of Mar-
cellus Shale, as with other shale-gas fields, makes extraction
with vertical drilling challenging. However, the use of hori-
zontal, or directional drilling, and hydraulic fracturing allow
recovery of natural gas from the Marcellus Shale. Directional
drilling and hydraulic fracturing capitalize upon and augment
naturally occurring fractures, thereby enhancing permeability
and gas recovery (U.S. Department of Energy, 2013).
A horizontal well begins with a vertical well drilled to
a depth approaching that of the targeted shale bed, 5,000 to
9,000 feet below MSL in the Marcellus Shale in West Virginia
(U.S. Department of Energy, 2013). Once the desired depth
of vertical well bore is reached, a steerable downhole motor
is used to drill the well at an angle. The steerable motor will
eventually impart sufficient angular deviation to turn the
well bore 90 degrees from the vertical. The well bore is then
extended as a lateral well bore, or “lateral,” through the shale
bed. These laterals can extend for 3,000 to 10,000 feet from
the vertical well bore (U.S. Department of Energy, 2013).
Once the horizontal wells are completed, the recovery
of gas from the Marcellus Shale is further enhanced through
hydraulic fracturing, commonly referred to as “fracking.”
Hydraulic fracturing uses fluids under high pressure to create
fractures in the rock, increasing gas flow to the well bore. The
well casing and cement are perforated with small explosive
charges prior to injection of the pressurized fluid. The fluid
contains quartz sand or other materials of similar size or shape
(proppants) that remain in the newly created fractures to keep
them from closing. The hydraulic-fracturing fluid and forma-
tion fluid can flow back to land surface as the injection pres-
sure is reduced.
Although natural gas has been promoted as the cleanest-
burning fossil fuel, emitting only 53 kilograms (kg) of carbon
dioxide (CO2
) per million British thermal units (Btu); coal
emits an average of 95 kg of CO2
per million Btu (U.S. Energy
Information Administration, 1999). Production of natural gas
is not without environmental consequences. Kappel and others
(2013) presented critical water-resources issues associated
with shale-gas development in the Appalachian Basin, grouped
into the following categories: water supply, stray gas, radio-
activity in shale waste, fluid waste treatment and disposal,
deep well injection of fluid waste, solid waste disposal, and
construction and transportation.
Large quantities of water are used during the hydraulic
fracturing, posing potential water-quality issues. As much as
3 million gallons of water can be used for a single hydrau-
lic fracturing treatment. Hydraulic fracturing fluids contain
chemicals that increase the viscosity to a gel-like consistency
and allow the transport of a proppant, usually sand, into the
hydraulically created fractures to keep them open. Other
chemicals allow the viscosity of the fluid to break down
quickly so that the fluid can be easily removed. In addition
to chemical additives in the hydraulic fracturing fluids, the
contact of fluids with the rock matrix introduces a variety
of formation constituents, including brines, trace elements,
and radionuclides.
Introduction   3
BasefromU.S.GeologicalSurvey,1:200,000,digitallinegraphics
020MILES
020KILOMETERS
PhysiographyfromFennemanandJohnson,1946;
MarcellusShalethicknessfromSchwieteringandBocan,2011
EXPLANATION
Physiographicprovince
AppalachianPlateaus
BlueRidge
CentralLowland
Piedmont
ValleyandRidge
ThicknessofMarcellusShale,infeet
Marcellusassumedtobeabsent
Uncertainthickness
21–40
40–60
61–80
81–100
Greaterthan100
MonongahelaRiverbasinboundary
79°30'80°80°30'81°81°30'
39°30'
39°
38°30'
WV
PA
OH
KY
VA
MD
Areaofdetail
M
ononga
helaRiver
ShaversFork
Tyg
artValleyRiver
WestFork
River
CheatRi
ver
Figure1. ExtentoftheMarcellusShaleintheMonongahelaRiverBasininWestVirginia.
4   Water quality in the Marcellus Shale Gas Field of the Monongahela River Basin, West Virginia, 2011–12
BasemapfromU.S.GeologicalSurvey1:200,000digitallinegraphicsMarcellusShalewelllocationsfromWestVirginiaDepartmentofEnvironmentalProtection,TechnicalApplicationGISUnit,2013;
MarcellusShalethicknessfromSchwieteringandBocan,2011
020MILES
020KILOMETERS
EXPLANATION
ThicknessofMarcellusShale,infeet
Marcellusassumedtobeabsent
Uncertainthickness
21–40
40–60
61–80
81–100
Greaterthan100
MonongahelaRiverBasinboundary
WellcompletedinMarcellusShale
inWestVirginia,September2012
Horizontalwellcompletedin
MarcellusShaleinWestVirginia,
September2012
A
79°30'80°80°30'81°81°30'
39°30'
39°
38°30'
Areaofdetail
WV
PA
OH
KY
VA
MD
Figure2. A,ThicknessoftheMarcellusShale,wellscompletedintheMarcellusShale,andhorizontalwells,andB,locationsofallgaswells,including
abandonedwells,MonongahelaRiverBasinandvicinity,WestVirginia,2012.
Introduction   5
BasemapfromU.S.GeologicalSurvey1:200,000digitallinegraphicsMarcellusShalewelllocationsfromWestVirginiaDepartmentofEnvironmentalProtection,
TechnicalApplicationGISUnit,2013
020MILES
020KILOMETERS
EXPLANATION
MonongahelaRiverBasinboundary
Locationofgaswell
Active
Abandoned
B
79°30'80°80°30'81°81°30'
39°30'
39°
38°30'
Areaofdetail
WV
PA
OH
KY
VA
MD
Figure2. A,ThicknessoftheMarcellusShale,wellscompletedintheMarcellusShale,andhorizontalwells,andB,locationsofallgaswells,including
abandonedwells,MonongahelaRiverBasinandvicinity,WestVirginia,2012.—Continued
6   Water quality in the Marcellus Shale Gas Field of the Monongahela River Basin, West Virginia, 2011–12
Hydraulic fracturing fluids and formation waters are
highly contaminated and must be captured and disposed of
properly when the fluids flow back to land surface. Initial
recovery of hydraulic fracturing fluids in the Marcellus Shale
is 20–25 percent (U.S. Department of Energy, 2013). Industry
estimates for continued recovery of hydraulic fracturing fluid
and formation water, even after the well is on-line, range from
5 to 50 barrels per week. Current regulations in West Virginia
require offsite disposal of fracturing fluids and flowback from
horizontal wells (West Virginia Department of Environmen-
tal Protection, 2010). Fluids are collected in either a sealed
tank or a lined open pit and hauled by truck to a disposal site.
The preferred method of disposal (as of 2014) for hydraulic
fracturing fluids is underground injection into deep formations
(West Virginia Department of Environmental Protection, 2010),
often former oil- and gas-producing formations. This disposal
practice could also be a threat to water quality because of the
potential for spills during the fluid handling and transportation
process or leakage from natural faults and fractures or from for-
mer gas and oil wells that have not been properly constructed
or abandoned.
Documentation of the 2011–12 baseline quality of shal-
low groundwater underlain by the Marcellus Shale in north-
central West Virginia can be used for comparison with future
water quality to monitor and recognize potential water-quality
changes from gas-production activities should they occur. The
West Virginia’s Monongahela River Basin was identified as
an area of rapid Marcellus Shale gas development. Therefore,
in 2011 the U.S. Geological Survey (USGS), in cooperation
with the West Virginia Department of Environmental Protec-
tion (WVDEP), Division of Water and Waste Management,
began a study to obtain baseline water-quality information for
the Monongahela River Basin in West Virginia. The water-
quality properties and constituents documented during this
study include those that are naturally occurring in the Marcel-
lus Shale and are likely to be elevated in shallow groundwater
through contact with return flows or leakage from hydraulic
fracturing activities. Because groundwater discharge to streams
forms base flow, potential water-quality changes to groundwa-
ter may also affect base-flow quality.
Purpose and Scope
This report describes the water quality of groundwater
and stream base flow in that part of north-central West Virginia
drained by the Monongahela River during early development
of the Marcellus Shale gas field. Groundwater samples were
collected during June–September 2011, and base-flow samples
were collected in 2012. The conditions described in this report
include those affected by human activities that potentially intro-
duce contaminants into surface water and groundwater similar
to those expected from shale-gas development. Concentrations
of water-quality constituents are presented in figures and tables.
Description of Study Area
The study area is the Monongahela River Basin in West
Virginia (fig. 1) and encompasses a drainage area of 7,377
square miles (mi2
) (19,106 square kilometers [km2
]) in the
north-central part of West Virginia. Major tributaries to the
Monongahela River are the Cheat River, Tygart Valley River,
and the West Fork River. The study area was selected because
of the large number of vertical and horizontal gas wells that
are proposed for the Marcellus Shale.
Physiography and Climate
The study area is mostly within the Appalachian Plateaus
Physiographic Province, but a small area in the southeastern
part of the study area has been mapped as lying within the
Valley and Ridge Physiographic Province (Fenneman, 1938).
The Appalachian Plateaus are characterized by flat to slightly
dipping sedimentary rocks that have been eroded by fluvial
processes to form a rolling topography with a dendritic stream
drainage pattern.
The boundary between the two provinces is known as the
Allegheny Front, an abrupt and complex transition between
the two physiographic provinces. To the west of the Allegheny
Front, lie the relatively flat to slightly dipping rocks of the
Appalachian Plateaus; to the east of the Allegheny Front, lie
steeply dipping, long linear ridges and valleys of the Valley
and Ridge Physiographic Province.
Within the Valley and Ridge, topography varies and is
marked by steep ridges, typically formed by more weather
resistant sandstones and limestone, and narrow valleys, which
tend to form in areas underlain by less resistant shales and
siltstones (West Virginia Geological and Economic Survey,
2014b). Orogenic processes compressed rocks to form the
Valley and Ridge Physiographic Province. The compres-
sional stress resulted in significant folding and faulting of the
bedrock strata, and resulted in the characteristic alternating
long linear valleys and ridges from which the province derived
its name. Stream drainages in the Valley and Ridge Physio-
graphic Province commonly exhibit a predominantly trellis
drainage pattern.
Elevation in the study area ranges from about 790 ft
above the North American Vertical Datum of 1988 (NAVD 88)
near the Monongahela River at the border of West Virginia
and Pennsylvania to about 4,850 ft in the southern part of the
study area. Mean annual precipitation within the Appalachian
Plateaus Physiographic Province varies with elevation owing
to orographic lifting. Mean annual precipitation (1981–2010)
ranged from 44 inches per year (in/yr) to 66 in/yr (PRISM
Climate Group, 2012). Maximum precipitation occurs in the
mountains in the southern part of the study area, and mini-
mum precipitation occurs near the Monongahela and West
Fork Rivers.
Introduction   7
Geologic Setting
Geologic strata in the study area are composed of several
formations and groups (fig. 3), ranging in age from Devonian
through Permian with Quaternary alluvial deposits along
the streams and rivers. The strata include parts of geologic
formations of Devonian, Mississippian, and Pennsylvanian
age, and all bedrock in the study area is sedimentary in origin.
Geologic nomenclature used in this report conforms with that
used by the West Virginia Geological and Economic Survey,
as depicted on the 1968 State geologic map of West Virginia
(Cardwell and others, 1968). Bedrock composition of the for-
mations is described below (Cardwell and others, 1968).
Devonian-age geologic strata exposed at land surface
in the study area include parts of the Harrell Shale, Brallier
Formation, Chemung Group, and the Hampshire Forma-
tion (fig. 3). The Harrell Shale and the Brallier Formation
are composed predominantly of dark marine shales with thin
interspersed lenses of limestone, siltstone, and sandstone. The
Chemung Group is characterized as mostly siltstone and sand-
stone with shale and conglomerate interbeds. The Hampshire
Formation is predominantly shale and fine micaceous sand-
stone, with siltstone, sandstone, and conglomerate. The oldest
rocks that crop out in the study area are in the Harrell Shale
Formation. The Mahantango Formation, which is composed
predominantly of thick laminated marine shale, siltstone, sand-
stone, and some limestone (Cardwell and others, 1968), does
not crop out within the study area, but immediately underlies
the Harrell Shale. The Marcellus Shale, which also does not
crop out in the study area but is the primary emphasis of this
study, underlies the Mahantango Formation and is composed
of predominantly gray black to black thinly laminated pyritic
shales (Cardwell and others, 1968).
Mississippian-age strata include parts of the Price
Formation, the Greenbrier Group, and the Bluefield, Hinton,
Princeton Sandstone, and Bluestone Formations (fig. 3). The
Price Formation is composed predominantly of hard massive
sandstones with some shale. The Price Formation was previ-
ously referred to as the Pocono Group but was later revised
as a result of additional stratigraphic studies. Some older
geologic maps, as well as the USGS National Water Informa-
tion System (NWIS) database still refer to the Price Formation
as the Pocono Group. The Greenbrier Group is composed of
massive marine limestones with associated shales and minor
sandstone beds. Outside the study area, the Greenbrier Group
is one of the more prominent karst regions in West Virginia.
The Bluefield and Hinton Formations are composed of shale
and sandstone with minor interbeds of limestone. The Blue-
stone Formation and Princeton Sandstone are composed
predominantly of shale and sandstone. The Bluefield, Hinton,
and Bluestone Formations, and the Princeton Sandstone, are
thin exposures in the outcrop and are commonly collectively
referred to, and shown on the accompanying geologic map
(fig. 3), as the Mauch Chunk Group.
Pennsylvanian-age strata within the study area include
important coal seams, such as the Pittsburgh, Freeport, Kit-
tanning, and Sewickley seams. Pennsylvanian-age strata
in the study area include parts of the New River Forma-
tion, Kanawha Formation, Allegheny Formation, Conem-
augh Group, Monongahela Group, and the Dunkard Group
(fig. 3). In the northeast part of the study area the deposi-
tional sequence thins, and the Pocahontas, New River, and
Kanawha Formations are collectively referred to as the
Pottsville Group (fig. 3). The Pottsville Group is composed
of sandstones and some conglomerate with thin shales and
coal seams. Where the New River and Kanawha Formations
crop out in sufficient area, they are mapped separately from
the Pottsville Group (fig. 3). The New River and Kanawha
Formations are composed of sandstone with some shale,
siltstone, and coal. The Allegheny Formation is composed
of cyclic sequences of sandstone, siltstone, shale, limestone,
and coal. The more economically relevant coal seams in the
Allegheny Formation are the Freeport, Kittanning, and Clar-
ion coal seams. The Conemaugh Group is composed of cyclic
sequences of shale, siltstone, sandstone, thin limestones, and
coal. Economically important coal seams in the Conemaugh
Group are the Bakerstown, Brush Creek, and Mahoning coal
seams. The Monongahela Group is also composed predomi-
nantly of sandstone, siltstone, shale, limestone, and coal. Eco-
nomically important coal seams in the Monongahela Group
are the Pittsburgh, Sewickley, Uniontown, Waynesburg, and
Redstone coal seams.
There is debate about the geologic age of the Dunkard
Group, but it occurs either at the top of the stratigraphic
sequence of Pennsylvanian strata or at the base of Permian
strata. The Dunkard Group is composed of sandstone, silt-
stone, shale, limestone, and coal similar to that of most of the
Pennsylvanian-age strata. Economically important coal seams
in the Dunkard Group are the Washington and Waynesburg A
coal seams.
Because this report presents baseline water-quality
conditions in the Marcellus Shale gas field of the Mononga-
hela River Basin in West Virginia, and because the Marcellus
Shale does not crop out in the study area, a discussion of the
depth of burial of the Marcellus Shale within the study area
is warranted. The USGS recently published geologic cross
sections that encompass the study area (Ryder and others,
2008; 2009). On the basis of these cross sections, the depth
to the Marcellus Shale may be inferred. The Marcellus Shale
ranges in depth from approximately 7,100 feet below land
surface (bls) in Marion County, West Virginia, where rocks
are slightly dipping, to 4,200 feet bls along the crest of the
Deer Park–Leadmine anticline in Preston County, and to only
1,400 feet bls along the crest of the Elkins Valley Anticline
in Randolph County, West Virginia, based on the geologic
cross sections. The geologic cross sections indicate that
thrust faults cut through the Marcellus Shale and extend to
the surface.
8   Water quality in the Marcellus Shale Gas Field of the Monongahela River Basin, West Virginia, 2011–12
WESTON
ELKINS
MORGANTOWN
CLARKSBURG
BUCKHANNON
WESTON
ELKINS
MORGANTOWN
CLARKSBURG
BUCKHANNON
BasefromU.S.GeologicalSurvey,1:200,000,digitallinegraphicsGeologyfromCardwellandothers,1968
SurficialGeology
Quaternaryalluvium
DunkardGroup
MonongahelaGroup
ConemaughGroup
AlleghenyFormation
KanawhaFormation
NewRiverFormation
PottsvilleGroup
MauchChunkGroup
HintonFormation
BluefieldFormationandPrincetonSandstone
BluefieldFormation
GreenbrierGroup
PoconoGroup
HampshireFormation
ChemungGroup
BrallierFormation
HarrellShaleFormation
MonongahelaRiverBasinboundary
EXPLANATION
020MILES
020KILOMETERS
79°30'80°80°30'81°81°30'
39°30'
39°
38°30'
Areaofdetail
WV
PA
OH
KY
VA
MD
Figure3. GeologicmapoftheMonongahelaRiverBasininWestVirginia.
Introduction   9
Land Use
Forest is the most extensive land use in the study area.
Agriculture is generally limited and of low intensity (National
Agricultural Statistics Service, 2014). The study area includes
the cities of Morgantown and Clarksburg, West Virginia,
and their suburbs. Morgantown and the surrounding area is
among the fastest growing in West Virginia; the population of
Morgantown increased 4.5 percent between 2010 and 2012,
in contrast to a population growth of 0.2 percent for West
Virginia as a whole (U.S. Census Bureau, 2014).
Coal mining was the principal industry in the study area
for most of the 20th century. The most important mined coal
seams in the study area, underground and surface (fig. 4),
are near the western edge, especially within the Dunkard
and Monongahela Groups and the Allegheny Formation. The
Pittsburgh coal seam is the most historically productive and
economically important seam in the study area (Tewalt and
others, 2001). The Kittanning, Freeport, Sewickley, Redstone,
and Bakerstown coals have also been extensively mined, and
at least 15 named coal seams have been mined in the study
area. Approximately 16.5 percent of the study area has been
mined. Most mines are underground (15.0 % of the study
area), and the remainder are either surface mines (2.8 % of
the study area) or auger mines (0.02 % of the study area),
both of which may overlay underground mines. Many areas
have been mined multiple times, using multiple methods, or
in more than one seam, so that the two-dimensional footprint
of mining is an inadequate measure of mining intensity. Most
of the coal mined in the study area has high sulfur concen-
trations (>2.5 percent), and demand for the high-sulfur coal
mined here declined following a mandate in the 1991 Clean
Air Act amendments to reduce acid precipitation (Milici and
Dennen, 2009).
The hydrologic and water-quality effects of both under-
ground and surface mining in the study area are well docu-
mented (Anderson and others, 2000; Cravotta, 2008a–b). Acid
mine drainage (AMD) from coal mining has had major effects
on the quality of water in streams in the region. A variety of
acid mine drainage treatment techniques are being used within
the study area, and water quality has improved since in the
1970s (Lambert and others, 2004). Continued treatment is nec-
essary to maintain water quality in many places where mining
has ended. Typical water-quality effects of coal mining in the
study area include increases in concentrations of iron, manga-
nese, aluminum, and sulfate.
Hydrologic effects of coal mining include several impor-
tant alterations to the movement of water and the magnitude
and timing of flow. In underground coal mines, water flows
downdip along the mine floor, even in areas where the dip is
slight. If the mined seam is above grade, or higher than the
valley floor, water is transferred from the updip side of the
mountain to the downdip side (Kozar and others, 2013). If
the mined seam is below grade, or if it dips from above grade
on its uphill side to below grade on the downdip side, water
collects in a pool in the void space in a mine (McColloch and
others, 2012). Where mining is active, the water is pumped
to the surface and discharged. Even after mining ends, water
from mine pools may reach land surface through openings if
hydraulic head is sufficient.
Recent development of the Marcellus Shale by hori-
zontal drilling and hydraulic fracturing has increased inter-
est in natural gas development, but gas has been produced
in the study area for decades. Nearly 6,400 gas wells had
been completed in the study area through 2012 (fig. 2; West
Virginia Department of Environmental Protection, 2013). The
earliest recorded completion date for these wells is during
1895, but completion dates are unknown for most wells drilled
before permitting began in 1929. At least 29 named forma-
tions have been the targets for gas development in the study
area, although the target formation for many older wells is not
recorded. Beginning about 2002, the targeting of multiple for-
mations in a single well became common. Through September
2012, 147 wells had been completed in the Marcellus Shale
within the study area, 75 of which are horizontal wells.
Both current oil and gas extraction and the legacy effects
of improperly abandoned oil and gas wells have affected
groundwater and surface-water quality in the region. Natural
gas in West Virginia is typically associated with sediments of
marine origin, so gas typically is found in association with
salty water (Price and others, 1937). Salt and other elements
of marine origin are among the common constituents that have
become elevated in surface or shallow water as a result of gas
development (Bain, 1970). Changes to water quality related to
gas development may result from initial surface disturbances,
such as site, access road, and pipeline construction; from drill-
ing and fracturing activities; and from maintenance or recla-
mation activities, such as condensate spills. For conventional
wells in West Virginia, activities that may affect water quality
include onsite disposal of drilling waste, a practice that was
banned for horizontal wells by the West Virginia Natural Gas
Horizontal Well Control Act (22-6A-2). Improperly sealed gas
wells are known to be a pathway for contaminants to migrate
upward from deep rock layers (Bain, 1970), although saline
groundwater is naturally as close as 300 feet beneath the sur-
face of some river valleys in the study area (Wilmoth, 1975;
Foster, 1980). Of the gas wells in the study area, 215 have a
regulatory status of “abandoned,” meaning that they are no
longer in production but were never sealed and reclaimed.
Underground coal mines and deeper oil and gas reser-
voirs both produce methane, which has the potential to migrate
either by natural processes or potentially as a result of human
activities. The isotopic composition, associated ion chemistry,
and compositions of associated hydrocarbons can be used to
identify the potential source of the gas. Coal-bed methane
lacks the associated higher chain hydrocarbons, such as eth-
ane, propane, butane, pentane, and hexane, that may be associ-
ated with gases derived from oil and gas reservoirs. Much of
10   Water quality in the Marcellus Shale Gas Field of the Monongahela River Basin, West Virginia, 2011–12
WESTON
ELKINS
MORGANTOWN
CLARKSBURG
BUCKHANNON
WESTON
ELKINS
MORGANTOWN
CLARKSBURG
BUCKHANNON
BasefromU.S.GeologicalSurvey,1:200,000,digitallinegraphicsCoalmineboundariesfromWestVirginiaGeologicalandEconomicSurvey,2011b
EXPLANATION
Minetype
Augermine
Highwallmine
Surfacemine
Undergroundmine
MonongahelaRiverBasinboundary
020MILES
020KILOMETERS
79°30'80°80°30'81°81°30'
39°30'
39°
38°30'
Areaofdetail
WV
PA
OH
KY
VA
MD
Figure4. CoalminesintheMonongahelaRiverBasinandadjacentareasinWestVirginia.
Introduction   11
the most active development of the Marcellus Shale targets
“wet” gas, or gas rich in ethane and other higher alkanes.
The study area also includes natural gas storage fields (U.S.
Energy Information Agency, 2014). Although the gas presently
stored in these fields is increasingly from the Marcellus Shale,
the storage fields hold mixtures of natural gas from a wide
variety of sources and locations (U.S. Energy Information
Agency, 2004).
Methods of Study
Baseline water-quality conditions were documented
through sampling a combination of wells, springs, and stream
sites. Because additives to hydraulic fracturing fluids are
variable and decrease in flowback water over a relatively
short time, water-quality analyses for this study documented
major ions, trace elements, radionuclides, and isotopes
(table 1) that can be used to identify the different sources of
water—potable water derived from shallow aquifers, water
derived from contact with the Marcellus Shale (flowback
from hydraulic fracturing or formation water), and water with
constituents from other oil and gas fields, sewage effluent, and
coal-mine drainage.
Site Selection
Groundwater and surface-water base-flow quality in the
Monongahela River Basin was investigated in 2011 and 2012
to establish baseline water-quality conditions for the study
area. Wells were sampled in summer 2011, and surface water
was sampled, under base-flow conditions, in summer and
fall 2012.
Groundwater
Groundwater samples were collected from 39 wells and
2 springs in the Monongahela River Basin in West Virginia
(fig. 5, table 2). The sites were selected from a group of wells
and springs sampled as part of the West Virginia Ambient
Groundwater Monitoring network (Chambers and others,
2012), and information was obtained from a database of
production wells maintained by the West Virginia Bureau for
Public Health. The groundwater survey sites were selected
to provide wide areal distribution throughout the study area.
However, the distribution of production wells was not suf-
ficient to provide adequate areal coverage. Therefore, samples
were also collected from domestic wells, USGS water-level
network wells, other types of wells, or springs to provide addi-
tional geographic coverage in areas with few production wells.
The criteria for a well to be considered for sampling were
as follows: (1) the well had to be less than 25 years old, (2) the
well had to have a minimum reported yield of 5 gallons per
minute, and (3) the well had to be plumbed or open to allow
sampling of raw water prior to any storage tank or treatment.
The minimum information required for each well included
well depth, location (latitude/longitude), and contributing
geologic unit (aquifer). Available well-construction informa-
tion was recorded (age, depth, and casing length). An on-site
inspection was conducted to verify well-casing integrity and
adequate well-pad construction to prevent surface contami-
nants from entering the well bore. Existing submersible pumps
were most commonly used for water-sample collection, but for
a small number of wells, turbine pumps, jet pumps, or a porta-
ble submersible pump were used. Well and site characteristics
were obtained during a site visit, from drilling logs, and from
well-owner records, where available. If both the minimum
criteria and the minimum information requirements were met,
the well was selected for sampling. The springs were selected
for sampling to supplement geographic coverage in areas with
few production wells. The springs selected had been previ-
ously sampled and documented (Chambers and others, 2012;
Kozar and Brown, 1995).
Surface Water
Surface-water sites were selected using a stratified design
on the basis of availability of historical data, basin size and
location, Marcellus Shale thickness (Schwietering and Bocan,
2011; West Virginia Geological and Economic Survey, 2011a),
and the presence of gas production from wells tapping the
Marcellus Shale (West Virginia Geological and Economic
Survey, 2014a) in the hydrologic unit in which the stream is
located. To be considered for sampling, a site had to have at
least one previous sample collected by the USGS that was
analyzed for a full set of major ions and had an associated
streamflow measurement. The drainage basins for the sites
were limited to a range of 10–40 mi2
. Within the study area, 59
surface-water sites met these criteria. Sites were grouped on
the basis of gas production at the 12-digit hydrologic unit code
(HUC-12) basin level (U.S. Geological Survey, 2005a). Sites
were not necessarily at the outlet of the HUC-12. Gas produc-
tion data, in thousand cubic feet (Mcf), were downloaded from
the West Virginia Geological and Economic Survey (WVGES,
2012) Marcellus Shale webpage (http://www.wvgs.wvnet.
edu/www/datastat/devshales.htm) on June 4, 2012, and were
complete through 2010 at that time. Production data include
information on wells targeting multiple formations, only one
of which was the Marcellus Shale. “Marcellus wells,” as used
in this section, includes all of these gas wells.
The surface-water sites were grouped into “bins” that
were designated as “High Production,” “Low Production,”
“Near High Production,” “Near Low Production,” “Underlain
by the Marcellus Shale greater than 50 feet thick” (Marcellus
>50 ft thick), and “Underlain by Marcellus Shale less than 50
ft thick” (Marcellus <50 ft thick). The break point between
high and low production was 1,000 thousand cubic feet per
square mile per year (Mcf/mi2
/year). The Near High Produc-
tion bin included sites in a 10-digit hydrologic unit code basin
(HUC-10) with gas production exceeding 1,000 Mcf/mi2
/year
from Marcellus Shale wells and a site in a HUC-12 with no
gas production from Marcellus Shale wells.
12   Water quality in the Marcellus Shale Gas Field of the Monongahela River Basin, West Virginia, 2011–12
Table 1.  Water-quality properties, major ions, trace elements, naturally occurring radioactive materials, and dissolved gases
analyzed for in groundwater and surface-water samples from the Marcellus Shale baseline survey, Monongahela River Basin,
West Virginia, 2011–12.
[NA, not applicable; °C, degrees Celsius; µS/cm, microsiemens per centimeter; mg/L, milligrams per liter; FNU, formazin nephelometric units;
CaCO3
, calcium carbonate; wf, filtered water sample; inflect pt, inflection-point titration; µg/L, micrograms per liter; Cs-137, cesium 137; Th-230, thorium
230; pCi/L, picocuries per liter; δ, per mil; 13
C, carbon-13, 18
O, oxygen-18; 2
H, deuterium; 34
S, sulfur-34; CH4, methane; DIC, dissolved inorganic carbon;
H2O, water; SO4, sulfate; --, none; *, groundwater samples only]
Constituent or property Reporting limit Constituent or property Reporting limit
Temperature, water, °C NA Molybdenum, wf, µg/L 0.014
Specific conductance, µS/cm at 25 °C NA Nickel, wf, µg/L 0.09
Dissolved oxygen, mg/L NA Silver, wf, µg/L 0.005
pH, standard units NA Strontium, wf, µg/L 0.2–0.8
Redox potential, mV* NA Zinc, wf, µg/L 2.0
Turbidity, FNU NA Antimony, wf, µg/L 0.027
Dissolved solids, dry, at 180 °C, mg/L 12 Aluminum, wf, µg/L 1.7–2.2
Alkalinity, wf, inflect, field, mg/L CaCO3
1 Selenium, wf, µg/L 0.05
Carbonate, wf, inflect pt, field, mg/L 1 Gross beta, wf, Cs-137, pCi/L 4
Bicarbonate, wf, inflect pt, field, mg/L 1 Alpha activity, wf, Th-230, pCi/L 3
Calcium, wf, mg/L 0.022–0.04 Uranium, wf, µg/L 0.004
Magnesium, wf, mg/L 0.08 Uranium-238, wf, pCi/L 0.1
Sodium, wf, mg/L 0.1–0.24 Uranium-234, wf, pCi/L 0.1
Potassium, wf, mg/L 0.022 Uranium-235, wf, pCi/L 0.1
Bromide, wf, mg/L 0.010 Radium-224, wf, pCi/L 1
Chloride, wf, mg/L 0.02–0.06 Radium-226, wf, pCi/L 1
Sulfate, wf, mg/L 0.07–0.09 Radium-228, wf, pCi/L 1
Fluoride, wf, mg/L 0.04 δ13
CCH4
* --
Silica, wf, mg/L 0.018–0.029 δ13
CDIC
* --
Arsenic, wf, µg/L 0.02–0.10 δ18
OH2O
* --
Barium, wf, µg/L 0.07 δ18
OSO4
* --
Beryllium, wf, µg/L 0.006 δ2
HCH4
* --
Boron, wf, µg/L 3.0 δ2
HH2O
* --
Cadmium, wf, µg/L 0.016 δ34
SSO4
* --
Chromium, wf, µg/L 0.06–0.07 Nitrogen, N2
, dissolved, mg/L 0.001
Cobalt, wf, µg/L 0.02 Oxygen, O2
, dissolved, mg/L 0.002
Copper, wf, µg/L 0.5–0.8 Argon, dissolved, mg/L 0.003
Iron, wf, µg/L 3.2 Carbon dioxide, dissolved, mg/L 0.04
Lead, wf, µg/L 0.015–0.025 Methane, dissolved, mg/L 0.001
Manganese, wf, µg/L 0.04
Introduction   13
Tay-0130
Har-0177
Bar-0150
Pre-0178
Pre-0172
Pre-0164
Pre-0177
Bar-0149
Har-0175
Lew-0215
Lew-0221
Ran-0278
Ran-0284
Pre-0173Pre-0166
Pre-0124
Tuc-0125
Ran-0260
Tuc-0129Tuc-0124
Tuc-0127
Ups-0177
Ran-0275
Ran-0259
Har-0170
Lew-0218
Har-0173
Tay-0129
Mar-0300
Mar-0296
Ran-0282
Ups-0178
Ran-0280
Ran-0277
Ran-0276
Pre-0176
Pre-0162
Pre-0163
Mng-0582
Bar-0151s
Ran-0261
(NorthSpringatBowden,WV)
WESTON
ELKINS
MORGANTOWN
CLARKSBURG
BUCKHANNON
WESTON
ELKINS
MORGANTOWN
CLARKSBURG
BUCKHANNON
BasefromU.S.GeologicalSurvey,1:200,000,digitallinegraphicsCoalmineboundariesfromWestVirginiaGeologicalandEconomicSurvey,2011b
EXPLANATION
MonongahelaRiverBasinboundary
Groundwatersurveysiteandidentifier
020MILES
020KILOMETERS
Ups-0177
79°30'80°80°30'81°81°30'
39°30'
39°
38°30'
Areaofdetail
WV
PA
OH
KY
VA
MD
Figure5. GroundwatersurveysitesintheMonongahelaRiverBasin,WestVirginia,June–September2011.
14   Water quality in the Marcellus Shale Gas Field of the Monongahela River Basin, West Virginia, 2011–12
Table 2.  Site information for wells and springs sampled for the groundwater survey as part of the Marcellus Shale baseline
survey, Monongahela River Basin, West Virginia, June–September 2011.
[WV, West Virginia; Marcellus<50, site in basin underlain by a less than 50-foot Marcellus Shale thickness and neither a gas producing basin nor adja-
cent to a gas producing basin; NA, not applicable]
Local well name Geologic unit name1
Well or spring Well depth, in feet Natural gas production bin
Mng-0582 Pottsville Group Well 190 Near production
Pre-0163 Pottsville Group Well 179 Marcellus<50
Pre-0162 Pottsville Group Well 145 Production
Pre-0176 Conemaugh Group Well 200 Near production
Ran-0276 Hampshire Formation Well 320 Not near production
Ran-0277 New River Formation Well 220 Not near production
Ran-0280 Kanawha Formation Well 80 Production
Ups-0178 Kanawha Formation Well 158 Production
Ran-0282 Kanawha Formation Well 105 Production
Mar-0296 Dunkard Group Well 107 Production
Mar-0300 Dunkard Group Well 70 Near production
Tay-0129 Conemaugh Group Well 113 Production
Har-0173 Dunkard Group Well 70 Production
Lew-0218 Monongahela Group Well 60 Near production
Har-0170 Conemaugh Group Well 75 Near production
Ran-0259 Pottsville Group Well 155 Near production
Ran-0275 Kanawha Formation Well 500 Production
Ran-0261(North Spring at Bowden, WV) Greenbrier Group Spring NA Not near production
Ups-0177 Pottsville Group Well 120 Production
Tuc-0127 Chemung Group Well 60 Not near production
Tuc-0124 Greenbrier Group Well 100 Marcellus<50
Tuc-0129 Greenbrier Group Well 45 Marcellus<50
Ran-0260 Price Formation Well 222 Production
Tuc-0125 Greenbrier Group Well 250 Marcellus<50
Pre-0124 Chemung Group Well 205 Not near production
Pre-0166 Price Formation Well 100 Marcellus<50
Pre-0173 Conemaugh Group Well 57 Not near production
Ran-0284 Hampshire Formation Well 200 Marcellus<50
Ran-0278 Chemung Group Well 100 Not near production
Lew-0221 Conemaugh Group Well 100 Production
Lew-0215 Monongahela Group Well 100 Near production
Har-0175 Conemaugh Group Well 45 Near production
Bar-0149 Conemaugh Group Well 180 Production
Pre-0177 Greenbrier Group Well 145 Marcellus<50
Pre-0164 Greenbrier Group Well 207 Marcellus<50
Pre-0172 Allegheny Formation Well 65 Production
Pre-0178 Conemaugh Group Well NA Production
Bar-0150 Conemaugh Group Well 52 Production
Har-0177 Monongahela Group Well 150 Production
Tay-0130 Conemaugh Group Well 160 Not near production
Bar-0151s Conemaugh Group Spring NA Near production
1
Geologic nomenclature used in this report conforms with that used by the West Virginia Geological and Economic Survey, as depicted on the 1968
State geologic map of West Virginia (Cardwell and others, 1968).
Introduction   15
The number of sampling sites in a bin was made propor-
tional to the ratio of the area of the binned HUC-12s within the
study area. For instance, High Production HUC-12s made up
17.2 percent of the basin, so 17.2 percent of the sites had to be
from that bin. Since 17.2 percent of 50 is 8.6 and sites could
only be selected in increments of integers, the number of sites
in that bin was rounded to 9. The category Marcellus <50 ft
thick was eliminated from the study because all available sites
were underlain by the Marcellus Shale at less than 2 ft thick
and judged to be unlikely candidates for future development.
The Marcellus <50 ft thick bin made up 10 percent of the
overall study area, and the five sites that would have repre-
sented this bin were allocated to the Near High Production bin.
After setting up the bins, sites were prioritized by assign-
ing at least one site from each HUC-10 that was represented,
then at least one site in each HUC-12 until the bins filled up
(fig. 6). If the only available sites for a bin were within the
same HUC-12, then multiple sites from that HUC-12 were
used. This was done by assigning random numbers to sites
within HUC-10s, and then within HUC-12s, and ranking them
by the random numbers. Sites were then sorted by (1) bin,
(2) HUC-10 rank, (3) HUC-12 rank, and (4) random number,
and ordered within bins. Sites with within-bin rank less than or
equal to the number of sites per bin were included in the study,
and the next site in rank was assigned as the alternate. Using
this procedure, two sites were selected in close proximity on
the same stream; one site with three samples collected during
1979–80, and the other with an active streamgage, 64 years of
flow data, and numerous water-quality measurements (fig. 7).
Both sites drain between 10 mi2
and 20 mi2
. Although this
procedure ranked the ungaged site higher, the streamgage
site was selected for sampling. Finally, during sampling, field
crews visited one of the selected sites shortly after limestone
sand had been applied to treat acid mine drainage. That site
was dropped from the study and replaced by a site in the
same bin but with a drainage area of 40.7 mi2
, which was
slightly greater than the original size criterion (table 3, at end
of report).
Sampling Methods
Both groundwater and base-flow samples were collected
and processed according to standard USGS operating pro-
cedures and protocols. All samples were analyzed for field
properties, alkalinity, major ions, trace elements, and uranium
(table 1). Field measurements of water temperature, specific
conductance, dissolved oxygen concentration, pH, alkalin-
ity, and, for groundwater sites, redox potential were made on
site according to standard protocols (U.S. Geological Survey,
2006). Samples were processed according to standard USGS
protocol (Wilde and others, 2004). Water samples for cat-
ion analysis were filtered through a 0.45-micron (μm) filter,
collected in an acid-rinsed 250-milliliter (mL) polyethylene
bottle, and acidified with 2 mL of nitric acid. Water samples
for anion analysis were collected in a 250-mL polyethylene
bottle. Water samples for uranium and radium isotope analysis
were collected in a 1-liter (L) polyethylene bottle. If uranium
was detected in a sample, that sample was further analyzed for
uranium and radium isotopes.
Analyses for major ions, trace elements, and naturally
occurring radioactive materials (NORM) were conducted at
the USGS National Water Quality Laboratory (NWQL) in
Denver, Colorado. Stable isotope analyses were performed
at the West Virginia University Stable Isotope Laboratory
in Morgantown, West Virginia, and Isotech Laboratories in
Champaign, Illinois. Dissolved gas samples were analyzed at
the USGS Dissolved Gas Laboratory in Reston, Virginia.
Groundwater Sampling
Groundwater samples were collected between June 28
and September 21, 2011. Prior to sampling, wells were purged
to remove standing water from the well and ensure that rep-
resentative water samples were collected. A minimum of one
well volume was purged from most wells; high-use produc-
tion wells that did not require purging or low-yielding wells
that would not recover from purging were pumped until field
properties stabilized. Field measurements of dissolved oxygen,
pH, specific conductance, water temperature, and turbidity
were monitored during purging by using a multi-parameter
water-quality meter, which was calibrated daily. Water level
was also monitored where possible. Sample tubing typically
was connected to a ¾-in. hose bib as close to the wellhead as
possible, and pumps were kept on to prevent sample contami-
nation from the plumbing or from backflow from holding
tanks. Existing plumbing and well-casing materials included,
but were not limited to, steel, galvanized steel, copper, polyvi-
nyl chloride (PVC), and other plastics. The purging procedure
prescribed was assumed to have prevented contamination from
plumbing materials. Samples were collected after field proper-
ties stabilized, according to standard USGS protocols for the
collection of water-quality data (U. S. Geological Survey,
2006). Each of the sampled springs discharges into a collec-
tion basin, and samples from springs were collected using
a peristaltic pump to draw water from the collection basin.
Subsurface-dip samples were collected from the spring’s col-
lection basin for dissolved gas analyses. Field properties were
measured in the collection basin before and during sample
collection to monitor the stability of the spring’s discharge. To
prevent environmental contamination, samples typically were
collected and processed inside a mobile field laboratory or a
portable chamber assembled near the well or the spring.
Base-Flow Sampling
Base-flow samples were collected from 50 sites in the
Monongahela River Basin during seasonal base-flow condi-
tions between July 31 and October 26, 2012. Samples were
collected using methods described in the USGS National
Field Manual for the collection of Water-Quality Data (U.S.
Geological Survey, 2006). Where possible, depth- and
16   Water quality in the Marcellus Shale Gas Field of the Monongahela River Basin, West Virginia, 2011–12
Wastheproductionin
thesameHUC12asthe
site?
Wastheproductionin
thesameHUC12asthe
site?
Allstreamsitesinthe
MonongahelaRiverBasin
withinWestVirginia
Atleastoneprevious
USGSsamplewith
major-ionchemistry?
UnderlainbyMarcellus
Shalewithaverage
thickness<2feet?
InsideHUC10with
gasproductionfrom
Marcelluswells?
DidHUC10gas
productionexceed
1,000MCF/mi2
/yr?
Between10mi2
and40mi2
drainagearea?
AtleastoneUSGS
samplewithmajor-ion
chemistry?
UnderlainbyMarcellus
Shaleanaverageof
>50feetthick?
Part1—Developmentoftiers
Part2—Selectionofsiteswithinbins
LowProduction(LP)
(7sites)
Near-LowProduction(NearLP)
(12sites)
HighProduction(HP)
(9sites)
Near-HighProduction(NearHP)
7sites
UnderlainbyMarcellusshale
greaterthan50feetthick
(15sites)
UnderlainbyMarcellusshale
lessthan50feetthick
(nosites)
Assignedatleastonesitefromeach
HUC10byrandomnumber
Assignedatleastonesitefromeach
HUC12byrandomnumber
Wheretheonlyavailablesitesfor
abinwerewithinthesameHUC12,
usemultiplesiteswithinthatHUC12,
rankedbyrandomnumber
Eliminatedfromconsideration
Yes
Yes
Yes
Yes
Yes
No
No
Yes
No
No
No
No
Yes
No
Yes
No
Yes
No
Marcellusgasproductionbins
Figure6. Flowchartshowingtheprocessforstratifyingstream-watersamplingsites.
Introduction   17
WVFk
ElkCk
PolkCk
LostCk
MillCk
SandyCk
SandyCk
TeterCk
RightFk
FilesCk
BeckyCk
SalemCk
PylesFk
GladyFk
PecksRun
DollsRun
BrushyFk
LaurelFk
FrenchCk
GnattyCk
IndianCkIndianCk
DeckersCk
BuffaloCkTenmileCk
LeadingCk
HusteadFk
PawPawCk
TenmileCk
LaurelRun
MinearRun
RoaringCk
CloverRun
HackersCk
SimpsonCk
SaltlickCk
FreemansCk
MiracleRun
WhitedayCk
BingamonCk
PrickettsCk
ChenowethCk
HorseshoeRun
NorthFkBlackwater
RightFkBuckhannon
TygartatValleyHead
WestFkatWalkersville
SandRunnearBuckhannon
LeftFkBuckhannonatCzar
LeftFkBuckhannonatPalaceValley
BasefromU.S.GeologicalSurvey,1:200,000,digitallinegraphicsMarcellusShalewellsandgasproductiondatafromWestVirginiaGeologicalandEconomicSurvey,2011b
020MILES
020KILOMETERS
EXPLANATION
MarcellusShalegasproductionbin
HighProduction
LowProduction
NearHighProduction
NearLowProduction
UnderlainbyMarcellusgreaterthan50feetthick
UnderlainbyMarcelluslessthan50feetthick
Level-12hydrologicunitboundary
Stream
SamplingsiteandlocalidentifierPylesFk
79°30'80°80°30'81°81°30'
39°30'
39°
38°30'
Areaofdetail
WV
PA
OH
KY
VA
MD
Figure7. Streams,streamsamplingsites,gaswellscompletedintheMarcellusShalethrough2012showinggasproductionthrough2010,andaverage
thicknessoftheMarcellusShalebyHUC-12.
18   Water quality in the Marcellus Shale Gas Field of the Monongahela River Basin, West Virginia, 2011–12
width-integrated samples were collected using a DH-81
isokinetic sampler. Where site conditions did not support the
use of a DH-81, such as insufficient stream depth or velocity,
samples were collected at multiple points using an open-
mouthed bottle. Sample aliquots were composited in a churn
splitter and processed according to standard USGS protocols
(U.S. Geological Survey, 2006). Field properties of water
temperature, specific conductance, dissolved oxygen concen-
tration, pH, alkalinity, and stream discharge were measured at
the time of sample collection.
Methods of Analysis
The results of the groundwater survey and base-flow
survey were examined for geospatial and statistical rela-
tions. The geospatial and statistical analyses of the water-
chemistry results were conducted to discern patterns in these
data. Details of these analyses are described in the following
two sections.
Geospatial Analyses
The wells and springs sampled and the associated water-
chemistry data were assessed for spatial trends by loading the
data into ArcMap, a geographic information system (GIS) tool
for analysis of geospatial data. Additional geospatial data were
used to assess potential factors that could affect groundwater
quality in the region. The geospatial data included (1) location
of current and legacy coal mines obtained from the WVGES
(West Virginia Geological and Economic Survey, 2011b),
(2) location of current active or recently completed Marcellus
Shale gas wells (from WVGES, West Virginia Geological and
Economic Survey, 2014a), (3) geologic maps of the study area
with significant surficial and deeper structural features such
as faults and folds (from WVGES), (4) location of current
and historical oil and gas wells (from WVGES), (5) elevation
data from the USGS National Elevation Dataset, (6) stream
coverages from the USGS National Hydrography Dataset
(NHD), and (7) basin characteristics derived from the USGS
NHD database.
Statistical Analyses
Descriptive and summary statistics were calculated using
Spotfire S-PLUS 8.1 statistical and graphing software (TIBCO
Software, Inc., 2008). Descriptive and summary statistics for
censored data sets, those with values less than the reporting
level, were calculated using the Regression on Order Sta-
tistics (ROS) and adjusted maximum likelihood estimation
(AMLE) techniques (TIBCO Software Inc., 2008). Statistics
were not calculated for sample sets of less than 10 data points.
Kruskal-Wallis rank test was used for comparison of medians
among groups. A Tukey’s Honest-Significant-Difference post
hoc test was used for multiple comparisons. Relations among
several variables were analyzed through Principal Compo-
nents Analysis (PCA). Analysis of groundwater-quality data
for geochemical processes was performed using the PCA in
Spotfire S-PLUS 8.1 statistical and graphing software.
Quality Assurance
Quality-assurance samples, blanks, and replicates were
collected during both the groundwater sampling and the
surface-water base-flow sampling. Blank samples are used to
determine the extent to which sampling procedures may con-
taminate samples, thereby biasing analytical results. Replicate
samples are used to determine the variability inherent in the
collection and analysis of environmental samples. Together,
blank and replicate samples can be used to characterize the
accuracy and precision of water-quality data. All quality-
assurance samples were collected and processed according
to protocols described in the USGS National Field Manual
for the Collection of Water-Quality Data (U.S. Geological
Survey, 2006).
Blank Samples
A combination of equipment blanks and field blanks was
used to identify and quantify potential sources of contamina-
tion. An equipment blank consists of a volume of water of
known quality that is processed through the sampling equip-
ment in a laboratory environment. A field blank consists of a
volume of water processed through the sampling equipment
under the same field conditions in which the samples were
processed, typically a mobile field laboratory.
Replicate Samples
Comparison of results among replicate samples can pro-
vide insight into the sources of variability that are inherent in
sample collection, processing, and analysis. Sample-collection
protocols (U.S. Geological Survey, 2006) for groundwater and
base-flow samples have been developed to produce a sample
that is representative of the sampled well, spring, or stream.
If the appropriate sampling procedures have been used, it is
assumed that the water being collected is representative of
the sampled environment and that any variability among the
main and replicate sample is primarily attributable to sample
processing and analysis (Koterba and others, 1995).
Variability for a replicate sample pair was quantified by
calculating the relative percent difference (RPD) of the sam-
ples. The RPD was calculated using the following formula:
R1 − R2
R1 + R2
2
⎛
⎝⎜
⎞
⎠⎟
⎛
⎝
⎜
⎜
⎜
⎞
⎠
⎟
⎟
⎟
×100,
where R1
is the concentration of the analyte in the first repli-
cate sample and R2
is the concentration of the analyte in the
second replicate sample. Generally, concentrations in replicate
sample pairs differed by small amounts, typically less than
15 percent RPD.
Water Quality in the Monongahela River Basin    19
Quality-Assurance Results
Groundwater Samples
An equipment blank was collected prior to collection of
groundwater samples in 2011. The blank sample was analyzed
using the same analytical suite as the environmental samples.
The only analyte present in this blank at a detectable concen-
tration was cobalt, at 0.052 micrograms per liter (µg/L); the
detection was confirmed through a re-analysis of the sample.
The detection appears anomalous because cobalt concentra-
tions in 15 of the 41 environmental samples processed using
this equipment were lower than the concentrations detected in
the blank sample.
Replicate samples were collected at two sites, Har-0177
and Ran-0259 (table 2), during the groundwater survey.
In general, the replicate samples were in good agreement,
with most analyses within 5 percent RPD. All values for the
Har-0177 sample pair were within 15 percent RPD. How-
ever, the replicate samples from Ran-0259 differed by more
than 15 percent RPD for aluminum and arsenic. The alu-
minum results for the Ran-0259 sample pair were 3.4 µg/L
and 2.1 µg/L, a difference of 47 percent RPD. The reporting
level for aluminum analysis using this method was 1.7 µg/L.
However, the long-term minimum detection level (LTMDL)
for this method is 2.2 µg/L, a value calculated using data from
the period this sample pair was analyzed. The sample pair
results for arsenic were 0.1 µg/L and 0.08 µg/L, a difference of
22 percent RPD with a reporting level of 0.04 µg/L.
Base-Flow Samples
Field blank samples were collected at the Tygart Valley
River at Valley Head and the Elk Creek at Romines Mills sites.
Lead was the only analyte detected in the Tygart Valley River
blank with a concentration of 0.027 µg/L, 0.002 µg/L greater
than the method reporting level of 0.025 mg/L. Lead was
not detected in the environmental sample collected from the
Tygart Valley River. Both silica and cobalt were detected in
the Elk Creek blank, silica at 0.043 milligrams per liter (mg/L)
and cobalt 0.038 µg/L, analytes with laboratory reporting
limits of 0.018 mg/L and 0.021 µg/L, respectively. The silica
concentration in the blank is much lower than the minimum
environmental concentration of 1.68 mg/L measured and
two orders of magnitude less than the median environmental
concentration. It is unlikely silica contamination significantly
affected the analysis of any environmental sample or the inter-
pretation of the data. Cobalt concentrations in environmental
samples ranged from 0.043 to 20.6 µg/L. The cobalt concen-
trations in samples collected in the weeks immediately prior
to collection of the blank sample were an order of magnitude
greater than concentrations for the blank. The Tygart Valley
River blank, which had no detectable cobalt, was processed
the week following the Elk Creek blank. The presence of
cobalt at a detectable concentration in the Elk Creek blank is
unlikely to affect the interpretation of cobalt data.
A replicate sample was collected at Little Sandy Creek at
Evansville, W.Va. A replicate sample consists of two samples
collected from the same sampling location at the same time.
Replicate samples chiefly provide data on variability associ-
ated with sampling and analytical methods. The replicate
sample pair agreed well; concentrations for 32 of 37 analytes
in both samples differed by less than 5 percent RPD. Only one
analyte in this sample pair, molybdenum, differed by greater
than 15 percent RPD, at17 percent RPD. The concentrations
of molybdenum for the sample pair were 0.019 µg/L and
0.016 µg/L, and the reporting level was 0.014 µg/L.
Water Quality in the Monongahela
River Basin
The baseline water-quality assessment of that part of the
Monongahela River Basin underlain by the Marcellus Shale
consisted of a groundwater survey and a base-flow survey. The
results of both surveys were compared to historical water-
quality data for the study area stored in NWIS databases. His-
torical data used for comparison to the base-flow survey data
were restricted to samples collected during the same season,
July through October. For the base-flow survey results, further
comparisons were made among gas-production bins described
in the section “Surface Water” under “Site Selection.” Owing
to the small number of sites in some of the bins, a simpli-
fied classification structure was used consisting of only three
bins— Production, basins with high or low gas production;
Near Production, basins without gas production but adjacent to
production basins; and Not Near Production, basins under-
lain by greater than a 50-ft thickness of the Marcellus Shale
but neither producing gas nor adjacent to a Marcellus Shale
gas-producing basin. Groundwater-survey sites were binned
using the same basin designation as that used for the base-flow
survey with the addition of a fourth group “Marcellus <50”
for groundwater sites not in basins underlain by at least a 50-ft
thickness of the Marcellus shale. These comparisons reflect
both temporal and current land-use patterns. The results of this
study can be found in data tables included in the appendixes
for this report; groundwater survey results are in Appendix 1,
and the base-flow survey results are in Appendix 2.
Specific Conductance, Total Dissolved Solids,
and pH
Specific conductance and pH of groundwater and
surface water provide a general indication of water quality
and can affect other chemical constituents present by affect-
ing solubility, partitioning, and valence states. Although
much of the variability of specific conductance and pH in
groundwater is due to natural factors, human activities, such
20   Water quality in the Marcellus Shale Gas Field of the Monongahela River Basin, West Virginia, 2011–12
as coal mining, also contribute to this variability (McAuley
and Kozar, 2006). Total dissolved solids, the concentration of
dissolved substances in water, is often highly correlated with
specific conductance.
Specific Conductance
Specific conductance, the ability of water to conduct an
electrical current, is dependent upon the amount of dissolved
ions present in the water. Specific conductance in ground-
water samples ranged from 44 microsiemens per centimeter
at 25 degrees Celsius (µS/cm) to 794 µS/cm, with a median
value of 295 µS/cm. In the base-flow survey samples, specific
conductance ranged from 56 µS/cm to 5,380 µS/cm with a
median value of 280 µS/cm (table 4). It is worth noting that
although the minimum and median specific conductance
values for the groundwater and base-flow surveys are similar,
the maximum value for the groundwater survey is an order
of magnitude lower than the median value for the base-flow
survey. Specific conductance did not differ significantly from
historical values in either the groundwater survey or the base-
flow survey (fig. 8). Specific conductance varied significantly
among the base-flow survey gas-production bins (Kruskal-
Wallis test, p = 0.011) with the highest values in the Produc-
tion bin (fig. 9). The groundwater production bins did not
differ in regard to specific conductance (p = 0.435).
Table 4.  Statistical summary of water-quality field measurements and major ions in samples collected for the groundwater
survey and base-flow survey as part of the Marcellus Shale baseline survey, Monongahela River Basin, West Virginia, 2011–12.
[µS/cm, microsiemens per centimeter at 25 degrees Celsius; mg/L, milligrams per liter; wf, filtered sample; SMCL, secondary maximum contaminant
level (U.S. Environmental Protection Agency, 2009); <, less than; NA, not applicable]
Constituent
Reporting
unit
Method
reporting level
Survey
Minimum
value
Maximum
value
Median
value
SMCL
pH Standard unit NA
Groundwater 4.5 9.4 7
6.5–8.5
Base flow 4.8 8.7 7.7
Specific conductance µS/cm NA
Groundwater 44 794 295
NA
Base flow 56 5,380 280
Total dissolved solids mg/L 12
Groundwater <12 522 168
NA
Base flow 37 4,380 171
Calcium, wf mg/L 0.022–0.04
Groundwater 0.672 91 16.9
NA
Base flow 5.51 291 28.3
Magnesium, wf mg/L 0.08
Groundwater 0.105 19.1 4.07
NA
Base flow 1.26 86.3 28.3
Potassium, wf mg/L 0.022
Groundwater 0.43 2.9 1.17
NA
Base flow 0.66 8.85 1.98
Sodium, wf mg/L 0.1–0.24
Groundwater 0.46 186 17.2
NA
Base flow 0.89 949 8.31
Bicarbonate, wf mg/L 1.
Groundwater 2.3 382 99.8
NA
Base flow <1 401 65
Chloride, wf mg/L 0.02–0.06
Groundwater 0.57 67.6 9.42
250
Base flow 0.87 100 6.94
Bromide, wf mg/L 0.010
Groundwater <0.01 0.598 0.027
NA
Base flow 0.014 0.692 0.031
Fluoride, wf mg/L 0.04
Groundwater <0.04 1.85 0.1
4
Base flow <0.04 0.27 .06
Sulfate, wf mg/L 0.07–0.9
Groundwater <0.09 231 10.18
250
Base flow 3.42 2,640 9.1
Water Quality in the Monongahela River Basin    21
(59)(41) (254)(50)
75th percentile
25th percentile
Median (50th percentile)
1.5 times interquartile range
Number of samples
-1.5 times interquartile range
Outlier
(50)
EXPLANATION
10
100
1,000
10,000
A
10
100
1,000
10,000
B
2011 survey Historical 2012 survey Historical
Groundwater samples Base-flow samples
Specificconductance,inmicrosiemenspercentimeter
at25degreesCelsius
Specificconductance,inmicrosiemenspercentimeter
at25degreesCelsius
Figure 8.  Distribution of specific conductance for samples collected as part of the Marcellus Shale baseline study, 2011–12, and
historical specific conductance for samples collected in the Monongahela River Basin, West Virginia: A, groundwater samples and B,
base-flow samples.
75th percentile
25th percentile
Median (50th percentile)
1.5 times interquartile range
Number of samples
-1.5 times interquartile range
Outlier
(8)
EXPLANATION
A
10
100
1,000
10,000
10
100
1,000
10,000
B
Notnearproduction
Marcellus,lessthan50feet
Production
Nearproduction
Notnearproduction
Production
Nearproduction
Groundwater samples Base-flow samples
Specificconductance,inmicrosiemenspercentimeter
at25degreesCelsius
Specificconductance,inmicrosiemenspercentimeter
at25degreesCelsius
(16)(8) (8) (9) (17)(20)(13)
Figure 9.  Distribution of specific conductance for samples collected as part of the Marcellus Shale baseline study, Monongahela River
Basin, West Virginia, 2011–12, grouped by gas production type: A, groundwater samples and B, base-flow samples.
22   Water quality in the Marcellus Shale Gas Field of the Monongahela River Basin, West Virginia, 2011–12
Total Dissolved Solids
Concentrations of total dissolved solids in groundwa-
ter survey samples ranged from less than the reporting level
of 12 mg/L to 522 mg/L with a median value of 168 mg/L.
Concentrations of total dissolved solids in base-flow survey
samples ranged from 37 mg/L to 4,380 mg/L with a median
of 171 mg/L (table 4), the same as the median groundwater
concentration. As with specific conductance, there are no
significant differences between historical data and either
groundwater survey or base-flow survey data. Also, as was the
case for specific conductance, total dissolved solids concentra-
tions in base-flow survey samples varied significantly by gas-
production bin (Kruskal-Wallis test, p = 0.019). The highest
concentrations were in the Production bin, and there were no
significant differences among the groundwater survey gas-
production bins.
pH
The pH of a solution plays an important role in the solu-
bility of metals. The pH of the groundwater survey samples
ranged from 4.5 to 9.4 with a median of 7.0. The pH of base-
flow survey samples ranged from 4.8 to 8.7 with a median
of 7.7 (table 4). The U.S. Environmental Protection Agency
(EPA) has established a secondary maximum contaminant
level (SMCL) for pH. The SMCL is a recommendation based
on aesthetic effects, primarily taste, that ideally pH would fall
within the range of 6.5 to 8.5 (U.S. Environmental Protection
Agency, 2009). A total of 14 samples fell outside the SMCL
range—9 groundwater samples, (6 samples were less than
6.5 and 3 samples exceeded 8.5) and 5 base-flow samples
(2 samples were less than 6.5 and 3 samples exceeded 8.5).
Values of pH in samples collected for the 2011ground-
water survey did not differ significantly from values of the
historical data (fig. 10). However, pH measured during the
2012 base-flow survey was significantly higher than histori-
cal values (Kruskal-Wallis test, p < 0.001). The difference
between base-flow survey pH values and historical pH values
is most likely attributable to changes in coal-mining practices
and acid-mine-drainage treatment that have occurred between
the 2012 and historical surveys. Among base-flow survey
samples, pH values in the Production bin were higher than
those in the Not Near Production bin (Kruskal-Wallis test,
p = 0.097) (fig. 11A). There was no difference among ground-
water survey bins (Kruskal-Wallis test, p = 0.252) (fig. 11B).
Major Ions
The major ions calcium, magnesium, potassium, sodium,
bicarbonate from field alkalinity, chloride, and sulfate exert
a strong influence on, and are strongly influenced by, geo-
chemical and anthropogenic processes. Patterns in major ion
composition were examined by determination of water type, as
well as comparison of historical and 2011–12 survey data. For
the base-flow survey samples, further comparisons were made
among the gas-production bins.
The relative proportion of major ions in natural waters
is the basis for classifying samples by water type. Water
(59)(41) (236)(50)
75th percentile
25th percentile
Median (50th percentile)
1.5 times interquartile range
Number of samples
-1.5 times interquartile range
Outlier
(50)
EXPLANATION
3
5
4
10
A
3
4
5
6
8
7
6
7
8
9 9
10
B
pH,instandardunits
pH,instandardunits
2011 survey Historical
Groundwater samples
2011 survey Historical
Base-flow samples
Figure 10.  Distribution of pH in samples collected as part of the Marcellus Shale baseline study, 2011–12, and historical pH
in samples from the Monongahela River Basin, West Virginia: A, groundwater samples and B, base-flow samples.
Water Quality in the Monongahela River Basin    23
75th percentile
25th percentile
Median (50th percentile)
1.5 times interquartile range
Number of samples
-1.5 times interquartile range
Outlier
(50)
EXPLANATION
4
5
10
A
4
5
6
8
7
6
7
8
9 9
10
B
pH,instandardunits
pH,instandardunits
Notnearproduction
Marcellus,lessthan50feet
Production
Nearproduction
Notnearproduction
Production
Nearproduction
Groundwater samples Base-flow samples
(16)(8) (8) (9) (17)(20)(13)
Figure 11.  Distribution of pH in samples collected as part of the Marcellus Shale baseline study in the Monongahela River Basin,
West Virginia, 2011–12: A, groundwater samples and B, base-flow samples.
samples with a specific cation or anion constituting more than
one-half the total cations or anions can be classified by water
type, calcium-carbonate type water for example (Hem, 1985).
However, waters in which no single cation or anion constitutes
greater than one-half of the total cations or anions are classed
as mixed-type waters (Hem, 1985).
Major-ion composition of the water for the 41 ground-
water samples was predominantly either a calcium-bicar-
bonate type or a sodium-bicarbonate type (fig. 12A). A few
wells exhibited other signatures, however, including 3 wells
(2 completed in the Pottsville Group and one in the Kanawha
Formation) that exhibited a calcium-sulfate signature and
1 well (completed in the Allegheny Formation) that exhibited
a sodium-sulfate signature. Wells completed in the Green-
brier Group exhibited a strong calcium-bicarbonate signature,
which is expected because the Greenbrier Limestone is a
significant karst bedrock-forming unit in the study area.
The major ion composition of the groundwater sur-
vey samples (fig. 12A) is similar to that found in a study of
groundwater downgradient from reclaimed surface mines
and in unmined areas in Pennsylvania and West Virginia
(McAuley and Kozar, 2006), part of which was conducted in
the Monongahela River Basin. In that study, median chloride
concentrations for mined and un-mined areas were 5.1 mg/L
and 7.3 mg/L, respectively; median sodium concentrations
for mined and unmined areas were 9.35 mg/L and 18.0 mg/L,
respectively. Median calcium concentrations for mined and
unmined areas were 35.9 mg/L and 21.0 mg/L, respectively,
and median magnesium concentrations for mined and unmined
areas were 9.9 mg/L and 4.4 mg/L, respectively. Median chlo-
ride concentrations for wells sampled as part of the current
study were slightly higher (table 4) at 9.42 mg/L.
Salt waters and brines are found as shallow as 300 feet
below land surface in certain valleys in Pennsylvanian- and
Permian-aged aquifers (Wilmoth, 1975). Chloride and
bromide concentrations can be indicative of salt waters
and brines. Chloride concentrations in groundwater survey
samples ranged from 0.57 mg/L to 67.6 mg/L with a median
value of 9.42 mg/L, and bromide ranged from less than the
reporting level of 0.010 mg/L to 0.598 mg/L with a median
value of 0.027 mg/L. The relative concentrations of chlo-
ride and bromide can be used to characterize sources of salt
waters and brines because bromide concentrations are greater
than chloride concentrations in deep brines (Hem, 1985).
24   Water quality in the Marcellus Shale Gas Field of the Monongahela River Basin, West Virginia, 2011–12
EXPLANATION
Dunkard Group
Monongahela Group
Conemaugh Group
Allegheny Formation
Kanawha Formation
New River Formation
Pottsville Group
Greenbrier Group
Price Formation
Hampshire Formation
Chemung Group
EXPLANATION
Near Production
Not Near Production
Production
Percent
Calcium
100
80
60
40
20
0
0
20
40
60
80
100
Magnesium
0
20
40
60
80
100
Sodiumpluspotassium
Chloride plus fluoride
0
20
40
60
80
100
100
80
60
40
20
0
Carbonateplusbicarbonate
100
80
60
40
20
0
Sulfate
0
20
40
60
80
100
Sulfatepluschloride
0
20
40
60
80
100
Calciumplusmagnesium
100
80
60
40
20
0
100
80
60
40
20
0
Percent
Percent
Percent
Calcium
100
80
60
40
20
0
0
20
40
60
80
100
Magnesium
0
20
40
60
80
100
Sodiumpluspotassium
Chloride, fluoride. nitrite, plus nitrate
0
20
40
60
80
100
100
80
60
40
20
0
Carbonateplusbicarbonate
100
80
60
40
20
0
Sulfate
0
20
40
60
80
100
Sulfatepluschloride
0
20
40
60
80
100
Calciumplusmagnesium
100
80
60
40
20
0
100
80
60
40
20
0
Percent
Percent
A
B
Figure 12.  Piper diagrams showing major ion composition of samples collected as part
of the Marcellus Shale baseline study, 2011–12, from the Monongahela River Basin, West
Virginia: A, groundwater survey samples classified by geologic formation and B, base-flow
survey samples.
USGS Report: Water Quality in Mon River Basin Shows No Harm from Marcellus Shale Drilling

Contenu connexe

Similaire à USGS Report: Water Quality in Mon River Basin Shows No Harm from Marcellus Shale Drilling

Trends in Hydraulic Fracturing Distributions and Treatment Fluids, Additives,...
Trends in Hydraulic Fracturing Distributions and Treatment Fluids, Additives,...Trends in Hydraulic Fracturing Distributions and Treatment Fluids, Additives,...
Trends in Hydraulic Fracturing Distributions and Treatment Fluids, Additives,...Marcellus Drilling News
 
Kleindl CV_academic_current
Kleindl CV_academic_currentKleindl CV_academic_current
Kleindl CV_academic_currentWilliam Kleindl
 
Conrad_Clark_McMains_Grant_Proposal-2
Conrad_Clark_McMains_Grant_Proposal-2Conrad_Clark_McMains_Grant_Proposal-2
Conrad_Clark_McMains_Grant_Proposal-2Dan Conrad
 
USGS Report on Water Withdrawals from 3 Reservoirs in Eastern Ohio for Fracking
USGS Report on Water Withdrawals from 3 Reservoirs in Eastern Ohio for FrackingUSGS Report on Water Withdrawals from 3 Reservoirs in Eastern Ohio for Fracking
USGS Report on Water Withdrawals from 3 Reservoirs in Eastern Ohio for FrackingMarcellus Drilling News
 
Water Your Opinions- A Social Assessment of the Lake Bloomington (1)
Water Your Opinions- A Social Assessment of the Lake Bloomington (1)Water Your Opinions- A Social Assessment of the Lake Bloomington (1)
Water Your Opinions- A Social Assessment of the Lake Bloomington (1)Mark Spurgis
 
Water Your Opinions- A Social Assessment of the Lake Bloomington (1)
Water Your Opinions- A Social Assessment of the Lake Bloomington (1)Water Your Opinions- A Social Assessment of the Lake Bloomington (1)
Water Your Opinions- A Social Assessment of the Lake Bloomington (1)Mark Spurgis
 
SRBC Report: Water Use Associated with Natural Gas Development
SRBC Report: Water Use Associated with Natural Gas DevelopmentSRBC Report: Water Use Associated with Natural Gas Development
SRBC Report: Water Use Associated with Natural Gas DevelopmentMarcellus Drilling News
 
Water Resource Reporting and Water Footprint from Marcellus Shale Development...
Water Resource Reporting and Water Footprint from Marcellus Shale Development...Water Resource Reporting and Water Footprint from Marcellus Shale Development...
Water Resource Reporting and Water Footprint from Marcellus Shale Development...Brian Rosa
 
Water: The Potential Consequences of Global Warming for Water Resources in USA
Water: The Potential Consequences of Global Warming for Water Resources in USAWater: The Potential Consequences of Global Warming for Water Resources in USA
Water: The Potential Consequences of Global Warming for Water Resources in USAEric832w
 
Cranberries and Water Quality_Nov2023 (1).pdf
Cranberries and Water Quality_Nov2023 (1).pdfCranberries and Water Quality_Nov2023 (1).pdf
Cranberries and Water Quality_Nov2023 (1).pdfssuser2deb1c1
 
ProjetoUrucuia_W2_TroyGilmore_english
ProjetoUrucuia_W2_TroyGilmore_englishProjetoUrucuia_W2_TroyGilmore_english
ProjetoUrucuia_W2_TroyGilmore_englishequipeagroplus
 
Think Science: Geoscience and Groundwater
Think Science: Geoscience and GroundwaterThink Science: Geoscience and Groundwater
Think Science: Geoscience and GroundwaterTexasPublicRadio
 
Salt Management Guide for Landscape Irrigation with Recycled Water in Coastal...
Salt Management Guide for Landscape Irrigation with Recycled Water in Coastal...Salt Management Guide for Landscape Irrigation with Recycled Water in Coastal...
Salt Management Guide for Landscape Irrigation with Recycled Water in Coastal...Fiona9864
 
Cyclone design
Cyclone design Cyclone design
Cyclone design mkpq pasha
 
CBE 4030 - Kushog Lake Report (1)
CBE 4030 - Kushog Lake Report (1)CBE 4030 - Kushog Lake Report (1)
CBE 4030 - Kushog Lake Report (1)Emily McDonald
 
Vestraten central asia unescoundpgef water meeting 022014
Vestraten central asia unescoundpgef water meeting 022014Vestraten central asia unescoundpgef water meeting 022014
Vestraten central asia unescoundpgef water meeting 022014groundwatercop
 

Similaire à USGS Report: Water Quality in Mon River Basin Shows No Harm from Marcellus Shale Drilling (20)

Trends in Hydraulic Fracturing Distributions and Treatment Fluids, Additives,...
Trends in Hydraulic Fracturing Distributions and Treatment Fluids, Additives,...Trends in Hydraulic Fracturing Distributions and Treatment Fluids, Additives,...
Trends in Hydraulic Fracturing Distributions and Treatment Fluids, Additives,...
 
Kleindl CV_academic_current
Kleindl CV_academic_currentKleindl CV_academic_current
Kleindl CV_academic_current
 
Conrad_Clark_McMains_Grant_Proposal-2
Conrad_Clark_McMains_Grant_Proposal-2Conrad_Clark_McMains_Grant_Proposal-2
Conrad_Clark_McMains_Grant_Proposal-2
 
USGS Report on Water Withdrawals from 3 Reservoirs in Eastern Ohio for Fracking
USGS Report on Water Withdrawals from 3 Reservoirs in Eastern Ohio for FrackingUSGS Report on Water Withdrawals from 3 Reservoirs in Eastern Ohio for Fracking
USGS Report on Water Withdrawals from 3 Reservoirs in Eastern Ohio for Fracking
 
BARRERA-THESIS-2015
BARRERA-THESIS-2015BARRERA-THESIS-2015
BARRERA-THESIS-2015
 
Rommwatt_Thesis
Rommwatt_ThesisRommwatt_Thesis
Rommwatt_Thesis
 
Managing Water for Increased Resiliency of Drained Agricultural Landscapes
Managing Water for Increased Resiliency of Drained Agricultural LandscapesManaging Water for Increased Resiliency of Drained Agricultural Landscapes
Managing Water for Increased Resiliency of Drained Agricultural Landscapes
 
Water Your Opinions- A Social Assessment of the Lake Bloomington (1)
Water Your Opinions- A Social Assessment of the Lake Bloomington (1)Water Your Opinions- A Social Assessment of the Lake Bloomington (1)
Water Your Opinions- A Social Assessment of the Lake Bloomington (1)
 
Water Your Opinions- A Social Assessment of the Lake Bloomington (1)
Water Your Opinions- A Social Assessment of the Lake Bloomington (1)Water Your Opinions- A Social Assessment of the Lake Bloomington (1)
Water Your Opinions- A Social Assessment of the Lake Bloomington (1)
 
Giuffria_JM_T_2016
Giuffria_JM_T_2016Giuffria_JM_T_2016
Giuffria_JM_T_2016
 
SRBC Report: Water Use Associated with Natural Gas Development
SRBC Report: Water Use Associated with Natural Gas DevelopmentSRBC Report: Water Use Associated with Natural Gas Development
SRBC Report: Water Use Associated with Natural Gas Development
 
Water Resource Reporting and Water Footprint from Marcellus Shale Development...
Water Resource Reporting and Water Footprint from Marcellus Shale Development...Water Resource Reporting and Water Footprint from Marcellus Shale Development...
Water Resource Reporting and Water Footprint from Marcellus Shale Development...
 
Water: The Potential Consequences of Global Warming for Water Resources in USA
Water: The Potential Consequences of Global Warming for Water Resources in USAWater: The Potential Consequences of Global Warming for Water Resources in USA
Water: The Potential Consequences of Global Warming for Water Resources in USA
 
Cranberries and Water Quality_Nov2023 (1).pdf
Cranberries and Water Quality_Nov2023 (1).pdfCranberries and Water Quality_Nov2023 (1).pdf
Cranberries and Water Quality_Nov2023 (1).pdf
 
ProjetoUrucuia_W2_TroyGilmore_english
ProjetoUrucuia_W2_TroyGilmore_englishProjetoUrucuia_W2_TroyGilmore_english
ProjetoUrucuia_W2_TroyGilmore_english
 
Think Science: Geoscience and Groundwater
Think Science: Geoscience and GroundwaterThink Science: Geoscience and Groundwater
Think Science: Geoscience and Groundwater
 
Salt Management Guide for Landscape Irrigation with Recycled Water in Coastal...
Salt Management Guide for Landscape Irrigation with Recycled Water in Coastal...Salt Management Guide for Landscape Irrigation with Recycled Water in Coastal...
Salt Management Guide for Landscape Irrigation with Recycled Water in Coastal...
 
Cyclone design
Cyclone design Cyclone design
Cyclone design
 
CBE 4030 - Kushog Lake Report (1)
CBE 4030 - Kushog Lake Report (1)CBE 4030 - Kushog Lake Report (1)
CBE 4030 - Kushog Lake Report (1)
 
Vestraten central asia unescoundpgef water meeting 022014
Vestraten central asia unescoundpgef water meeting 022014Vestraten central asia unescoundpgef water meeting 022014
Vestraten central asia unescoundpgef water meeting 022014
 

Plus de Marcellus Drilling News

Five facts about shale: it’s coming back, and coming back strong
Five facts about shale: it’s coming back, and coming back strongFive facts about shale: it’s coming back, and coming back strong
Five facts about shale: it’s coming back, and coming back strongMarcellus Drilling News
 
Quarterly legislative action update: Marcellus and Utica shale region (4Q16)
Quarterly legislative action update: Marcellus and Utica shale region (4Q16)Quarterly legislative action update: Marcellus and Utica shale region (4Q16)
Quarterly legislative action update: Marcellus and Utica shale region (4Q16)Marcellus Drilling News
 
Access Northeast Pipeline Project - Dec 2016 Update
Access Northeast Pipeline Project - Dec 2016 UpdateAccess Northeast Pipeline Project - Dec 2016 Update
Access Northeast Pipeline Project - Dec 2016 UpdateMarcellus Drilling News
 
Rover Pipeline Letter to FERC Requesting Final Certificate
Rover Pipeline Letter to FERC Requesting Final CertificateRover Pipeline Letter to FERC Requesting Final Certificate
Rover Pipeline Letter to FERC Requesting Final CertificateMarcellus Drilling News
 
DOE Order Granting Elba Island LNG Right to Export to Non-FTA Countries
DOE Order Granting Elba Island LNG Right to Export to Non-FTA CountriesDOE Order Granting Elba Island LNG Right to Export to Non-FTA Countries
DOE Order Granting Elba Island LNG Right to Export to Non-FTA CountriesMarcellus Drilling News
 
LSE Study: Fracking is Revitalizing U.S. Manufacturing
LSE Study: Fracking is Revitalizing U.S. ManufacturingLSE Study: Fracking is Revitalizing U.S. Manufacturing
LSE Study: Fracking is Revitalizing U.S. ManufacturingMarcellus Drilling News
 
Letter From 24 States Asking Trump & Congress to Withdraw the Unlawful Clean ...
Letter From 24 States Asking Trump & Congress to Withdraw the Unlawful Clean ...Letter From 24 States Asking Trump & Congress to Withdraw the Unlawful Clean ...
Letter From 24 States Asking Trump & Congress to Withdraw the Unlawful Clean ...Marcellus Drilling News
 
Report: New U.S. Power Costs: by County, with Environmental Externalities
Report: New U.S. Power Costs: by County, with Environmental ExternalitiesReport: New U.S. Power Costs: by County, with Environmental Externalities
Report: New U.S. Power Costs: by County, with Environmental ExternalitiesMarcellus Drilling News
 
U.S. Crude Oil and Natural Gas Proved Reserves, Year-end 2015
U.S. Crude Oil and Natural Gas Proved Reserves, Year-end 2015U.S. Crude Oil and Natural Gas Proved Reserves, Year-end 2015
U.S. Crude Oil and Natural Gas Proved Reserves, Year-end 2015Marcellus Drilling News
 
U.S. EIA's Drilling Productivity Report - December 2015
U.S. EIA's Drilling Productivity Report - December 2015U.S. EIA's Drilling Productivity Report - December 2015
U.S. EIA's Drilling Productivity Report - December 2015Marcellus Drilling News
 
Velocys Plan to "Build the Business" - Gas-to-Liquids Plants
Velocys Plan to "Build the Business" - Gas-to-Liquids PlantsVelocys Plan to "Build the Business" - Gas-to-Liquids Plants
Velocys Plan to "Build the Business" - Gas-to-Liquids PlantsMarcellus Drilling News
 
PA DEP Revised Permit for Natural Gas Compression Stations, Processing Plants...
PA DEP Revised Permit for Natural Gas Compression Stations, Processing Plants...PA DEP Revised Permit for Natural Gas Compression Stations, Processing Plants...
PA DEP Revised Permit for Natural Gas Compression Stations, Processing Plants...Marcellus Drilling News
 
PA DEP Permit for Unconventional NatGas Well Site Operations and Remote Piggi...
PA DEP Permit for Unconventional NatGas Well Site Operations and Remote Piggi...PA DEP Permit for Unconventional NatGas Well Site Operations and Remote Piggi...
PA DEP Permit for Unconventional NatGas Well Site Operations and Remote Piggi...Marcellus Drilling News
 
PA DEP: Methane Reduction Strategies for Natural Gas Operations
PA DEP: Methane Reduction Strategies for Natural Gas OperationsPA DEP: Methane Reduction Strategies for Natural Gas Operations
PA DEP: Methane Reduction Strategies for Natural Gas OperationsMarcellus Drilling News
 
US EIA's December 2016 Short-Term Energy Outlook
US EIA's December 2016 Short-Term Energy OutlookUS EIA's December 2016 Short-Term Energy Outlook
US EIA's December 2016 Short-Term Energy OutlookMarcellus Drilling News
 
Northeast Gas Association's 2016 Statistical Guide
Northeast Gas Association's 2016 Statistical GuideNortheast Gas Association's 2016 Statistical Guide
Northeast Gas Association's 2016 Statistical GuideMarcellus Drilling News
 
PA PUC Responses to Auditor General's Act 13 Impact Fee Audit
PA PUC Responses to Auditor General's Act 13 Impact Fee AuditPA PUC Responses to Auditor General's Act 13 Impact Fee Audit
PA PUC Responses to Auditor General's Act 13 Impact Fee AuditMarcellus Drilling News
 
Pennsylvania Public Utility Commission Act 13/Impact Fees Audit by PA Auditor...
Pennsylvania Public Utility Commission Act 13/Impact Fees Audit by PA Auditor...Pennsylvania Public Utility Commission Act 13/Impact Fees Audit by PA Auditor...
Pennsylvania Public Utility Commission Act 13/Impact Fees Audit by PA Auditor...Marcellus Drilling News
 
Clyde Mine Discharge/Tenmile Creek Water Quality Final Report
Clyde Mine Discharge/Tenmile Creek Water Quality Final ReportClyde Mine Discharge/Tenmile Creek Water Quality Final Report
Clyde Mine Discharge/Tenmile Creek Water Quality Final ReportMarcellus Drilling News
 
FERC Order Denying Stay of Kinder Morgan's Broad Run Expansion Project
FERC Order Denying Stay of Kinder Morgan's Broad Run Expansion ProjectFERC Order Denying Stay of Kinder Morgan's Broad Run Expansion Project
FERC Order Denying Stay of Kinder Morgan's Broad Run Expansion ProjectMarcellus Drilling News
 

Plus de Marcellus Drilling News (20)

Five facts about shale: it’s coming back, and coming back strong
Five facts about shale: it’s coming back, and coming back strongFive facts about shale: it’s coming back, and coming back strong
Five facts about shale: it’s coming back, and coming back strong
 
Quarterly legislative action update: Marcellus and Utica shale region (4Q16)
Quarterly legislative action update: Marcellus and Utica shale region (4Q16)Quarterly legislative action update: Marcellus and Utica shale region (4Q16)
Quarterly legislative action update: Marcellus and Utica shale region (4Q16)
 
Access Northeast Pipeline Project - Dec 2016 Update
Access Northeast Pipeline Project - Dec 2016 UpdateAccess Northeast Pipeline Project - Dec 2016 Update
Access Northeast Pipeline Project - Dec 2016 Update
 
Rover Pipeline Letter to FERC Requesting Final Certificate
Rover Pipeline Letter to FERC Requesting Final CertificateRover Pipeline Letter to FERC Requesting Final Certificate
Rover Pipeline Letter to FERC Requesting Final Certificate
 
DOE Order Granting Elba Island LNG Right to Export to Non-FTA Countries
DOE Order Granting Elba Island LNG Right to Export to Non-FTA CountriesDOE Order Granting Elba Island LNG Right to Export to Non-FTA Countries
DOE Order Granting Elba Island LNG Right to Export to Non-FTA Countries
 
LSE Study: Fracking is Revitalizing U.S. Manufacturing
LSE Study: Fracking is Revitalizing U.S. ManufacturingLSE Study: Fracking is Revitalizing U.S. Manufacturing
LSE Study: Fracking is Revitalizing U.S. Manufacturing
 
Letter From 24 States Asking Trump & Congress to Withdraw the Unlawful Clean ...
Letter From 24 States Asking Trump & Congress to Withdraw the Unlawful Clean ...Letter From 24 States Asking Trump & Congress to Withdraw the Unlawful Clean ...
Letter From 24 States Asking Trump & Congress to Withdraw the Unlawful Clean ...
 
Report: New U.S. Power Costs: by County, with Environmental Externalities
Report: New U.S. Power Costs: by County, with Environmental ExternalitiesReport: New U.S. Power Costs: by County, with Environmental Externalities
Report: New U.S. Power Costs: by County, with Environmental Externalities
 
U.S. Crude Oil and Natural Gas Proved Reserves, Year-end 2015
U.S. Crude Oil and Natural Gas Proved Reserves, Year-end 2015U.S. Crude Oil and Natural Gas Proved Reserves, Year-end 2015
U.S. Crude Oil and Natural Gas Proved Reserves, Year-end 2015
 
U.S. EIA's Drilling Productivity Report - December 2015
U.S. EIA's Drilling Productivity Report - December 2015U.S. EIA's Drilling Productivity Report - December 2015
U.S. EIA's Drilling Productivity Report - December 2015
 
Velocys Plan to "Build the Business" - Gas-to-Liquids Plants
Velocys Plan to "Build the Business" - Gas-to-Liquids PlantsVelocys Plan to "Build the Business" - Gas-to-Liquids Plants
Velocys Plan to "Build the Business" - Gas-to-Liquids Plants
 
PA DEP Revised Permit for Natural Gas Compression Stations, Processing Plants...
PA DEP Revised Permit for Natural Gas Compression Stations, Processing Plants...PA DEP Revised Permit for Natural Gas Compression Stations, Processing Plants...
PA DEP Revised Permit for Natural Gas Compression Stations, Processing Plants...
 
PA DEP Permit for Unconventional NatGas Well Site Operations and Remote Piggi...
PA DEP Permit for Unconventional NatGas Well Site Operations and Remote Piggi...PA DEP Permit for Unconventional NatGas Well Site Operations and Remote Piggi...
PA DEP Permit for Unconventional NatGas Well Site Operations and Remote Piggi...
 
PA DEP: Methane Reduction Strategies for Natural Gas Operations
PA DEP: Methane Reduction Strategies for Natural Gas OperationsPA DEP: Methane Reduction Strategies for Natural Gas Operations
PA DEP: Methane Reduction Strategies for Natural Gas Operations
 
US EIA's December 2016 Short-Term Energy Outlook
US EIA's December 2016 Short-Term Energy OutlookUS EIA's December 2016 Short-Term Energy Outlook
US EIA's December 2016 Short-Term Energy Outlook
 
Northeast Gas Association's 2016 Statistical Guide
Northeast Gas Association's 2016 Statistical GuideNortheast Gas Association's 2016 Statistical Guide
Northeast Gas Association's 2016 Statistical Guide
 
PA PUC Responses to Auditor General's Act 13 Impact Fee Audit
PA PUC Responses to Auditor General's Act 13 Impact Fee AuditPA PUC Responses to Auditor General's Act 13 Impact Fee Audit
PA PUC Responses to Auditor General's Act 13 Impact Fee Audit
 
Pennsylvania Public Utility Commission Act 13/Impact Fees Audit by PA Auditor...
Pennsylvania Public Utility Commission Act 13/Impact Fees Audit by PA Auditor...Pennsylvania Public Utility Commission Act 13/Impact Fees Audit by PA Auditor...
Pennsylvania Public Utility Commission Act 13/Impact Fees Audit by PA Auditor...
 
Clyde Mine Discharge/Tenmile Creek Water Quality Final Report
Clyde Mine Discharge/Tenmile Creek Water Quality Final ReportClyde Mine Discharge/Tenmile Creek Water Quality Final Report
Clyde Mine Discharge/Tenmile Creek Water Quality Final Report
 
FERC Order Denying Stay of Kinder Morgan's Broad Run Expansion Project
FERC Order Denying Stay of Kinder Morgan's Broad Run Expansion ProjectFERC Order Denying Stay of Kinder Morgan's Broad Run Expansion Project
FERC Order Denying Stay of Kinder Morgan's Broad Run Expansion Project
 

Dernier

KAHULUGAN AT KAHALAGAHAN NG GAWAING PANSIBIKO.pptx
KAHULUGAN AT KAHALAGAHAN NG GAWAING PANSIBIKO.pptxKAHULUGAN AT KAHALAGAHAN NG GAWAING PANSIBIKO.pptx
KAHULUGAN AT KAHALAGAHAN NG GAWAING PANSIBIKO.pptxjohnandrewcarlos
 
2024 04 03 AZ GOP LD4 Gen Meeting Minutes FINAL.docx
2024 04 03 AZ GOP LD4 Gen Meeting Minutes FINAL.docx2024 04 03 AZ GOP LD4 Gen Meeting Minutes FINAL.docx
2024 04 03 AZ GOP LD4 Gen Meeting Minutes FINAL.docxkfjstone13
 
28042024_First India Newspaper Jaipur.pdf
28042024_First India Newspaper Jaipur.pdf28042024_First India Newspaper Jaipur.pdf
28042024_First India Newspaper Jaipur.pdfFIRST INDIA
 
TDP As the Party of Hope For AP Youth Under N Chandrababu Naidu’s Leadership
TDP As the Party of Hope For AP Youth Under N Chandrababu Naidu’s LeadershipTDP As the Party of Hope For AP Youth Under N Chandrababu Naidu’s Leadership
TDP As the Party of Hope For AP Youth Under N Chandrababu Naidu’s Leadershipanjanibaddipudi1
 
HARNESSING AI FOR ENHANCED MEDIA ANALYSIS A CASE STUDY ON CHATGPT AT DRONE EM...
HARNESSING AI FOR ENHANCED MEDIA ANALYSIS A CASE STUDY ON CHATGPT AT DRONE EM...HARNESSING AI FOR ENHANCED MEDIA ANALYSIS A CASE STUDY ON CHATGPT AT DRONE EM...
HARNESSING AI FOR ENHANCED MEDIA ANALYSIS A CASE STUDY ON CHATGPT AT DRONE EM...Ismail Fahmi
 
AI as Research Assistant: Upscaling Content Analysis to Identify Patterns of ...
AI as Research Assistant: Upscaling Content Analysis to Identify Patterns of ...AI as Research Assistant: Upscaling Content Analysis to Identify Patterns of ...
AI as Research Assistant: Upscaling Content Analysis to Identify Patterns of ...Axel Bruns
 
BDSM⚡Call Girls in Indirapuram Escorts >༒8448380779 Escort Service
BDSM⚡Call Girls in Indirapuram Escorts >༒8448380779 Escort ServiceBDSM⚡Call Girls in Indirapuram Escorts >༒8448380779 Escort Service
BDSM⚡Call Girls in Indirapuram Escorts >༒8448380779 Escort ServiceDelhi Call girls
 
Gujarat-SEBCs.pdf pfpkoopapriorjfperjreie
Gujarat-SEBCs.pdf pfpkoopapriorjfperjreieGujarat-SEBCs.pdf pfpkoopapriorjfperjreie
Gujarat-SEBCs.pdf pfpkoopapriorjfperjreiebhavenpr
 
BDSM⚡Call Girls in Sector 135 Noida Escorts >༒8448380779 Escort Service
BDSM⚡Call Girls in Sector 135 Noida Escorts >༒8448380779 Escort ServiceBDSM⚡Call Girls in Sector 135 Noida Escorts >༒8448380779 Escort Service
BDSM⚡Call Girls in Sector 135 Noida Escorts >༒8448380779 Escort ServiceDelhi Call girls
 
BDSM⚡Call Girls in Sector 143 Noida Escorts >༒8448380779 Escort Service
BDSM⚡Call Girls in Sector 143 Noida Escorts >༒8448380779 Escort ServiceBDSM⚡Call Girls in Sector 143 Noida Escorts >༒8448380779 Escort Service
BDSM⚡Call Girls in Sector 143 Noida Escorts >༒8448380779 Escort ServiceDelhi Call girls
 
Nara Chandrababu Naidu's Visionary Policies For Andhra Pradesh's Development
Nara Chandrababu Naidu's Visionary Policies For Andhra Pradesh's DevelopmentNara Chandrababu Naidu's Visionary Policies For Andhra Pradesh's Development
Nara Chandrababu Naidu's Visionary Policies For Andhra Pradesh's Developmentnarsireddynannuri1
 
Kishan Reddy Report To People (2019-24).pdf
Kishan Reddy Report To People (2019-24).pdfKishan Reddy Report To People (2019-24).pdf
Kishan Reddy Report To People (2019-24).pdfKISHAN REDDY OFFICE
 
How Europe Underdeveloped Africa_walter.pdf
How Europe Underdeveloped Africa_walter.pdfHow Europe Underdeveloped Africa_walter.pdf
How Europe Underdeveloped Africa_walter.pdfLorenzo Lemes
 
如何办理(BU学位证书)美国贝翰文大学毕业证学位证书
如何办理(BU学位证书)美国贝翰文大学毕业证学位证书如何办理(BU学位证书)美国贝翰文大学毕业证学位证书
如何办理(BU学位证书)美国贝翰文大学毕业证学位证书Fi L
 
Julius Randle's Injury Status: Surgery Not Off the Table
Julius Randle's Injury Status: Surgery Not Off the TableJulius Randle's Injury Status: Surgery Not Off the Table
Julius Randle's Injury Status: Surgery Not Off the Tableget joys
 
Enjoy Night⚡Call Girls Rajokri Delhi >༒8448380779 Escort Service
Enjoy Night⚡Call Girls Rajokri Delhi >༒8448380779 Escort ServiceEnjoy Night⚡Call Girls Rajokri Delhi >༒8448380779 Escort Service
Enjoy Night⚡Call Girls Rajokri Delhi >༒8448380779 Escort ServiceDelhi Call girls
 
Enjoy Night⚡Call Girls Iffco Chowk Gurgaon >༒8448380779 Escort Service
Enjoy Night⚡Call Girls Iffco Chowk Gurgaon >༒8448380779 Escort ServiceEnjoy Night⚡Call Girls Iffco Chowk Gurgaon >༒8448380779 Escort Service
Enjoy Night⚡Call Girls Iffco Chowk Gurgaon >༒8448380779 Escort ServiceDelhi Call girls
 
29042024_First India Newspaper Jaipur.pdf
29042024_First India Newspaper Jaipur.pdf29042024_First India Newspaper Jaipur.pdf
29042024_First India Newspaper Jaipur.pdfFIRST INDIA
 
Defensa de JOH insiste que testimonio de analista de la DEA es falso y solici...
Defensa de JOH insiste que testimonio de analista de la DEA es falso y solici...Defensa de JOH insiste que testimonio de analista de la DEA es falso y solici...
Defensa de JOH insiste que testimonio de analista de la DEA es falso y solici...AlexisTorres963861
 
Verified Love Spells in Little Rock, AR (310) 882-6330 Get My Ex-Lover Back
Verified Love Spells in Little Rock, AR (310) 882-6330 Get My Ex-Lover BackVerified Love Spells in Little Rock, AR (310) 882-6330 Get My Ex-Lover Back
Verified Love Spells in Little Rock, AR (310) 882-6330 Get My Ex-Lover BackPsychicRuben LoveSpells
 

Dernier (20)

KAHULUGAN AT KAHALAGAHAN NG GAWAING PANSIBIKO.pptx
KAHULUGAN AT KAHALAGAHAN NG GAWAING PANSIBIKO.pptxKAHULUGAN AT KAHALAGAHAN NG GAWAING PANSIBIKO.pptx
KAHULUGAN AT KAHALAGAHAN NG GAWAING PANSIBIKO.pptx
 
2024 04 03 AZ GOP LD4 Gen Meeting Minutes FINAL.docx
2024 04 03 AZ GOP LD4 Gen Meeting Minutes FINAL.docx2024 04 03 AZ GOP LD4 Gen Meeting Minutes FINAL.docx
2024 04 03 AZ GOP LD4 Gen Meeting Minutes FINAL.docx
 
28042024_First India Newspaper Jaipur.pdf
28042024_First India Newspaper Jaipur.pdf28042024_First India Newspaper Jaipur.pdf
28042024_First India Newspaper Jaipur.pdf
 
TDP As the Party of Hope For AP Youth Under N Chandrababu Naidu’s Leadership
TDP As the Party of Hope For AP Youth Under N Chandrababu Naidu’s LeadershipTDP As the Party of Hope For AP Youth Under N Chandrababu Naidu’s Leadership
TDP As the Party of Hope For AP Youth Under N Chandrababu Naidu’s Leadership
 
HARNESSING AI FOR ENHANCED MEDIA ANALYSIS A CASE STUDY ON CHATGPT AT DRONE EM...
HARNESSING AI FOR ENHANCED MEDIA ANALYSIS A CASE STUDY ON CHATGPT AT DRONE EM...HARNESSING AI FOR ENHANCED MEDIA ANALYSIS A CASE STUDY ON CHATGPT AT DRONE EM...
HARNESSING AI FOR ENHANCED MEDIA ANALYSIS A CASE STUDY ON CHATGPT AT DRONE EM...
 
AI as Research Assistant: Upscaling Content Analysis to Identify Patterns of ...
AI as Research Assistant: Upscaling Content Analysis to Identify Patterns of ...AI as Research Assistant: Upscaling Content Analysis to Identify Patterns of ...
AI as Research Assistant: Upscaling Content Analysis to Identify Patterns of ...
 
BDSM⚡Call Girls in Indirapuram Escorts >༒8448380779 Escort Service
BDSM⚡Call Girls in Indirapuram Escorts >༒8448380779 Escort ServiceBDSM⚡Call Girls in Indirapuram Escorts >༒8448380779 Escort Service
BDSM⚡Call Girls in Indirapuram Escorts >༒8448380779 Escort Service
 
Gujarat-SEBCs.pdf pfpkoopapriorjfperjreie
Gujarat-SEBCs.pdf pfpkoopapriorjfperjreieGujarat-SEBCs.pdf pfpkoopapriorjfperjreie
Gujarat-SEBCs.pdf pfpkoopapriorjfperjreie
 
BDSM⚡Call Girls in Sector 135 Noida Escorts >༒8448380779 Escort Service
BDSM⚡Call Girls in Sector 135 Noida Escorts >༒8448380779 Escort ServiceBDSM⚡Call Girls in Sector 135 Noida Escorts >༒8448380779 Escort Service
BDSM⚡Call Girls in Sector 135 Noida Escorts >༒8448380779 Escort Service
 
BDSM⚡Call Girls in Sector 143 Noida Escorts >༒8448380779 Escort Service
BDSM⚡Call Girls in Sector 143 Noida Escorts >༒8448380779 Escort ServiceBDSM⚡Call Girls in Sector 143 Noida Escorts >༒8448380779 Escort Service
BDSM⚡Call Girls in Sector 143 Noida Escorts >༒8448380779 Escort Service
 
Nara Chandrababu Naidu's Visionary Policies For Andhra Pradesh's Development
Nara Chandrababu Naidu's Visionary Policies For Andhra Pradesh's DevelopmentNara Chandrababu Naidu's Visionary Policies For Andhra Pradesh's Development
Nara Chandrababu Naidu's Visionary Policies For Andhra Pradesh's Development
 
Kishan Reddy Report To People (2019-24).pdf
Kishan Reddy Report To People (2019-24).pdfKishan Reddy Report To People (2019-24).pdf
Kishan Reddy Report To People (2019-24).pdf
 
How Europe Underdeveloped Africa_walter.pdf
How Europe Underdeveloped Africa_walter.pdfHow Europe Underdeveloped Africa_walter.pdf
How Europe Underdeveloped Africa_walter.pdf
 
如何办理(BU学位证书)美国贝翰文大学毕业证学位证书
如何办理(BU学位证书)美国贝翰文大学毕业证学位证书如何办理(BU学位证书)美国贝翰文大学毕业证学位证书
如何办理(BU学位证书)美国贝翰文大学毕业证学位证书
 
Julius Randle's Injury Status: Surgery Not Off the Table
Julius Randle's Injury Status: Surgery Not Off the TableJulius Randle's Injury Status: Surgery Not Off the Table
Julius Randle's Injury Status: Surgery Not Off the Table
 
Enjoy Night⚡Call Girls Rajokri Delhi >༒8448380779 Escort Service
Enjoy Night⚡Call Girls Rajokri Delhi >༒8448380779 Escort ServiceEnjoy Night⚡Call Girls Rajokri Delhi >༒8448380779 Escort Service
Enjoy Night⚡Call Girls Rajokri Delhi >༒8448380779 Escort Service
 
Enjoy Night⚡Call Girls Iffco Chowk Gurgaon >༒8448380779 Escort Service
Enjoy Night⚡Call Girls Iffco Chowk Gurgaon >༒8448380779 Escort ServiceEnjoy Night⚡Call Girls Iffco Chowk Gurgaon >༒8448380779 Escort Service
Enjoy Night⚡Call Girls Iffco Chowk Gurgaon >༒8448380779 Escort Service
 
29042024_First India Newspaper Jaipur.pdf
29042024_First India Newspaper Jaipur.pdf29042024_First India Newspaper Jaipur.pdf
29042024_First India Newspaper Jaipur.pdf
 
Defensa de JOH insiste que testimonio de analista de la DEA es falso y solici...
Defensa de JOH insiste que testimonio de analista de la DEA es falso y solici...Defensa de JOH insiste que testimonio de analista de la DEA es falso y solici...
Defensa de JOH insiste que testimonio de analista de la DEA es falso y solici...
 
Verified Love Spells in Little Rock, AR (310) 882-6330 Get My Ex-Lover Back
Verified Love Spells in Little Rock, AR (310) 882-6330 Get My Ex-Lover BackVerified Love Spells in Little Rock, AR (310) 882-6330 Get My Ex-Lover Back
Verified Love Spells in Little Rock, AR (310) 882-6330 Get My Ex-Lover Back
 

USGS Report: Water Quality in Mon River Basin Shows No Harm from Marcellus Shale Drilling

  • 1. Prepared in cooperation with the West Virginia Department of Environmental Protection, Division of Water and Waste Management Water Quality of Groundwater and Stream Base Flow in the Marcellus Shale Gas Field of the Monongahela River Basin, West Virginia, 2011–12 Monongahela River Basin Monongahela River Basin Scientific Investigations Report 2014–5233 U.S. Department of the Interior U.S. Geological Survey
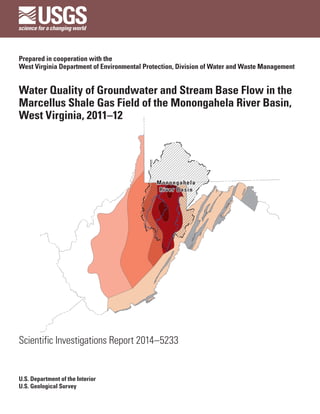
  • 2. Cover.  The extent of the Marcellus Shale in West Virginia and the location of the Monongahela River Basin and its major streams. See figure 1 for an explanation of the extent of the Marcellus Shale. Marcellus Shale thickness from Schwietering and Bocan (2011).
  • 3. Water Quality of Groundwater and Stream Base Flow in the Marcellus Shale Gas Field of the Monongahela River Basin, West Virginia, 2011–12 By Douglas B. Chambers, Mark D. Kozar, Terence Messinger, Michon L. Mulder, Adam J. Pelak, and Jeremy S. White Prepared in cooperation with the West Virginia Department of Environmental Protection, Division of Water and Waste Management Scientific Investigations Report 2014–5233 U.S. Department of the Interior U.S. Geological Survey
  • 4. U.S. Department of the Interior SALLY JEWELL, Secretary U.S. Geological Survey Suzette M. Kimball, Acting Director U.S. Geological Survey, Reston, Virginia: 2015 For more information on the USGS—the Federal source for science about the Earth, its natural and living resources, natural hazards, and the environment, visit http://www.usgs.gov or call 1–888–ASK–USGS. For an overview of USGS information products, including maps, imagery, and publications, visit http://www.usgs.gov/pubprod Any use of trade, firm, or product names is for descriptive purposes only and does not imply endorsement by the U.S. Government. Although this information product, for the most part, is in the public domain, it also may contain copyrighted materials as noted in the text. Permission to reproduce copyrighted items must be secured from the copyright owner. Suggested citation: Chambers, D.B., Kozar, M.D., Messinger, Terence, Mulder, M.L., Pelak, A.J., and White, J.S., 2015, Water quality of groundwater and stream base flow in the Marcellus Shale Gas Field of the Monongahela River Basin, West Vir- ginia, 2011–12: U.S. Geological Survey Scientific Investigations Report 2014–5233, 75 p., http://dx.doi.org/10.3133/ sir20145233. ISSN 2328-0328 (online)
  • 5. iii Acknowledgments The authors thank Katherine S. Paybins, Jessica L. Wood, and Hugh E. Bevans of the U.S. Geological Survey (USGS) for helping with the collection of samples during the groundwater survey and base-flow survey. Thanks also go to Jeffrey E. Bailey, West Virginia Department of Environmental Protection, Division of Water and Waste Management, for assistance in understanding land-use patterns in the study area and in surface-water site selection. Lisa Senior and Michael Bradley of the USGS are thanked for their thoughtful reviews that have improved this report.
  • 6. iv Contents Abstract ...........................................................................................................................................................1 Introduction ....................................................................................................................................................2 Purpose and Scope..............................................................................................................................6 Description of Study Area....................................................................................................................6 Physiography and Climate...........................................................................................................6 Geologic Setting............................................................................................................................7 Land Use.........................................................................................................................................9 Methods of Study.................................................................................................................................11 Site Selection..............................................................................................................................11 Groundwater ......................................................................................................................11 Surface Water ...................................................................................................................11 Sampling Methods......................................................................................................................15 Groundwater Sampling ....................................................................................................15 Base-Flow Sampling ........................................................................................................15 Methods of Analysis...................................................................................................................18 Geospatial Analyses..........................................................................................................18 Statistical Analyses...........................................................................................................18 Quality Assurance......................................................................................................................18 Blank Samples....................................................................................................................18 Replicate Samples.............................................................................................................18 Quality-Assurance Results..........................................................................................................................19 Groundwater Samples ..............................................................................................................19 Base-Flow Samples....................................................................................................................19 Water Quality in the Monongahela River Basin .....................................................................................19 Specific Conductance, Total Dissolved Solids, and pH ................................................................19 Specific Conductance................................................................................................................20 Total Dissolved Solids................................................................................................................22 pH..................................................................................................................................................22 Major Ions.............................................................................................................................................22 Trace Elements.....................................................................................................................................32 Naturally Occurring Radioactive Materials....................................................................................40 Isotopes.................................................................................................................................................41 Groundwater Survey..................................................................................................................42 Base-Flow Survey.......................................................................................................................42 Dissolved Gases...................................................................................................................................45 Water-Quality Patterns ......................................................................................................................47 Summary........................................................................................................................................................52 References Cited..........................................................................................................................................53 Appendix 1. Data for groundwater samples collected as part of the Marcellus Shale baseline survey, Monongahela River Basin, West Virginia, June–September 2011............................62 Appendix 2. Data for base-flow samples collected as part of the Marcellus Shale baseline survey, Monongahela River Basin, West Virginia, July–October 2012..................................70
  • 7. v Figures 1.  Map showing extent of the Marcellus Shale in the Monongahela River Basin in West Virginia..............................................................................................................................3 2.  Maps showing A, thickness of the Marcellus Shale, wells completed in the Marcellus Shale, and horizontal wells, and B, locations of all gas wells, including abandoned wells, Monongahela River Basin and vicinity, West Virginia, 2012..................4 3.  Geologic map of the Monongahela River Basin in West Virginia.........................................8 4.  Map showing coal mines in the Monongahela River Basin and adjacent areas in West Virginia............................................................................................................................10 5.  Map showing groundwater survey sites in the Monongahela River Basin, West Virginia, June–September 2011......................................................................................13 6.  Flow chart showing the process for stratifying stream-water sampling sites.................16 7.  Map showing streams, stream sampling sites, gas wells completed in the Marcellus Shale through 2012 showing gas production through 2010, and average thickness of the Marcellus Shale by HUC-12..................................................17 8.  Boxplots showing distribution of specific conductance for samples collected as part of the Marcellus Shale baseline study, 2011–12, and historical specific conductance for samples collected in the Monongahela River Basin, West Virginia: A, groundwater samples and B, base-flow samples...................................21 9.  Boxplots showing distribution of specific conductance for samples collected as part of the Marcellus Shale baseline study, Monongahela River Basin, West Virginia, 2011–12, grouped by gas production type: A, groundwater samples and B, base-flow samples..........................................................................................21 10.  Boxplots showing distribution of pH in samples collected as part of the Marcellus Shale baseline study, 2011–12, and historical pH in samples from the Monongahela River Basin, West Virginia: A, groundwater samples and B, base-flow samples..........................................................................................................22 11.  Boxplots showing distribution of pH in samples collected as part of the Marcellus Shale baseline study in the Monongahela River Basin, West Virginia, 2011–12: A, groundwater samples and B, base-flow samples. .................23 12.  Piper diagrams showing major ion composition of samples collected as part of the Marcellus Shale baseline study, 2011–12, from the Monongahela River Basin, West Virginia: A, groundwater survey samples classified by geologic formation and B, base-flow survey samples...........................................................................24 13.  Boxplots showing distribution of major-ion concentrations in groundwater and base-flow samples collected as part of the Marcellus Shale baseline study, 2011–12, and historical major-ion concentrations, Monongahela River Basin, West Virginia: A, calcium, B, sodium, C, magnesium, D, potassium, E, chloride, F, sulfate, G, bromide, and H, fluoride......................................................................................25 14.  Boxplots showing distribution of major-ion concentrations in groundwater and base-flow samples collected as part of the baseline study, Monongahela River Basin, West Virginia, 2011–12, grouped by gas production bin: A, calcium, B, sodium, C, magnesium, D, potassium, E, chloride, F, sulfate, G, bromide, and H, fluoride..............................................................................................................................28 15.  Boxplots showing distribution of trace-element concentrations in groundwater and base-flow samples collected as part of the Marcellus Shale baseline study, 2011–12, and historical trace-element concentrations, Monongahela River Basin, West Virginia: A, aluminum, B, iron, C, manganese, D, barium, and E, strontium in base flow only..........................................................................................................................34
  • 8. vi 16.  Boxplots showing distribution of trace-element concentrations in groundwater and base-flow samples collected as part of the baseline study, 2011–12, Monongahela River Basin, West Virginia, grouped by gas production bin: A, aluminum, B, iron, C, manganese, D, barium, E, strontium, F, cobalt, G, molybdenum, and H, arsenic.................................................................................................36 17.  Boxplots showing distribution of uranium concentrations in groundwater and base-flow samples collected as part of the Marcellus Shale baseline study, Monongahela River Basin, West Virginia, 2011–12, grouped by gas production bin: A, groundwater samples and B, base-flow samples.....................................................41 18.  Graphs showing oxygen and hydrogen isotopic composition of water in A, groundwater samples and B, base-flow samples collected as part of the Marcellus Shale baseline study in the Monongahela River Basin, West Virginia, 2011–12, and the Global Meteoric Water Line..............................................42 19.  Graphs showing isotopic signatures of dissolved methane in 11 groundwater samples collected as part of the Marcellus Shale baseline study, Monongahela River Basin, West Virginia, 2011, in samples from the Pittsburgh Coal, in a Marcellus Shale gas separation tank, and in various other sources: A, deep, microbially stimulated methane; B, biogenic, thermogenic, and mixed source methane; and C, predominantly thermogenic methane signature.........................43 20.  Graph showing isotopic composition of dissolved inorganic carbon in base-flow samples collected as part of the Marcellus Shale baseline study, Monongahela River Basin, West Virginia, 2012......................................................................44 21.  Graph showing concentrations of dissolved nitrogen in relation to concentrations of dissolved argon in samples from 39 wells and 2 springs collected as part of the baseline study, Monongahela River Basin, West Virginia, 2011, with associated estimates of recharge temperature and excess air, based on normalized sea-level concentrations.....................................................................46 22.  Diagram showing principal component axis scores for the two principal components for selected groundwater samples collected as part of the Marcellus Shale baseline study, Monongahela River Basin, West Virginia, 2011......................................................................................................................48 23.  Map showing concentrations of methane in groundwater samples collected as part of the Marcellus Shale baseline study, Monongahela River Basin, West Virginia, 2011, and the location of mined coal seams and geologic structural features.......................................................................................................................50 24.  Graphs showing concentration of constituent or property in relation to the mining intensity, measured as the sum of mined areas in the 12-digit hydrologic unit code areas, expressed as a proportion of the HUC-12 surface area for A, sulfate and B, specific conductance in base-flow samples collected as part of the Marcellus Shale baseline survey, Monongahela River Basin, West Virginia, 2012.........51
  • 9. vii Tables 1.  Water-quality properties, major ions, trace elements, naturally occurring radioactive materials, and dissolved gases analyzed for in groundwater and surface-water samples from the Marcellus Shale baseline survey, Monongahela River Basin, West Virginia, 2011–12................................................................12 2.  Site information for wells and springs sampled for the groundwater survey as part of the Marcellus Shale baseline survey, Monongahela River Basin, West Virginia, June–September 2011......................................................................................14 3.  Site information for streams sampled during base flow as part of the Marcellus Shale baseline survey, Monongahela River Basin, West Virginia, July–October 2012.......................................................................................................................57 4.  Statistical summary of water-quality field measurements and major ions in samples collected for the groundwater survey and base-flow survey as part of the Marcellus Shale baseline survey, Monongahela River Basin, West Virginia, 2011–12................................................................................................................20 5.  Statistical summary of trace elements in samples collected for the groundwater survey and the base-flow survey as part of the Marcellus Shale baseline survey, West Virginia, 2011–12................................................................................................................33 6.  Statistical summary of naturally occurring radioactive materials in groundwater and base-flow samples collected as part of the Marcellus Shale baseline survey, Monongahela River Basin, West Virginia, 2011–12................................................................40 7.  Statistical summary of dissolved gases in groundwater samples collected as part of the Marcellus Shale baseline survey, Monongahela River Basin, West Virginia, 2011......................................................................................................................46 8.  Principal component loadings from analysis of 23 variables potentially affecting groundwater quality in the Monongahela River Basin in West Virginia, 2011..................................................................................................................48
  • 10. viii Conversion Factors Inch/Pound to SI Multiply By To obtain Length foot (ft) 0.3048 meter (m) mile (mi) 1.609 kilometer (km) Area square mile (mi2 ) 259.0 hectare (ha) square mile (mi2 ) 2.590 square kilometer (km2 ) Volume barrel (bbl), (petroleum, 1 barrel=42 gal) 0.1590 cubic meter (m3 ) gallon (gal) 3.785 liter (L) gallon (gal) 0.003785 cubic meter (m3 ) gallon (gal) 3.785 cubic decimeter (dm3 ) million gallons (Mgal) 3,785 cubic meter (m3 ) cubic foot (ft3 ) 28.32 cubic decimeter (dm3 ) cubic foot (ft3 ) 0.02832 cubic meter (m3 ) thousand cubic feet (Mcf) 28.32 cubic meter (m3 ) Flow rate cubic foot per second (ft3 /s) 0.02832 cubic meter per second (m3 /s) cubic foot per second per square mile [(ft3 /s)/mi2 ] 0.01093 cubic meter per second per square kilometer [(m3 /s)/km2 ] Pressure atmosphere, standard (atm) 101.3 kilopascal (kPa) Bar 100 kilopascal (kPa) inch of mercury at 60ºF (in Hg) 3.377 kilopascal (kPa) Radioactivity picocurie per liter (pCi/L) 0.037 becquerel per liter (Bq/L) Temperature in degrees Celsius (°C) may be converted to degrees Fahrenheit (°F) as follows: °F=(1.8×°C)+32 Temperature in degrees Fahrenheit (°F) may be converted to degrees Celsius (°C) as follows: °C=(°F-32)/1.8 Vertical coordinate information is referenced to the North American Vertical Datum of 1988 (NAVD 88). Horizontal coordinate information is referenced to the North American Datum of 1983 (NAD 83). Elevation, as used in this report, refers to distance above the vertical datum. Specific conductance is given in microsiemens per centimeter at 25 degrees Celsius (µS/cm at 25 °C). Concentrations of chemical constituents in water are given either in milligrams per liter (mg/L) or micrograms per liter (µg/L). Radioactivity of chemical constituents in water are given in picocuries per liter (pCi/L).
  • 11. Water quality of groundwater and stream base flow in the Marcellus Shale Gas Field of the Monongahela River Basin, West Virginia, 2011–12 By Douglas B. Chambers, Mark D. Kozar, Terence Messinger, Michon L. Mulder1 , Adam J. Pelak1 , and Jeremy S. White Abstract The Marcellus Shale gas field underlies portions of New York, Pennsylvania, Ohio, Virginia, Maryland, Tennessee, and West Virginia. Development of hydraulic fracturing and horizontal drilling technology led to extensive development of gas from the Marcellus Shale beginning about 2007. The need to identify and monitor changes in water-quality condi- tions related to development of the Marcellus Shale gas field prompted the U.S. Geological Survey, in cooperation with the West Virginia Department of Environmental Protection, Division of Water and Waste Management, to document water quality for comparison with water quality in samples collected at a future date. The identification of change in water-quality conditions over time is more difficult if baseline water-quality conditions have not been documented. U.S. Geological Survey personnel sampled groundwater and surface water in West Virginia’s Monongahela River Basin during 2011–12. A groundwater survey, in which 39 wells and 2 springs were sampled, was conducted during June through September 2011. A base-flow survey was conducted during July through October 2012; 50 stream sites were sampled under base-flow conditions in this survey. Because additives to hydraulic fracturing fluids are vari- able and decrease in flowback water over a relatively short time, water-quality analyses for this study focused on docu- menting the water-quality characteristics typical of water from shallow aquifers; water derived from contact with the Marcel- lus Shale (flowback from hydraulic fracturing or formation water); and water with constituents from conventional oil and gas development, sewage effluent, and coal-mine drainage. All samples were analyzed for field properties (water temperature, pH, specific conductance, dissolved oxygen, and turbidity), major ions, trace elements, naturally occurring radioactive materials, and stable isotopes. In addition to documenting baseline water-quality condi- tions for an area of shale-gas development, these data were examined for patterns in water quality. Groundwater and base-flow survey data were compared to historical data from the Monongahela River Basin in West Virginia. Additionally, groundwater- and base-flow survey samples were grouped by Marcellus Shale gas production in the subbasin in which that sampling site was located. The comparisons of data collected as part of this study with historical data identified few differences. No signifi- cant difference was found in a comparison of groundwater survey data and historical data. Base-flow survey samples differed significantly from historical data for pH, chloride, and strontium, all of which had higher concentrations in the base-flow survey samples. Differences in pH are likely related to changes in mining regulation beginning in 1977. Concentra- tions of chloride and strontium elevated above background concentrations may be related to saline groundwater; saline water is within 300 feet of the land surface in parts of the study area. In the comparison of base-flow survey samples grouped by shale-gas-production setting, significant differences were found for fluoride and barium. Concentrations of fluoride and barium were higher in stream subbasins with active Marcellus Shale production than in subbasins not near active Marcellus Shale production. Elevated fluoride and barium are associated with deep brines. Generally, naturally occurring radioactive materials were not found in elevated concentrations in either groundwater or base-flow samples. Only 3 samples, 2 from the groundwater survey and one from the base-flow survey, exceeded the U.S. Environmental Protection Agency maximum contaminant level for radium isotopes of 5.0 picocurie per liter for either a single isotope or a combined value of radium-226 and radium-228. Stable isotope composition indicates broad similarity among surface water, shallow groundwater, and precipitation in the region. Neither shallow groundwater nor surface water1 West Virginia University.
  • 12. 2   Water quality in the Marcellus Shale Gas Field of the Monongahela River Basin, West Virginia, 2011–12 showed a marked similarity with the deep brines associated with shale gas. In most of the groundwater survey samples, 38 of 41 samples, dissolved gas profiles were similar to those previously found in samples from shallow, domestic wells in the region. This study provides a baseline of water-quality condi- tions in the Monongahela River Basin in West Virginia during the early phases of development of the Marcellus Shale gas field. Although not all inclusive, the results of this study provide a set of reliable water-quality data against which future data sets can be compared and the effects of shale-gas development may be determined. Introduction Natural gas in West Virginia was reported as early as 1774, followed by the first documented industrial use in the State, fueling brine boilers, in 1841 (White, 1904). Since that time, natural gas has been an integral component of West Virginia’s and the Nation’s energy supply. Since about 2007, the development of hydraulic fracturing and horizontal drill- ing technology has led to extensive development of gas from the Marcellus Shale in the Monongahela River Basin in West Virginia (figs. 1 and 2). Much of Nation’s historical gas production has been from “conventional” gas fields, geographically discrete accu- mulations with distinct water-hydrocarbon contacts (Schenk and Pollastro, 2002). The localized nature, high permeability, and high recovery factors of conventional gas accumulations make them amenable to extraction by vertical drilling. In contrast, shale gas resources form within organic-rich shale source rock (U.S. Energy Information Administration, 2012). The low permeability of the shale greatly inhibits the gas from migrating to more permeable reservoir rocks. Although some shale formations have long been known to be rich in gas, little gas could be obtained from them using conven- tional drilling techniques. Improvements in drilling technolo- gies, specifically horizontal drilling and hydraulic fracturing, have made recovery of shale-gas reserves economically feasible. The Marcellus Shale is a formation of Devonian age that underlies large parts of New York, Pennsylvania, Ohio, and West Virginia, and smaller parts of Virginia, Maryland, and Tennessee. The Marcellus Shale ranges in depth from about 2,000 feet below mean sea level (MSL) along the western edge of its extent to greater than 6,000 feet below MSL along the eastern edge, with the thicker deposits occurring at greater depths. A recent assessment estimated that 84,198 billion cubic feet of natural gas and 3,379 million barrels of natural gas liquids are technically recoverable from the Mar- cellus Shale (Coleman and others, 2011). On the basis of the 2009 consumption of 23 trillion cubic feet (ft3 ), this is enough natural gas to meet the needs of the entire Nation for about 15 years (Coleman and others, 2011). The low permeability and low recovery factors of Mar- cellus Shale, as with other shale-gas fields, makes extraction with vertical drilling challenging. However, the use of hori- zontal, or directional drilling, and hydraulic fracturing allow recovery of natural gas from the Marcellus Shale. Directional drilling and hydraulic fracturing capitalize upon and augment naturally occurring fractures, thereby enhancing permeability and gas recovery (U.S. Department of Energy, 2013). A horizontal well begins with a vertical well drilled to a depth approaching that of the targeted shale bed, 5,000 to 9,000 feet below MSL in the Marcellus Shale in West Virginia (U.S. Department of Energy, 2013). Once the desired depth of vertical well bore is reached, a steerable downhole motor is used to drill the well at an angle. The steerable motor will eventually impart sufficient angular deviation to turn the well bore 90 degrees from the vertical. The well bore is then extended as a lateral well bore, or “lateral,” through the shale bed. These laterals can extend for 3,000 to 10,000 feet from the vertical well bore (U.S. Department of Energy, 2013). Once the horizontal wells are completed, the recovery of gas from the Marcellus Shale is further enhanced through hydraulic fracturing, commonly referred to as “fracking.” Hydraulic fracturing uses fluids under high pressure to create fractures in the rock, increasing gas flow to the well bore. The well casing and cement are perforated with small explosive charges prior to injection of the pressurized fluid. The fluid contains quartz sand or other materials of similar size or shape (proppants) that remain in the newly created fractures to keep them from closing. The hydraulic-fracturing fluid and forma- tion fluid can flow back to land surface as the injection pres- sure is reduced. Although natural gas has been promoted as the cleanest- burning fossil fuel, emitting only 53 kilograms (kg) of carbon dioxide (CO2 ) per million British thermal units (Btu); coal emits an average of 95 kg of CO2 per million Btu (U.S. Energy Information Administration, 1999). Production of natural gas is not without environmental consequences. Kappel and others (2013) presented critical water-resources issues associated with shale-gas development in the Appalachian Basin, grouped into the following categories: water supply, stray gas, radio- activity in shale waste, fluid waste treatment and disposal, deep well injection of fluid waste, solid waste disposal, and construction and transportation. Large quantities of water are used during the hydraulic fracturing, posing potential water-quality issues. As much as 3 million gallons of water can be used for a single hydrau- lic fracturing treatment. Hydraulic fracturing fluids contain chemicals that increase the viscosity to a gel-like consistency and allow the transport of a proppant, usually sand, into the hydraulically created fractures to keep them open. Other chemicals allow the viscosity of the fluid to break down quickly so that the fluid can be easily removed. In addition to chemical additives in the hydraulic fracturing fluids, the contact of fluids with the rock matrix introduces a variety of formation constituents, including brines, trace elements, and radionuclides.
  • 14. 4   Water quality in the Marcellus Shale Gas Field of the Monongahela River Basin, West Virginia, 2011–12 BasemapfromU.S.GeologicalSurvey1:200,000digitallinegraphicsMarcellusShalewelllocationsfromWestVirginiaDepartmentofEnvironmentalProtection,TechnicalApplicationGISUnit,2013; MarcellusShalethicknessfromSchwieteringandBocan,2011 020MILES 020KILOMETERS EXPLANATION ThicknessofMarcellusShale,infeet Marcellusassumedtobeabsent Uncertainthickness 21–40 40–60 61–80 81–100 Greaterthan100 MonongahelaRiverBasinboundary WellcompletedinMarcellusShale inWestVirginia,September2012 Horizontalwellcompletedin MarcellusShaleinWestVirginia, September2012 A 79°30'80°80°30'81°81°30' 39°30' 39° 38°30' Areaofdetail WV PA OH KY VA MD Figure2. A,ThicknessoftheMarcellusShale,wellscompletedintheMarcellusShale,andhorizontalwells,andB,locationsofallgaswells,including abandonedwells,MonongahelaRiverBasinandvicinity,WestVirginia,2012.
  • 16. 6   Water quality in the Marcellus Shale Gas Field of the Monongahela River Basin, West Virginia, 2011–12 Hydraulic fracturing fluids and formation waters are highly contaminated and must be captured and disposed of properly when the fluids flow back to land surface. Initial recovery of hydraulic fracturing fluids in the Marcellus Shale is 20–25 percent (U.S. Department of Energy, 2013). Industry estimates for continued recovery of hydraulic fracturing fluid and formation water, even after the well is on-line, range from 5 to 50 barrels per week. Current regulations in West Virginia require offsite disposal of fracturing fluids and flowback from horizontal wells (West Virginia Department of Environmen- tal Protection, 2010). Fluids are collected in either a sealed tank or a lined open pit and hauled by truck to a disposal site. The preferred method of disposal (as of 2014) for hydraulic fracturing fluids is underground injection into deep formations (West Virginia Department of Environmental Protection, 2010), often former oil- and gas-producing formations. This disposal practice could also be a threat to water quality because of the potential for spills during the fluid handling and transportation process or leakage from natural faults and fractures or from for- mer gas and oil wells that have not been properly constructed or abandoned. Documentation of the 2011–12 baseline quality of shal- low groundwater underlain by the Marcellus Shale in north- central West Virginia can be used for comparison with future water quality to monitor and recognize potential water-quality changes from gas-production activities should they occur. The West Virginia’s Monongahela River Basin was identified as an area of rapid Marcellus Shale gas development. Therefore, in 2011 the U.S. Geological Survey (USGS), in cooperation with the West Virginia Department of Environmental Protec- tion (WVDEP), Division of Water and Waste Management, began a study to obtain baseline water-quality information for the Monongahela River Basin in West Virginia. The water- quality properties and constituents documented during this study include those that are naturally occurring in the Marcel- lus Shale and are likely to be elevated in shallow groundwater through contact with return flows or leakage from hydraulic fracturing activities. Because groundwater discharge to streams forms base flow, potential water-quality changes to groundwa- ter may also affect base-flow quality. Purpose and Scope This report describes the water quality of groundwater and stream base flow in that part of north-central West Virginia drained by the Monongahela River during early development of the Marcellus Shale gas field. Groundwater samples were collected during June–September 2011, and base-flow samples were collected in 2012. The conditions described in this report include those affected by human activities that potentially intro- duce contaminants into surface water and groundwater similar to those expected from shale-gas development. Concentrations of water-quality constituents are presented in figures and tables. Description of Study Area The study area is the Monongahela River Basin in West Virginia (fig. 1) and encompasses a drainage area of 7,377 square miles (mi2 ) (19,106 square kilometers [km2 ]) in the north-central part of West Virginia. Major tributaries to the Monongahela River are the Cheat River, Tygart Valley River, and the West Fork River. The study area was selected because of the large number of vertical and horizontal gas wells that are proposed for the Marcellus Shale. Physiography and Climate The study area is mostly within the Appalachian Plateaus Physiographic Province, but a small area in the southeastern part of the study area has been mapped as lying within the Valley and Ridge Physiographic Province (Fenneman, 1938). The Appalachian Plateaus are characterized by flat to slightly dipping sedimentary rocks that have been eroded by fluvial processes to form a rolling topography with a dendritic stream drainage pattern. The boundary between the two provinces is known as the Allegheny Front, an abrupt and complex transition between the two physiographic provinces. To the west of the Allegheny Front, lie the relatively flat to slightly dipping rocks of the Appalachian Plateaus; to the east of the Allegheny Front, lie steeply dipping, long linear ridges and valleys of the Valley and Ridge Physiographic Province. Within the Valley and Ridge, topography varies and is marked by steep ridges, typically formed by more weather resistant sandstones and limestone, and narrow valleys, which tend to form in areas underlain by less resistant shales and siltstones (West Virginia Geological and Economic Survey, 2014b). Orogenic processes compressed rocks to form the Valley and Ridge Physiographic Province. The compres- sional stress resulted in significant folding and faulting of the bedrock strata, and resulted in the characteristic alternating long linear valleys and ridges from which the province derived its name. Stream drainages in the Valley and Ridge Physio- graphic Province commonly exhibit a predominantly trellis drainage pattern. Elevation in the study area ranges from about 790 ft above the North American Vertical Datum of 1988 (NAVD 88) near the Monongahela River at the border of West Virginia and Pennsylvania to about 4,850 ft in the southern part of the study area. Mean annual precipitation within the Appalachian Plateaus Physiographic Province varies with elevation owing to orographic lifting. Mean annual precipitation (1981–2010) ranged from 44 inches per year (in/yr) to 66 in/yr (PRISM Climate Group, 2012). Maximum precipitation occurs in the mountains in the southern part of the study area, and mini- mum precipitation occurs near the Monongahela and West Fork Rivers.
  • 17. Introduction   7 Geologic Setting Geologic strata in the study area are composed of several formations and groups (fig. 3), ranging in age from Devonian through Permian with Quaternary alluvial deposits along the streams and rivers. The strata include parts of geologic formations of Devonian, Mississippian, and Pennsylvanian age, and all bedrock in the study area is sedimentary in origin. Geologic nomenclature used in this report conforms with that used by the West Virginia Geological and Economic Survey, as depicted on the 1968 State geologic map of West Virginia (Cardwell and others, 1968). Bedrock composition of the for- mations is described below (Cardwell and others, 1968). Devonian-age geologic strata exposed at land surface in the study area include parts of the Harrell Shale, Brallier Formation, Chemung Group, and the Hampshire Forma- tion (fig. 3). The Harrell Shale and the Brallier Formation are composed predominantly of dark marine shales with thin interspersed lenses of limestone, siltstone, and sandstone. The Chemung Group is characterized as mostly siltstone and sand- stone with shale and conglomerate interbeds. The Hampshire Formation is predominantly shale and fine micaceous sand- stone, with siltstone, sandstone, and conglomerate. The oldest rocks that crop out in the study area are in the Harrell Shale Formation. The Mahantango Formation, which is composed predominantly of thick laminated marine shale, siltstone, sand- stone, and some limestone (Cardwell and others, 1968), does not crop out within the study area, but immediately underlies the Harrell Shale. The Marcellus Shale, which also does not crop out in the study area but is the primary emphasis of this study, underlies the Mahantango Formation and is composed of predominantly gray black to black thinly laminated pyritic shales (Cardwell and others, 1968). Mississippian-age strata include parts of the Price Formation, the Greenbrier Group, and the Bluefield, Hinton, Princeton Sandstone, and Bluestone Formations (fig. 3). The Price Formation is composed predominantly of hard massive sandstones with some shale. The Price Formation was previ- ously referred to as the Pocono Group but was later revised as a result of additional stratigraphic studies. Some older geologic maps, as well as the USGS National Water Informa- tion System (NWIS) database still refer to the Price Formation as the Pocono Group. The Greenbrier Group is composed of massive marine limestones with associated shales and minor sandstone beds. Outside the study area, the Greenbrier Group is one of the more prominent karst regions in West Virginia. The Bluefield and Hinton Formations are composed of shale and sandstone with minor interbeds of limestone. The Blue- stone Formation and Princeton Sandstone are composed predominantly of shale and sandstone. The Bluefield, Hinton, and Bluestone Formations, and the Princeton Sandstone, are thin exposures in the outcrop and are commonly collectively referred to, and shown on the accompanying geologic map (fig. 3), as the Mauch Chunk Group. Pennsylvanian-age strata within the study area include important coal seams, such as the Pittsburgh, Freeport, Kit- tanning, and Sewickley seams. Pennsylvanian-age strata in the study area include parts of the New River Forma- tion, Kanawha Formation, Allegheny Formation, Conem- augh Group, Monongahela Group, and the Dunkard Group (fig. 3). In the northeast part of the study area the deposi- tional sequence thins, and the Pocahontas, New River, and Kanawha Formations are collectively referred to as the Pottsville Group (fig. 3). The Pottsville Group is composed of sandstones and some conglomerate with thin shales and coal seams. Where the New River and Kanawha Formations crop out in sufficient area, they are mapped separately from the Pottsville Group (fig. 3). The New River and Kanawha Formations are composed of sandstone with some shale, siltstone, and coal. The Allegheny Formation is composed of cyclic sequences of sandstone, siltstone, shale, limestone, and coal. The more economically relevant coal seams in the Allegheny Formation are the Freeport, Kittanning, and Clar- ion coal seams. The Conemaugh Group is composed of cyclic sequences of shale, siltstone, sandstone, thin limestones, and coal. Economically important coal seams in the Conemaugh Group are the Bakerstown, Brush Creek, and Mahoning coal seams. The Monongahela Group is also composed predomi- nantly of sandstone, siltstone, shale, limestone, and coal. Eco- nomically important coal seams in the Monongahela Group are the Pittsburgh, Sewickley, Uniontown, Waynesburg, and Redstone coal seams. There is debate about the geologic age of the Dunkard Group, but it occurs either at the top of the stratigraphic sequence of Pennsylvanian strata or at the base of Permian strata. The Dunkard Group is composed of sandstone, silt- stone, shale, limestone, and coal similar to that of most of the Pennsylvanian-age strata. Economically important coal seams in the Dunkard Group are the Washington and Waynesburg A coal seams. Because this report presents baseline water-quality conditions in the Marcellus Shale gas field of the Mononga- hela River Basin in West Virginia, and because the Marcellus Shale does not crop out in the study area, a discussion of the depth of burial of the Marcellus Shale within the study area is warranted. The USGS recently published geologic cross sections that encompass the study area (Ryder and others, 2008; 2009). On the basis of these cross sections, the depth to the Marcellus Shale may be inferred. The Marcellus Shale ranges in depth from approximately 7,100 feet below land surface (bls) in Marion County, West Virginia, where rocks are slightly dipping, to 4,200 feet bls along the crest of the Deer Park–Leadmine anticline in Preston County, and to only 1,400 feet bls along the crest of the Elkins Valley Anticline in Randolph County, West Virginia, based on the geologic cross sections. The geologic cross sections indicate that thrust faults cut through the Marcellus Shale and extend to the surface.
  • 18. 8   Water quality in the Marcellus Shale Gas Field of the Monongahela River Basin, West Virginia, 2011–12 WESTON ELKINS MORGANTOWN CLARKSBURG BUCKHANNON WESTON ELKINS MORGANTOWN CLARKSBURG BUCKHANNON BasefromU.S.GeologicalSurvey,1:200,000,digitallinegraphicsGeologyfromCardwellandothers,1968 SurficialGeology Quaternaryalluvium DunkardGroup MonongahelaGroup ConemaughGroup AlleghenyFormation KanawhaFormation NewRiverFormation PottsvilleGroup MauchChunkGroup HintonFormation BluefieldFormationandPrincetonSandstone BluefieldFormation GreenbrierGroup PoconoGroup HampshireFormation ChemungGroup BrallierFormation HarrellShaleFormation MonongahelaRiverBasinboundary EXPLANATION 020MILES 020KILOMETERS 79°30'80°80°30'81°81°30' 39°30' 39° 38°30' Areaofdetail WV PA OH KY VA MD Figure3. GeologicmapoftheMonongahelaRiverBasininWestVirginia.
  • 19. Introduction   9 Land Use Forest is the most extensive land use in the study area. Agriculture is generally limited and of low intensity (National Agricultural Statistics Service, 2014). The study area includes the cities of Morgantown and Clarksburg, West Virginia, and their suburbs. Morgantown and the surrounding area is among the fastest growing in West Virginia; the population of Morgantown increased 4.5 percent between 2010 and 2012, in contrast to a population growth of 0.2 percent for West Virginia as a whole (U.S. Census Bureau, 2014). Coal mining was the principal industry in the study area for most of the 20th century. The most important mined coal seams in the study area, underground and surface (fig. 4), are near the western edge, especially within the Dunkard and Monongahela Groups and the Allegheny Formation. The Pittsburgh coal seam is the most historically productive and economically important seam in the study area (Tewalt and others, 2001). The Kittanning, Freeport, Sewickley, Redstone, and Bakerstown coals have also been extensively mined, and at least 15 named coal seams have been mined in the study area. Approximately 16.5 percent of the study area has been mined. Most mines are underground (15.0 % of the study area), and the remainder are either surface mines (2.8 % of the study area) or auger mines (0.02 % of the study area), both of which may overlay underground mines. Many areas have been mined multiple times, using multiple methods, or in more than one seam, so that the two-dimensional footprint of mining is an inadequate measure of mining intensity. Most of the coal mined in the study area has high sulfur concen- trations (>2.5 percent), and demand for the high-sulfur coal mined here declined following a mandate in the 1991 Clean Air Act amendments to reduce acid precipitation (Milici and Dennen, 2009). The hydrologic and water-quality effects of both under- ground and surface mining in the study area are well docu- mented (Anderson and others, 2000; Cravotta, 2008a–b). Acid mine drainage (AMD) from coal mining has had major effects on the quality of water in streams in the region. A variety of acid mine drainage treatment techniques are being used within the study area, and water quality has improved since in the 1970s (Lambert and others, 2004). Continued treatment is nec- essary to maintain water quality in many places where mining has ended. Typical water-quality effects of coal mining in the study area include increases in concentrations of iron, manga- nese, aluminum, and sulfate. Hydrologic effects of coal mining include several impor- tant alterations to the movement of water and the magnitude and timing of flow. In underground coal mines, water flows downdip along the mine floor, even in areas where the dip is slight. If the mined seam is above grade, or higher than the valley floor, water is transferred from the updip side of the mountain to the downdip side (Kozar and others, 2013). If the mined seam is below grade, or if it dips from above grade on its uphill side to below grade on the downdip side, water collects in a pool in the void space in a mine (McColloch and others, 2012). Where mining is active, the water is pumped to the surface and discharged. Even after mining ends, water from mine pools may reach land surface through openings if hydraulic head is sufficient. Recent development of the Marcellus Shale by hori- zontal drilling and hydraulic fracturing has increased inter- est in natural gas development, but gas has been produced in the study area for decades. Nearly 6,400 gas wells had been completed in the study area through 2012 (fig. 2; West Virginia Department of Environmental Protection, 2013). The earliest recorded completion date for these wells is during 1895, but completion dates are unknown for most wells drilled before permitting began in 1929. At least 29 named forma- tions have been the targets for gas development in the study area, although the target formation for many older wells is not recorded. Beginning about 2002, the targeting of multiple for- mations in a single well became common. Through September 2012, 147 wells had been completed in the Marcellus Shale within the study area, 75 of which are horizontal wells. Both current oil and gas extraction and the legacy effects of improperly abandoned oil and gas wells have affected groundwater and surface-water quality in the region. Natural gas in West Virginia is typically associated with sediments of marine origin, so gas typically is found in association with salty water (Price and others, 1937). Salt and other elements of marine origin are among the common constituents that have become elevated in surface or shallow water as a result of gas development (Bain, 1970). Changes to water quality related to gas development may result from initial surface disturbances, such as site, access road, and pipeline construction; from drill- ing and fracturing activities; and from maintenance or recla- mation activities, such as condensate spills. For conventional wells in West Virginia, activities that may affect water quality include onsite disposal of drilling waste, a practice that was banned for horizontal wells by the West Virginia Natural Gas Horizontal Well Control Act (22-6A-2). Improperly sealed gas wells are known to be a pathway for contaminants to migrate upward from deep rock layers (Bain, 1970), although saline groundwater is naturally as close as 300 feet beneath the sur- face of some river valleys in the study area (Wilmoth, 1975; Foster, 1980). Of the gas wells in the study area, 215 have a regulatory status of “abandoned,” meaning that they are no longer in production but were never sealed and reclaimed. Underground coal mines and deeper oil and gas reser- voirs both produce methane, which has the potential to migrate either by natural processes or potentially as a result of human activities. The isotopic composition, associated ion chemistry, and compositions of associated hydrocarbons can be used to identify the potential source of the gas. Coal-bed methane lacks the associated higher chain hydrocarbons, such as eth- ane, propane, butane, pentane, and hexane, that may be associ- ated with gases derived from oil and gas reservoirs. Much of
  • 20. 10   Water quality in the Marcellus Shale Gas Field of the Monongahela River Basin, West Virginia, 2011–12 WESTON ELKINS MORGANTOWN CLARKSBURG BUCKHANNON WESTON ELKINS MORGANTOWN CLARKSBURG BUCKHANNON BasefromU.S.GeologicalSurvey,1:200,000,digitallinegraphicsCoalmineboundariesfromWestVirginiaGeologicalandEconomicSurvey,2011b EXPLANATION Minetype Augermine Highwallmine Surfacemine Undergroundmine MonongahelaRiverBasinboundary 020MILES 020KILOMETERS 79°30'80°80°30'81°81°30' 39°30' 39° 38°30' Areaofdetail WV PA OH KY VA MD Figure4. CoalminesintheMonongahelaRiverBasinandadjacentareasinWestVirginia.
  • 21. Introduction   11 the most active development of the Marcellus Shale targets “wet” gas, or gas rich in ethane and other higher alkanes. The study area also includes natural gas storage fields (U.S. Energy Information Agency, 2014). Although the gas presently stored in these fields is increasingly from the Marcellus Shale, the storage fields hold mixtures of natural gas from a wide variety of sources and locations (U.S. Energy Information Agency, 2004). Methods of Study Baseline water-quality conditions were documented through sampling a combination of wells, springs, and stream sites. Because additives to hydraulic fracturing fluids are variable and decrease in flowback water over a relatively short time, water-quality analyses for this study documented major ions, trace elements, radionuclides, and isotopes (table 1) that can be used to identify the different sources of water—potable water derived from shallow aquifers, water derived from contact with the Marcellus Shale (flowback from hydraulic fracturing or formation water), and water with constituents from other oil and gas fields, sewage effluent, and coal-mine drainage. Site Selection Groundwater and surface-water base-flow quality in the Monongahela River Basin was investigated in 2011 and 2012 to establish baseline water-quality conditions for the study area. Wells were sampled in summer 2011, and surface water was sampled, under base-flow conditions, in summer and fall 2012. Groundwater Groundwater samples were collected from 39 wells and 2 springs in the Monongahela River Basin in West Virginia (fig. 5, table 2). The sites were selected from a group of wells and springs sampled as part of the West Virginia Ambient Groundwater Monitoring network (Chambers and others, 2012), and information was obtained from a database of production wells maintained by the West Virginia Bureau for Public Health. The groundwater survey sites were selected to provide wide areal distribution throughout the study area. However, the distribution of production wells was not suf- ficient to provide adequate areal coverage. Therefore, samples were also collected from domestic wells, USGS water-level network wells, other types of wells, or springs to provide addi- tional geographic coverage in areas with few production wells. The criteria for a well to be considered for sampling were as follows: (1) the well had to be less than 25 years old, (2) the well had to have a minimum reported yield of 5 gallons per minute, and (3) the well had to be plumbed or open to allow sampling of raw water prior to any storage tank or treatment. The minimum information required for each well included well depth, location (latitude/longitude), and contributing geologic unit (aquifer). Available well-construction informa- tion was recorded (age, depth, and casing length). An on-site inspection was conducted to verify well-casing integrity and adequate well-pad construction to prevent surface contami- nants from entering the well bore. Existing submersible pumps were most commonly used for water-sample collection, but for a small number of wells, turbine pumps, jet pumps, or a porta- ble submersible pump were used. Well and site characteristics were obtained during a site visit, from drilling logs, and from well-owner records, where available. If both the minimum criteria and the minimum information requirements were met, the well was selected for sampling. The springs were selected for sampling to supplement geographic coverage in areas with few production wells. The springs selected had been previ- ously sampled and documented (Chambers and others, 2012; Kozar and Brown, 1995). Surface Water Surface-water sites were selected using a stratified design on the basis of availability of historical data, basin size and location, Marcellus Shale thickness (Schwietering and Bocan, 2011; West Virginia Geological and Economic Survey, 2011a), and the presence of gas production from wells tapping the Marcellus Shale (West Virginia Geological and Economic Survey, 2014a) in the hydrologic unit in which the stream is located. To be considered for sampling, a site had to have at least one previous sample collected by the USGS that was analyzed for a full set of major ions and had an associated streamflow measurement. The drainage basins for the sites were limited to a range of 10–40 mi2 . Within the study area, 59 surface-water sites met these criteria. Sites were grouped on the basis of gas production at the 12-digit hydrologic unit code (HUC-12) basin level (U.S. Geological Survey, 2005a). Sites were not necessarily at the outlet of the HUC-12. Gas produc- tion data, in thousand cubic feet (Mcf), were downloaded from the West Virginia Geological and Economic Survey (WVGES, 2012) Marcellus Shale webpage (http://www.wvgs.wvnet. edu/www/datastat/devshales.htm) on June 4, 2012, and were complete through 2010 at that time. Production data include information on wells targeting multiple formations, only one of which was the Marcellus Shale. “Marcellus wells,” as used in this section, includes all of these gas wells. The surface-water sites were grouped into “bins” that were designated as “High Production,” “Low Production,” “Near High Production,” “Near Low Production,” “Underlain by the Marcellus Shale greater than 50 feet thick” (Marcellus >50 ft thick), and “Underlain by Marcellus Shale less than 50 ft thick” (Marcellus <50 ft thick). The break point between high and low production was 1,000 thousand cubic feet per square mile per year (Mcf/mi2 /year). The Near High Produc- tion bin included sites in a 10-digit hydrologic unit code basin (HUC-10) with gas production exceeding 1,000 Mcf/mi2 /year from Marcellus Shale wells and a site in a HUC-12 with no gas production from Marcellus Shale wells.
  • 22. 12   Water quality in the Marcellus Shale Gas Field of the Monongahela River Basin, West Virginia, 2011–12 Table 1.  Water-quality properties, major ions, trace elements, naturally occurring radioactive materials, and dissolved gases analyzed for in groundwater and surface-water samples from the Marcellus Shale baseline survey, Monongahela River Basin, West Virginia, 2011–12. [NA, not applicable; °C, degrees Celsius; µS/cm, microsiemens per centimeter; mg/L, milligrams per liter; FNU, formazin nephelometric units; CaCO3 , calcium carbonate; wf, filtered water sample; inflect pt, inflection-point titration; µg/L, micrograms per liter; Cs-137, cesium 137; Th-230, thorium 230; pCi/L, picocuries per liter; δ, per mil; 13 C, carbon-13, 18 O, oxygen-18; 2 H, deuterium; 34 S, sulfur-34; CH4, methane; DIC, dissolved inorganic carbon; H2O, water; SO4, sulfate; --, none; *, groundwater samples only] Constituent or property Reporting limit Constituent or property Reporting limit Temperature, water, °C NA Molybdenum, wf, µg/L 0.014 Specific conductance, µS/cm at 25 °C NA Nickel, wf, µg/L 0.09 Dissolved oxygen, mg/L NA Silver, wf, µg/L 0.005 pH, standard units NA Strontium, wf, µg/L 0.2–0.8 Redox potential, mV* NA Zinc, wf, µg/L 2.0 Turbidity, FNU NA Antimony, wf, µg/L 0.027 Dissolved solids, dry, at 180 °C, mg/L 12 Aluminum, wf, µg/L 1.7–2.2 Alkalinity, wf, inflect, field, mg/L CaCO3 1 Selenium, wf, µg/L 0.05 Carbonate, wf, inflect pt, field, mg/L 1 Gross beta, wf, Cs-137, pCi/L 4 Bicarbonate, wf, inflect pt, field, mg/L 1 Alpha activity, wf, Th-230, pCi/L 3 Calcium, wf, mg/L 0.022–0.04 Uranium, wf, µg/L 0.004 Magnesium, wf, mg/L 0.08 Uranium-238, wf, pCi/L 0.1 Sodium, wf, mg/L 0.1–0.24 Uranium-234, wf, pCi/L 0.1 Potassium, wf, mg/L 0.022 Uranium-235, wf, pCi/L 0.1 Bromide, wf, mg/L 0.010 Radium-224, wf, pCi/L 1 Chloride, wf, mg/L 0.02–0.06 Radium-226, wf, pCi/L 1 Sulfate, wf, mg/L 0.07–0.09 Radium-228, wf, pCi/L 1 Fluoride, wf, mg/L 0.04 δ13 CCH4 * -- Silica, wf, mg/L 0.018–0.029 δ13 CDIC * -- Arsenic, wf, µg/L 0.02–0.10 δ18 OH2O * -- Barium, wf, µg/L 0.07 δ18 OSO4 * -- Beryllium, wf, µg/L 0.006 δ2 HCH4 * -- Boron, wf, µg/L 3.0 δ2 HH2O * -- Cadmium, wf, µg/L 0.016 δ34 SSO4 * -- Chromium, wf, µg/L 0.06–0.07 Nitrogen, N2 , dissolved, mg/L 0.001 Cobalt, wf, µg/L 0.02 Oxygen, O2 , dissolved, mg/L 0.002 Copper, wf, µg/L 0.5–0.8 Argon, dissolved, mg/L 0.003 Iron, wf, µg/L 3.2 Carbon dioxide, dissolved, mg/L 0.04 Lead, wf, µg/L 0.015–0.025 Methane, dissolved, mg/L 0.001 Manganese, wf, µg/L 0.04
  • 23. Introduction   13 Tay-0130 Har-0177 Bar-0150 Pre-0178 Pre-0172 Pre-0164 Pre-0177 Bar-0149 Har-0175 Lew-0215 Lew-0221 Ran-0278 Ran-0284 Pre-0173Pre-0166 Pre-0124 Tuc-0125 Ran-0260 Tuc-0129Tuc-0124 Tuc-0127 Ups-0177 Ran-0275 Ran-0259 Har-0170 Lew-0218 Har-0173 Tay-0129 Mar-0300 Mar-0296 Ran-0282 Ups-0178 Ran-0280 Ran-0277 Ran-0276 Pre-0176 Pre-0162 Pre-0163 Mng-0582 Bar-0151s Ran-0261 (NorthSpringatBowden,WV) WESTON ELKINS MORGANTOWN CLARKSBURG BUCKHANNON WESTON ELKINS MORGANTOWN CLARKSBURG BUCKHANNON BasefromU.S.GeologicalSurvey,1:200,000,digitallinegraphicsCoalmineboundariesfromWestVirginiaGeologicalandEconomicSurvey,2011b EXPLANATION MonongahelaRiverBasinboundary Groundwatersurveysiteandidentifier 020MILES 020KILOMETERS Ups-0177 79°30'80°80°30'81°81°30' 39°30' 39° 38°30' Areaofdetail WV PA OH KY VA MD Figure5. GroundwatersurveysitesintheMonongahelaRiverBasin,WestVirginia,June–September2011.
  • 24. 14   Water quality in the Marcellus Shale Gas Field of the Monongahela River Basin, West Virginia, 2011–12 Table 2.  Site information for wells and springs sampled for the groundwater survey as part of the Marcellus Shale baseline survey, Monongahela River Basin, West Virginia, June–September 2011. [WV, West Virginia; Marcellus<50, site in basin underlain by a less than 50-foot Marcellus Shale thickness and neither a gas producing basin nor adja- cent to a gas producing basin; NA, not applicable] Local well name Geologic unit name1 Well or spring Well depth, in feet Natural gas production bin Mng-0582 Pottsville Group Well 190 Near production Pre-0163 Pottsville Group Well 179 Marcellus<50 Pre-0162 Pottsville Group Well 145 Production Pre-0176 Conemaugh Group Well 200 Near production Ran-0276 Hampshire Formation Well 320 Not near production Ran-0277 New River Formation Well 220 Not near production Ran-0280 Kanawha Formation Well 80 Production Ups-0178 Kanawha Formation Well 158 Production Ran-0282 Kanawha Formation Well 105 Production Mar-0296 Dunkard Group Well 107 Production Mar-0300 Dunkard Group Well 70 Near production Tay-0129 Conemaugh Group Well 113 Production Har-0173 Dunkard Group Well 70 Production Lew-0218 Monongahela Group Well 60 Near production Har-0170 Conemaugh Group Well 75 Near production Ran-0259 Pottsville Group Well 155 Near production Ran-0275 Kanawha Formation Well 500 Production Ran-0261(North Spring at Bowden, WV) Greenbrier Group Spring NA Not near production Ups-0177 Pottsville Group Well 120 Production Tuc-0127 Chemung Group Well 60 Not near production Tuc-0124 Greenbrier Group Well 100 Marcellus<50 Tuc-0129 Greenbrier Group Well 45 Marcellus<50 Ran-0260 Price Formation Well 222 Production Tuc-0125 Greenbrier Group Well 250 Marcellus<50 Pre-0124 Chemung Group Well 205 Not near production Pre-0166 Price Formation Well 100 Marcellus<50 Pre-0173 Conemaugh Group Well 57 Not near production Ran-0284 Hampshire Formation Well 200 Marcellus<50 Ran-0278 Chemung Group Well 100 Not near production Lew-0221 Conemaugh Group Well 100 Production Lew-0215 Monongahela Group Well 100 Near production Har-0175 Conemaugh Group Well 45 Near production Bar-0149 Conemaugh Group Well 180 Production Pre-0177 Greenbrier Group Well 145 Marcellus<50 Pre-0164 Greenbrier Group Well 207 Marcellus<50 Pre-0172 Allegheny Formation Well 65 Production Pre-0178 Conemaugh Group Well NA Production Bar-0150 Conemaugh Group Well 52 Production Har-0177 Monongahela Group Well 150 Production Tay-0130 Conemaugh Group Well 160 Not near production Bar-0151s Conemaugh Group Spring NA Near production 1 Geologic nomenclature used in this report conforms with that used by the West Virginia Geological and Economic Survey, as depicted on the 1968 State geologic map of West Virginia (Cardwell and others, 1968).
  • 25. Introduction   15 The number of sampling sites in a bin was made propor- tional to the ratio of the area of the binned HUC-12s within the study area. For instance, High Production HUC-12s made up 17.2 percent of the basin, so 17.2 percent of the sites had to be from that bin. Since 17.2 percent of 50 is 8.6 and sites could only be selected in increments of integers, the number of sites in that bin was rounded to 9. The category Marcellus <50 ft thick was eliminated from the study because all available sites were underlain by the Marcellus Shale at less than 2 ft thick and judged to be unlikely candidates for future development. The Marcellus <50 ft thick bin made up 10 percent of the overall study area, and the five sites that would have repre- sented this bin were allocated to the Near High Production bin. After setting up the bins, sites were prioritized by assign- ing at least one site from each HUC-10 that was represented, then at least one site in each HUC-12 until the bins filled up (fig. 6). If the only available sites for a bin were within the same HUC-12, then multiple sites from that HUC-12 were used. This was done by assigning random numbers to sites within HUC-10s, and then within HUC-12s, and ranking them by the random numbers. Sites were then sorted by (1) bin, (2) HUC-10 rank, (3) HUC-12 rank, and (4) random number, and ordered within bins. Sites with within-bin rank less than or equal to the number of sites per bin were included in the study, and the next site in rank was assigned as the alternate. Using this procedure, two sites were selected in close proximity on the same stream; one site with three samples collected during 1979–80, and the other with an active streamgage, 64 years of flow data, and numerous water-quality measurements (fig. 7). Both sites drain between 10 mi2 and 20 mi2 . Although this procedure ranked the ungaged site higher, the streamgage site was selected for sampling. Finally, during sampling, field crews visited one of the selected sites shortly after limestone sand had been applied to treat acid mine drainage. That site was dropped from the study and replaced by a site in the same bin but with a drainage area of 40.7 mi2 , which was slightly greater than the original size criterion (table 3, at end of report). Sampling Methods Both groundwater and base-flow samples were collected and processed according to standard USGS operating pro- cedures and protocols. All samples were analyzed for field properties, alkalinity, major ions, trace elements, and uranium (table 1). Field measurements of water temperature, specific conductance, dissolved oxygen concentration, pH, alkalin- ity, and, for groundwater sites, redox potential were made on site according to standard protocols (U.S. Geological Survey, 2006). Samples were processed according to standard USGS protocol (Wilde and others, 2004). Water samples for cat- ion analysis were filtered through a 0.45-micron (μm) filter, collected in an acid-rinsed 250-milliliter (mL) polyethylene bottle, and acidified with 2 mL of nitric acid. Water samples for anion analysis were collected in a 250-mL polyethylene bottle. Water samples for uranium and radium isotope analysis were collected in a 1-liter (L) polyethylene bottle. If uranium was detected in a sample, that sample was further analyzed for uranium and radium isotopes. Analyses for major ions, trace elements, and naturally occurring radioactive materials (NORM) were conducted at the USGS National Water Quality Laboratory (NWQL) in Denver, Colorado. Stable isotope analyses were performed at the West Virginia University Stable Isotope Laboratory in Morgantown, West Virginia, and Isotech Laboratories in Champaign, Illinois. Dissolved gas samples were analyzed at the USGS Dissolved Gas Laboratory in Reston, Virginia. Groundwater Sampling Groundwater samples were collected between June 28 and September 21, 2011. Prior to sampling, wells were purged to remove standing water from the well and ensure that rep- resentative water samples were collected. A minimum of one well volume was purged from most wells; high-use produc- tion wells that did not require purging or low-yielding wells that would not recover from purging were pumped until field properties stabilized. Field measurements of dissolved oxygen, pH, specific conductance, water temperature, and turbidity were monitored during purging by using a multi-parameter water-quality meter, which was calibrated daily. Water level was also monitored where possible. Sample tubing typically was connected to a ¾-in. hose bib as close to the wellhead as possible, and pumps were kept on to prevent sample contami- nation from the plumbing or from backflow from holding tanks. Existing plumbing and well-casing materials included, but were not limited to, steel, galvanized steel, copper, polyvi- nyl chloride (PVC), and other plastics. The purging procedure prescribed was assumed to have prevented contamination from plumbing materials. Samples were collected after field proper- ties stabilized, according to standard USGS protocols for the collection of water-quality data (U. S. Geological Survey, 2006). Each of the sampled springs discharges into a collec- tion basin, and samples from springs were collected using a peristaltic pump to draw water from the collection basin. Subsurface-dip samples were collected from the spring’s col- lection basin for dissolved gas analyses. Field properties were measured in the collection basin before and during sample collection to monitor the stability of the spring’s discharge. To prevent environmental contamination, samples typically were collected and processed inside a mobile field laboratory or a portable chamber assembled near the well or the spring. Base-Flow Sampling Base-flow samples were collected from 50 sites in the Monongahela River Basin during seasonal base-flow condi- tions between July 31 and October 26, 2012. Samples were collected using methods described in the USGS National Field Manual for the collection of Water-Quality Data (U.S. Geological Survey, 2006). Where possible, depth- and
  • 26. 16   Water quality in the Marcellus Shale Gas Field of the Monongahela River Basin, West Virginia, 2011–12 Wastheproductionin thesameHUC12asthe site? Wastheproductionin thesameHUC12asthe site? Allstreamsitesinthe MonongahelaRiverBasin withinWestVirginia Atleastoneprevious USGSsamplewith major-ionchemistry? UnderlainbyMarcellus Shalewithaverage thickness<2feet? InsideHUC10with gasproductionfrom Marcelluswells? DidHUC10gas productionexceed 1,000MCF/mi2 /yr? Between10mi2 and40mi2 drainagearea? AtleastoneUSGS samplewithmajor-ion chemistry? UnderlainbyMarcellus Shaleanaverageof >50feetthick? Part1—Developmentoftiers Part2—Selectionofsiteswithinbins LowProduction(LP) (7sites) Near-LowProduction(NearLP) (12sites) HighProduction(HP) (9sites) Near-HighProduction(NearHP) 7sites UnderlainbyMarcellusshale greaterthan50feetthick (15sites) UnderlainbyMarcellusshale lessthan50feetthick (nosites) Assignedatleastonesitefromeach HUC10byrandomnumber Assignedatleastonesitefromeach HUC12byrandomnumber Wheretheonlyavailablesitesfor abinwerewithinthesameHUC12, usemultiplesiteswithinthatHUC12, rankedbyrandomnumber Eliminatedfromconsideration Yes Yes Yes Yes Yes No No Yes No No No No Yes No Yes No Yes No Marcellusgasproductionbins Figure6. Flowchartshowingtheprocessforstratifyingstream-watersamplingsites.
  • 27. Introduction   17 WVFk ElkCk PolkCk LostCk MillCk SandyCk SandyCk TeterCk RightFk FilesCk BeckyCk SalemCk PylesFk GladyFk PecksRun DollsRun BrushyFk LaurelFk FrenchCk GnattyCk IndianCkIndianCk DeckersCk BuffaloCkTenmileCk LeadingCk HusteadFk PawPawCk TenmileCk LaurelRun MinearRun RoaringCk CloverRun HackersCk SimpsonCk SaltlickCk FreemansCk MiracleRun WhitedayCk BingamonCk PrickettsCk ChenowethCk HorseshoeRun NorthFkBlackwater RightFkBuckhannon TygartatValleyHead WestFkatWalkersville SandRunnearBuckhannon LeftFkBuckhannonatCzar LeftFkBuckhannonatPalaceValley WVFk ElkCk PolkCk LostCk MillCk SandyCk SandyCk TeterCk RightFk FilesCk BeckyCk SalemCk PylesFk GladyFk PecksRun DollsRun BrushyFk LaurelFk FrenchCk GnattyCk IndianCkIndianCk DeckersCk BuffaloCkTenmileCk LeadingCk HusteadFk PawPawCk TenmileCk LaurelRun MinearRun RoaringCk CloverRun HackersCk SimpsonCk SaltlickCk FreemansCk MiracleRun WhitedayCk BingamonCk PrickettsCk ChenowethCk HorseshoeRun NorthFkBlackwater RightFkBuckhannon TygartatValleyHead WestFkatWalkersville SandRunnearBuckhannon LeftFkBuckhannonatCzar LeftFkBuckhannonatPalaceValley BasefromU.S.GeologicalSurvey,1:200,000,digitallinegraphicsMarcellusShalewellsandgasproductiondatafromWestVirginiaGeologicalandEconomicSurvey,2011b 020MILES 020KILOMETERS EXPLANATION MarcellusShalegasproductionbin HighProduction LowProduction NearHighProduction NearLowProduction UnderlainbyMarcellusgreaterthan50feetthick UnderlainbyMarcelluslessthan50feetthick Level-12hydrologicunitboundary Stream SamplingsiteandlocalidentifierPylesFk 79°30'80°80°30'81°81°30' 39°30' 39° 38°30' Areaofdetail WV PA OH KY VA MD Figure7. Streams,streamsamplingsites,gaswellscompletedintheMarcellusShalethrough2012showinggasproductionthrough2010,andaverage thicknessoftheMarcellusShalebyHUC-12.
  • 28. 18   Water quality in the Marcellus Shale Gas Field of the Monongahela River Basin, West Virginia, 2011–12 width-integrated samples were collected using a DH-81 isokinetic sampler. Where site conditions did not support the use of a DH-81, such as insufficient stream depth or velocity, samples were collected at multiple points using an open- mouthed bottle. Sample aliquots were composited in a churn splitter and processed according to standard USGS protocols (U.S. Geological Survey, 2006). Field properties of water temperature, specific conductance, dissolved oxygen concen- tration, pH, alkalinity, and stream discharge were measured at the time of sample collection. Methods of Analysis The results of the groundwater survey and base-flow survey were examined for geospatial and statistical rela- tions. The geospatial and statistical analyses of the water- chemistry results were conducted to discern patterns in these data. Details of these analyses are described in the following two sections. Geospatial Analyses The wells and springs sampled and the associated water- chemistry data were assessed for spatial trends by loading the data into ArcMap, a geographic information system (GIS) tool for analysis of geospatial data. Additional geospatial data were used to assess potential factors that could affect groundwater quality in the region. The geospatial data included (1) location of current and legacy coal mines obtained from the WVGES (West Virginia Geological and Economic Survey, 2011b), (2) location of current active or recently completed Marcellus Shale gas wells (from WVGES, West Virginia Geological and Economic Survey, 2014a), (3) geologic maps of the study area with significant surficial and deeper structural features such as faults and folds (from WVGES), (4) location of current and historical oil and gas wells (from WVGES), (5) elevation data from the USGS National Elevation Dataset, (6) stream coverages from the USGS National Hydrography Dataset (NHD), and (7) basin characteristics derived from the USGS NHD database. Statistical Analyses Descriptive and summary statistics were calculated using Spotfire S-PLUS 8.1 statistical and graphing software (TIBCO Software, Inc., 2008). Descriptive and summary statistics for censored data sets, those with values less than the reporting level, were calculated using the Regression on Order Sta- tistics (ROS) and adjusted maximum likelihood estimation (AMLE) techniques (TIBCO Software Inc., 2008). Statistics were not calculated for sample sets of less than 10 data points. Kruskal-Wallis rank test was used for comparison of medians among groups. A Tukey’s Honest-Significant-Difference post hoc test was used for multiple comparisons. Relations among several variables were analyzed through Principal Compo- nents Analysis (PCA). Analysis of groundwater-quality data for geochemical processes was performed using the PCA in Spotfire S-PLUS 8.1 statistical and graphing software. Quality Assurance Quality-assurance samples, blanks, and replicates were collected during both the groundwater sampling and the surface-water base-flow sampling. Blank samples are used to determine the extent to which sampling procedures may con- taminate samples, thereby biasing analytical results. Replicate samples are used to determine the variability inherent in the collection and analysis of environmental samples. Together, blank and replicate samples can be used to characterize the accuracy and precision of water-quality data. All quality- assurance samples were collected and processed according to protocols described in the USGS National Field Manual for the Collection of Water-Quality Data (U.S. Geological Survey, 2006). Blank Samples A combination of equipment blanks and field blanks was used to identify and quantify potential sources of contamina- tion. An equipment blank consists of a volume of water of known quality that is processed through the sampling equip- ment in a laboratory environment. A field blank consists of a volume of water processed through the sampling equipment under the same field conditions in which the samples were processed, typically a mobile field laboratory. Replicate Samples Comparison of results among replicate samples can pro- vide insight into the sources of variability that are inherent in sample collection, processing, and analysis. Sample-collection protocols (U.S. Geological Survey, 2006) for groundwater and base-flow samples have been developed to produce a sample that is representative of the sampled well, spring, or stream. If the appropriate sampling procedures have been used, it is assumed that the water being collected is representative of the sampled environment and that any variability among the main and replicate sample is primarily attributable to sample processing and analysis (Koterba and others, 1995). Variability for a replicate sample pair was quantified by calculating the relative percent difference (RPD) of the sam- ples. The RPD was calculated using the following formula: R1 − R2 R1 + R2 2 ⎛ ⎝⎜ ⎞ ⎠⎟ ⎛ ⎝ ⎜ ⎜ ⎜ ⎞ ⎠ ⎟ ⎟ ⎟ ×100, where R1 is the concentration of the analyte in the first repli- cate sample and R2 is the concentration of the analyte in the second replicate sample. Generally, concentrations in replicate sample pairs differed by small amounts, typically less than 15 percent RPD.
  • 29. Water Quality in the Monongahela River Basin    19 Quality-Assurance Results Groundwater Samples An equipment blank was collected prior to collection of groundwater samples in 2011. The blank sample was analyzed using the same analytical suite as the environmental samples. The only analyte present in this blank at a detectable concen- tration was cobalt, at 0.052 micrograms per liter (µg/L); the detection was confirmed through a re-analysis of the sample. The detection appears anomalous because cobalt concentra- tions in 15 of the 41 environmental samples processed using this equipment were lower than the concentrations detected in the blank sample. Replicate samples were collected at two sites, Har-0177 and Ran-0259 (table 2), during the groundwater survey. In general, the replicate samples were in good agreement, with most analyses within 5 percent RPD. All values for the Har-0177 sample pair were within 15 percent RPD. How- ever, the replicate samples from Ran-0259 differed by more than 15 percent RPD for aluminum and arsenic. The alu- minum results for the Ran-0259 sample pair were 3.4 µg/L and 2.1 µg/L, a difference of 47 percent RPD. The reporting level for aluminum analysis using this method was 1.7 µg/L. However, the long-term minimum detection level (LTMDL) for this method is 2.2 µg/L, a value calculated using data from the period this sample pair was analyzed. The sample pair results for arsenic were 0.1 µg/L and 0.08 µg/L, a difference of 22 percent RPD with a reporting level of 0.04 µg/L. Base-Flow Samples Field blank samples were collected at the Tygart Valley River at Valley Head and the Elk Creek at Romines Mills sites. Lead was the only analyte detected in the Tygart Valley River blank with a concentration of 0.027 µg/L, 0.002 µg/L greater than the method reporting level of 0.025 mg/L. Lead was not detected in the environmental sample collected from the Tygart Valley River. Both silica and cobalt were detected in the Elk Creek blank, silica at 0.043 milligrams per liter (mg/L) and cobalt 0.038 µg/L, analytes with laboratory reporting limits of 0.018 mg/L and 0.021 µg/L, respectively. The silica concentration in the blank is much lower than the minimum environmental concentration of 1.68 mg/L measured and two orders of magnitude less than the median environmental concentration. It is unlikely silica contamination significantly affected the analysis of any environmental sample or the inter- pretation of the data. Cobalt concentrations in environmental samples ranged from 0.043 to 20.6 µg/L. The cobalt concen- trations in samples collected in the weeks immediately prior to collection of the blank sample were an order of magnitude greater than concentrations for the blank. The Tygart Valley River blank, which had no detectable cobalt, was processed the week following the Elk Creek blank. The presence of cobalt at a detectable concentration in the Elk Creek blank is unlikely to affect the interpretation of cobalt data. A replicate sample was collected at Little Sandy Creek at Evansville, W.Va. A replicate sample consists of two samples collected from the same sampling location at the same time. Replicate samples chiefly provide data on variability associ- ated with sampling and analytical methods. The replicate sample pair agreed well; concentrations for 32 of 37 analytes in both samples differed by less than 5 percent RPD. Only one analyte in this sample pair, molybdenum, differed by greater than 15 percent RPD, at17 percent RPD. The concentrations of molybdenum for the sample pair were 0.019 µg/L and 0.016 µg/L, and the reporting level was 0.014 µg/L. Water Quality in the Monongahela River Basin The baseline water-quality assessment of that part of the Monongahela River Basin underlain by the Marcellus Shale consisted of a groundwater survey and a base-flow survey. The results of both surveys were compared to historical water- quality data for the study area stored in NWIS databases. His- torical data used for comparison to the base-flow survey data were restricted to samples collected during the same season, July through October. For the base-flow survey results, further comparisons were made among gas-production bins described in the section “Surface Water” under “Site Selection.” Owing to the small number of sites in some of the bins, a simpli- fied classification structure was used consisting of only three bins— Production, basins with high or low gas production; Near Production, basins without gas production but adjacent to production basins; and Not Near Production, basins under- lain by greater than a 50-ft thickness of the Marcellus Shale but neither producing gas nor adjacent to a Marcellus Shale gas-producing basin. Groundwater-survey sites were binned using the same basin designation as that used for the base-flow survey with the addition of a fourth group “Marcellus <50” for groundwater sites not in basins underlain by at least a 50-ft thickness of the Marcellus shale. These comparisons reflect both temporal and current land-use patterns. The results of this study can be found in data tables included in the appendixes for this report; groundwater survey results are in Appendix 1, and the base-flow survey results are in Appendix 2. Specific Conductance, Total Dissolved Solids, and pH Specific conductance and pH of groundwater and surface water provide a general indication of water quality and can affect other chemical constituents present by affect- ing solubility, partitioning, and valence states. Although much of the variability of specific conductance and pH in groundwater is due to natural factors, human activities, such
  • 30. 20   Water quality in the Marcellus Shale Gas Field of the Monongahela River Basin, West Virginia, 2011–12 as coal mining, also contribute to this variability (McAuley and Kozar, 2006). Total dissolved solids, the concentration of dissolved substances in water, is often highly correlated with specific conductance. Specific Conductance Specific conductance, the ability of water to conduct an electrical current, is dependent upon the amount of dissolved ions present in the water. Specific conductance in ground- water samples ranged from 44 microsiemens per centimeter at 25 degrees Celsius (µS/cm) to 794 µS/cm, with a median value of 295 µS/cm. In the base-flow survey samples, specific conductance ranged from 56 µS/cm to 5,380 µS/cm with a median value of 280 µS/cm (table 4). It is worth noting that although the minimum and median specific conductance values for the groundwater and base-flow surveys are similar, the maximum value for the groundwater survey is an order of magnitude lower than the median value for the base-flow survey. Specific conductance did not differ significantly from historical values in either the groundwater survey or the base- flow survey (fig. 8). Specific conductance varied significantly among the base-flow survey gas-production bins (Kruskal- Wallis test, p = 0.011) with the highest values in the Produc- tion bin (fig. 9). The groundwater production bins did not differ in regard to specific conductance (p = 0.435). Table 4.  Statistical summary of water-quality field measurements and major ions in samples collected for the groundwater survey and base-flow survey as part of the Marcellus Shale baseline survey, Monongahela River Basin, West Virginia, 2011–12. [µS/cm, microsiemens per centimeter at 25 degrees Celsius; mg/L, milligrams per liter; wf, filtered sample; SMCL, secondary maximum contaminant level (U.S. Environmental Protection Agency, 2009); <, less than; NA, not applicable] Constituent Reporting unit Method reporting level Survey Minimum value Maximum value Median value SMCL pH Standard unit NA Groundwater 4.5 9.4 7 6.5–8.5 Base flow 4.8 8.7 7.7 Specific conductance µS/cm NA Groundwater 44 794 295 NA Base flow 56 5,380 280 Total dissolved solids mg/L 12 Groundwater <12 522 168 NA Base flow 37 4,380 171 Calcium, wf mg/L 0.022–0.04 Groundwater 0.672 91 16.9 NA Base flow 5.51 291 28.3 Magnesium, wf mg/L 0.08 Groundwater 0.105 19.1 4.07 NA Base flow 1.26 86.3 28.3 Potassium, wf mg/L 0.022 Groundwater 0.43 2.9 1.17 NA Base flow 0.66 8.85 1.98 Sodium, wf mg/L 0.1–0.24 Groundwater 0.46 186 17.2 NA Base flow 0.89 949 8.31 Bicarbonate, wf mg/L 1. Groundwater 2.3 382 99.8 NA Base flow <1 401 65 Chloride, wf mg/L 0.02–0.06 Groundwater 0.57 67.6 9.42 250 Base flow 0.87 100 6.94 Bromide, wf mg/L 0.010 Groundwater <0.01 0.598 0.027 NA Base flow 0.014 0.692 0.031 Fluoride, wf mg/L 0.04 Groundwater <0.04 1.85 0.1 4 Base flow <0.04 0.27 .06 Sulfate, wf mg/L 0.07–0.9 Groundwater <0.09 231 10.18 250 Base flow 3.42 2,640 9.1
  • 31. Water Quality in the Monongahela River Basin    21 (59)(41) (254)(50) 75th percentile 25th percentile Median (50th percentile) 1.5 times interquartile range Number of samples -1.5 times interquartile range Outlier (50) EXPLANATION 10 100 1,000 10,000 A 10 100 1,000 10,000 B 2011 survey Historical 2012 survey Historical Groundwater samples Base-flow samples Specificconductance,inmicrosiemenspercentimeter at25degreesCelsius Specificconductance,inmicrosiemenspercentimeter at25degreesCelsius Figure 8.  Distribution of specific conductance for samples collected as part of the Marcellus Shale baseline study, 2011–12, and historical specific conductance for samples collected in the Monongahela River Basin, West Virginia: A, groundwater samples and B, base-flow samples. 75th percentile 25th percentile Median (50th percentile) 1.5 times interquartile range Number of samples -1.5 times interquartile range Outlier (8) EXPLANATION A 10 100 1,000 10,000 10 100 1,000 10,000 B Notnearproduction Marcellus,lessthan50feet Production Nearproduction Notnearproduction Production Nearproduction Groundwater samples Base-flow samples Specificconductance,inmicrosiemenspercentimeter at25degreesCelsius Specificconductance,inmicrosiemenspercentimeter at25degreesCelsius (16)(8) (8) (9) (17)(20)(13) Figure 9.  Distribution of specific conductance for samples collected as part of the Marcellus Shale baseline study, Monongahela River Basin, West Virginia, 2011–12, grouped by gas production type: A, groundwater samples and B, base-flow samples.
  • 32. 22   Water quality in the Marcellus Shale Gas Field of the Monongahela River Basin, West Virginia, 2011–12 Total Dissolved Solids Concentrations of total dissolved solids in groundwa- ter survey samples ranged from less than the reporting level of 12 mg/L to 522 mg/L with a median value of 168 mg/L. Concentrations of total dissolved solids in base-flow survey samples ranged from 37 mg/L to 4,380 mg/L with a median of 171 mg/L (table 4), the same as the median groundwater concentration. As with specific conductance, there are no significant differences between historical data and either groundwater survey or base-flow survey data. Also, as was the case for specific conductance, total dissolved solids concentra- tions in base-flow survey samples varied significantly by gas- production bin (Kruskal-Wallis test, p = 0.019). The highest concentrations were in the Production bin, and there were no significant differences among the groundwater survey gas- production bins. pH The pH of a solution plays an important role in the solu- bility of metals. The pH of the groundwater survey samples ranged from 4.5 to 9.4 with a median of 7.0. The pH of base- flow survey samples ranged from 4.8 to 8.7 with a median of 7.7 (table 4). The U.S. Environmental Protection Agency (EPA) has established a secondary maximum contaminant level (SMCL) for pH. The SMCL is a recommendation based on aesthetic effects, primarily taste, that ideally pH would fall within the range of 6.5 to 8.5 (U.S. Environmental Protection Agency, 2009). A total of 14 samples fell outside the SMCL range—9 groundwater samples, (6 samples were less than 6.5 and 3 samples exceeded 8.5) and 5 base-flow samples (2 samples were less than 6.5 and 3 samples exceeded 8.5). Values of pH in samples collected for the 2011ground- water survey did not differ significantly from values of the historical data (fig. 10). However, pH measured during the 2012 base-flow survey was significantly higher than histori- cal values (Kruskal-Wallis test, p < 0.001). The difference between base-flow survey pH values and historical pH values is most likely attributable to changes in coal-mining practices and acid-mine-drainage treatment that have occurred between the 2012 and historical surveys. Among base-flow survey samples, pH values in the Production bin were higher than those in the Not Near Production bin (Kruskal-Wallis test, p = 0.097) (fig. 11A). There was no difference among ground- water survey bins (Kruskal-Wallis test, p = 0.252) (fig. 11B). Major Ions The major ions calcium, magnesium, potassium, sodium, bicarbonate from field alkalinity, chloride, and sulfate exert a strong influence on, and are strongly influenced by, geo- chemical and anthropogenic processes. Patterns in major ion composition were examined by determination of water type, as well as comparison of historical and 2011–12 survey data. For the base-flow survey samples, further comparisons were made among the gas-production bins. The relative proportion of major ions in natural waters is the basis for classifying samples by water type. Water (59)(41) (236)(50) 75th percentile 25th percentile Median (50th percentile) 1.5 times interquartile range Number of samples -1.5 times interquartile range Outlier (50) EXPLANATION 3 5 4 10 A 3 4 5 6 8 7 6 7 8 9 9 10 B pH,instandardunits pH,instandardunits 2011 survey Historical Groundwater samples 2011 survey Historical Base-flow samples Figure 10.  Distribution of pH in samples collected as part of the Marcellus Shale baseline study, 2011–12, and historical pH in samples from the Monongahela River Basin, West Virginia: A, groundwater samples and B, base-flow samples.
  • 33. Water Quality in the Monongahela River Basin    23 75th percentile 25th percentile Median (50th percentile) 1.5 times interquartile range Number of samples -1.5 times interquartile range Outlier (50) EXPLANATION 4 5 10 A 4 5 6 8 7 6 7 8 9 9 10 B pH,instandardunits pH,instandardunits Notnearproduction Marcellus,lessthan50feet Production Nearproduction Notnearproduction Production Nearproduction Groundwater samples Base-flow samples (16)(8) (8) (9) (17)(20)(13) Figure 11.  Distribution of pH in samples collected as part of the Marcellus Shale baseline study in the Monongahela River Basin, West Virginia, 2011–12: A, groundwater samples and B, base-flow samples. samples with a specific cation or anion constituting more than one-half the total cations or anions can be classified by water type, calcium-carbonate type water for example (Hem, 1985). However, waters in which no single cation or anion constitutes greater than one-half of the total cations or anions are classed as mixed-type waters (Hem, 1985). Major-ion composition of the water for the 41 ground- water samples was predominantly either a calcium-bicar- bonate type or a sodium-bicarbonate type (fig. 12A). A few wells exhibited other signatures, however, including 3 wells (2 completed in the Pottsville Group and one in the Kanawha Formation) that exhibited a calcium-sulfate signature and 1 well (completed in the Allegheny Formation) that exhibited a sodium-sulfate signature. Wells completed in the Green- brier Group exhibited a strong calcium-bicarbonate signature, which is expected because the Greenbrier Limestone is a significant karst bedrock-forming unit in the study area. The major ion composition of the groundwater sur- vey samples (fig. 12A) is similar to that found in a study of groundwater downgradient from reclaimed surface mines and in unmined areas in Pennsylvania and West Virginia (McAuley and Kozar, 2006), part of which was conducted in the Monongahela River Basin. In that study, median chloride concentrations for mined and un-mined areas were 5.1 mg/L and 7.3 mg/L, respectively; median sodium concentrations for mined and unmined areas were 9.35 mg/L and 18.0 mg/L, respectively. Median calcium concentrations for mined and unmined areas were 35.9 mg/L and 21.0 mg/L, respectively, and median magnesium concentrations for mined and unmined areas were 9.9 mg/L and 4.4 mg/L, respectively. Median chlo- ride concentrations for wells sampled as part of the current study were slightly higher (table 4) at 9.42 mg/L. Salt waters and brines are found as shallow as 300 feet below land surface in certain valleys in Pennsylvanian- and Permian-aged aquifers (Wilmoth, 1975). Chloride and bromide concentrations can be indicative of salt waters and brines. Chloride concentrations in groundwater survey samples ranged from 0.57 mg/L to 67.6 mg/L with a median value of 9.42 mg/L, and bromide ranged from less than the reporting level of 0.010 mg/L to 0.598 mg/L with a median value of 0.027 mg/L. The relative concentrations of chlo- ride and bromide can be used to characterize sources of salt waters and brines because bromide concentrations are greater than chloride concentrations in deep brines (Hem, 1985).
  • 34. 24   Water quality in the Marcellus Shale Gas Field of the Monongahela River Basin, West Virginia, 2011–12 EXPLANATION Dunkard Group Monongahela Group Conemaugh Group Allegheny Formation Kanawha Formation New River Formation Pottsville Group Greenbrier Group Price Formation Hampshire Formation Chemung Group EXPLANATION Near Production Not Near Production Production Percent Calcium 100 80 60 40 20 0 0 20 40 60 80 100 Magnesium 0 20 40 60 80 100 Sodiumpluspotassium Chloride plus fluoride 0 20 40 60 80 100 100 80 60 40 20 0 Carbonateplusbicarbonate 100 80 60 40 20 0 Sulfate 0 20 40 60 80 100 Sulfatepluschloride 0 20 40 60 80 100 Calciumplusmagnesium 100 80 60 40 20 0 100 80 60 40 20 0 Percent Percent Percent Calcium 100 80 60 40 20 0 0 20 40 60 80 100 Magnesium 0 20 40 60 80 100 Sodiumpluspotassium Chloride, fluoride. nitrite, plus nitrate 0 20 40 60 80 100 100 80 60 40 20 0 Carbonateplusbicarbonate 100 80 60 40 20 0 Sulfate 0 20 40 60 80 100 Sulfatepluschloride 0 20 40 60 80 100 Calciumplusmagnesium 100 80 60 40 20 0 100 80 60 40 20 0 Percent Percent A B Figure 12.  Piper diagrams showing major ion composition of samples collected as part of the Marcellus Shale baseline study, 2011–12, from the Monongahela River Basin, West Virginia: A, groundwater survey samples classified by geologic formation and B, base-flow survey samples.