SlideShare une entreprise Scribd logo
1  sur  13
Sustainable Development in Popular Newspapers

How is coverage in De Telegraaf influenced by other
newspapers’ attention to sustainable development?


    ARIMA modelling with (G)ARCH and Fractional Integration


                            Assignment 6


            Mark Boukes (markboukes@Hotmail.com)
                              5616298


                       1st semester 2010/2011
                       Dynamic Data Analysis
                     Lecturer: Dr. R. Vliegenthart
                          December 23, 2010


                                  Communication Science (Research MSc)
                                Faculty of Social and Behavioural Sciences
                                                  University of Amsterdam
Table of contents


INTRODUCTION.............................................................................................................................................1
METHOD........................................................................................................................................................1
RESULTS........................................................................................................................................................2
    ARIMA MODEL.......................................................................................................................................................2
    THE CONDITIONAL VARIANCE..........................................................................................................................................5
CONCLUSION.................................................................................................................................................6
REFERENCE....................................................................................................................................................6
DO FILE..........................................................................................................................................................6
Introduction
In this study I aim to investigate the influence news coverage in a particular newspaper has on
the coverage of another newspaper. For this purpose, I have chosen a specific topic,
sustainable development, that seems to get a lot media attention in the last years. The topic of
sustainable development was chosen, because it can be related to several parts of society, such
as the economy, science and also for the man in the street this topic is relevant.
       As those different parts of society are represented by different media, it is interesting
to see how they influence each other on the amount of attention that is paid to this issue. Will
an increase in attention of business men’s newspapers result in an increase of attention in
newspapers that deal with popular issues; and how is this newspaper affected by a newspaper
that is more focused on scientific issues? In brief, How is the attention in a popular
newspaper caused by attention in scientific and economic newspapers. The most read popular
newspaper in the Netherlands is De Telegraaf, a newspaper that has a main financial or
business focus is Het Financieele Dagblad, and NRC Handelsblad is known for its relative
large attention to scientific developments. The effects of both Het Financieele Dagblad and
NRC Handelsblad are expected to be positive on the coverage of De Telegraaf. My hypothesis
is therefore:
    An increase in the number of articles about sustainable development in Het Financieele
    Dagblad or in NRC Handelsblad is likely to be followed by a increase in the number of
    articles this topic in coverage of de Telegraaf in future weeks.

Method
In order to investigate whether changes in the number of articles about sustainable development
in NRC Handelsblad and Het Financieele Dagblad have an effect on De Telegraafs’s news, a
dataset was created via a computer-assisted content analysis, which was conducted using the
digital archive of the Web-based version of LexisNexis. Articles were selected via the
Boolean search term duurza! OR "groene energie" OR "zonne-energie" OR "windenergie".
The period I analyzed was from 1 January 1999 until 31 December 2009. This period was
chosen, because information about De Telegraaf is only available from 1999. The search
procedure was repeated three times; one time for every newspaper, so three variables could be
created by aggregating the data on a weekly basis. A weekly basis is chosen, because it is
more detailed than the monthly basis, whereas a daily basis would lead to many days on
which no coverage was found, what consequently meant that a lot cases had to be filled in by
hand. A total of 35225 articles were found for 581 weeks; 18501 in Het Financieele Dagblad,
10335 in NRC Handelsblad and 6389 in De Telegraaf.


                                                                                                   1
To analyse the effects on the coverage of De Telegraaf, first an adequate ARIMA
model is developed using Stata 10.1 for the time series of this variable, this was followed by
adding a GARCH term to model the volatility, thereafter the independent variables were
added to the model, resulting in a multivariate ARIMA model.

Results
In this results section, I specify how the analysis was conducted and discuss the results that
were found. I followed the ARIMA-framework described by Vliegenthart (n.d.) to make the
base ARIMA-model, thereafter GARCH-terms were added to take heteroscedasticity into
account and finally the independent variables were added to the model.

ARIMA model
Figure 1 plots the time series of the attention in the three newspapers for the period that we
are studying. It seems that Het Financieele Dagblad pays the most attention to sustainable
development and De Telegraaf the least attention. The amount of attention seems to be rising
a little over time, but this is not confirmed by augmented Dickey-Fuller tests (see Table 1);
hypotheses for unit root are rejected. However the results were close to insignificant and the
graphs also show that there is some upward trend. Therefore, the data were fractionally
integrated at a level of 0.352 following the Robinson (1995) multivariate estimate of the long
memory (fractional integration) parameters for the number of articles in De Telegraaf.


Figure 1. The number of articles about sustainable development over time in the three
          newspapers of interest.


                                                                                                 2
Table 1. The results of augmented Dickey-Fuller tests for the amount of articles over time
 Augmented Dickey-Fuller test          Telegraaf     FD           NRC
Random walk without drift              -6.560        -4.990       -5.596
Random walk with drift                 -10.878       -10.104      -14.525
Random walk with drift and trend       -16.487       -15.716      -16.751
                                                   FI.Telegraaf      FI.FD         FI.NRC
Random walk without drift                          -11.756           -8.938        -10.011
Random walk with drift                             -18.478           -17.020       -22.947
Random walk with drift and trend                   -25.563           -24.102       -25.383
Note. All tests indicate the absence of a unit root. FI, fractionally integrated


The next step was predicting the number of articles about sustainable development as good as
possible by accounting for its own past, either with autoregressive (AR) terms, moving
average (MA) terms or both. This was done by inspecting the autocorrelation (ACF) and
partial autocorrelation functions (PACF). The ACF graph showed an unclear pattern, while
the PACF graph displays a declining pattern for the first lags. This pattern is indicative for a
process with a moving average at lag 1. A ARIMA (0,0.352,1) model seems thus the right
choice. This model was tested for autocorrelation with the Ljung–Box Q test statistic and for
the presence of conditional heteroscedasticity with the Engle-Granger test. A significant result
for the Ljung-Box Q-test for autocorrelation (20 lags) was found, meaning that the null
hypothesis of white noise was rejected and that the absence of autocorrelation cannot be
assumed (Q = 807.40, p < 0.001). Therefore, to avoid autocorrelation in the ARIMA-model, it
was extended with an autoregressive term at lag 1 and a moving average term at lag 2;
following the ACF and PACF graphs for every extension until the residuals of the AR(1)-
I(0.352)-MA(1,2)-model did reflect no autocorrelation (Q = 24.89, p = 0.206). However, it
seems not possible to reduce the Ljung-Box test statistic Q2 based on the squared residuals to
insignificance, with AR or MA terms only. This means that there is a strong temporal
dependency in the variance of the number of Telegraaf articles about sustainable
development; heteroscedasticity. Residuals of the last ARIMA model were saved and are later
analysed to see how the conditional variance of the number of articles in De Telegraaf was
affected by changes in the number of articles in the other two newspapers.
         To avoid the heteroscedasticity in the model, it was necessary to model also the
conditional variance of the dependent variable, either with autoregressive conditional
heteroscedasticity (ARCH) terms or with a combination of ARCH and generalized
autoregressive conditional heteroscedasticity (GARCH) terms. This last option was chosen,
because it has considerable better model fit according to Akaike Info Criterion (AIC) and the


                                                                                                   3
Bayesian information criterion (BIC) (ΔAIC = 104.94, ΔBIC = 100.573). The results of this
general model are showed in Table 2. The ARCH and GARCH terms are both statistically
significant and positive. This indicates that that innovations in the prior period increase
conditional variance in a next period. Periods of high volatility are thus likely to be grouped
together in time. The autoregressive and moving average terms are also significant, meaning
that a particular number of articles in some week in De Telegraaf, are partly determined by
the number of articles in this newpaper the week before and two weeks before.

Table 2. GARCH models: number of Telegraaf articles about sustainable development
                                        General GARCH model          GARCH with independent variables
Constant                                   2.502 (0.634)*                  1.637 (0.638)*
Autoregressive (t - 1)                     1.007 (0.001)*                  1.007 (0.001)*
Moving average (t - 1)                    -1.125 (0.045)*                 -1.154 (0.046)*
Moving average (t - 2)                     0.128 (0.045)*                  0.156 (0.046)*

ARCH term                                   0.050 (0.013)*                   0.047 (0.012)*
GARCH term                                  0.958 (0.010)*                   0.961 (0.010)*
NRC Handelsblad (t - 1)                                                      0.052 (0.030)a
Het Financieele Dagblad (t - 1)                                              0.047 (0.023)*

Ljung-Box Q(20) residuals                          25.92                          25.91
AIC                                              3599.80                         3590.38
BIC                                              3630.34                         3629.63
Note. Unstandardized coefficients. Standard errors in parentheses;
* p < 0.05 , a = 0.091

Now a model was built that properly accounts for its own past and heteroscedasticity, the
analysis could go on with the next step: assessing the impact of the amount of news coverage
about sustainable development in NRC Handelsblad and Het Financieele Dagblad on that of
the coverage in De Telegraaf. The cross-correlation function (CCF) for the residuals of this
GARCH model and for the amount of coverage in NRC, and the CCF for the residuals with
the coverage in Het Financieele Dagblad, indicate both that strong association is present when
coverage in both newspapers is lagged at 1 week. The results of the GARCH model that
included these two independent variables can also be found in Table 2.
        The results indicate that news coverage about sustainable development in Het
Financieele Dagblad (FD) had a significant positive effect on coverage about this issue in De
Telegraaf. A one article increase in FD, did on average result in a 0.05 article increase in the
next week’s coverage of De Telegraaf. The effect of NRC Handelsblad is not significant,
following a two-tailed test with 95% confidence interval. However, because this effect is
expected to be positive, a one-tailed test can be used. Then the effect of NRC Handelsblad’s


                                                                                                        4
coverage about sustainable development also becomes significant (χ2 = 2.85, p = 0.0456). A
one article increase about sustainable development in NRC Handelsblad, will on average also
result in a 0.05 article increase in De Telegraaf. Both effects seem thus to be rather weak.

The conditional variance
As written before, the ARIMA-model was highly volatile, meaning that the variance was not
stabile over time. This heteroscedasticity could not be reduced by adding more autoregressive
or moving average terms, but a GARCH model had to be used. Though this heteroscedasticity
was unpleasant in the attempt to predict the numbers of articles published by De Telegraaf
about sustainable development, it can also be used as interesting information. Consequently, I
would like to know whether the conditional variance was affected by developments in the
numbers of articles published by the other newspapers. Therefore, the squared residuals of the
AR(1)-I(0.352)-MA(1,2)-model were used as dependent variables.
        The time series of this variance-variable was stationary according to augmented
Dickey-Fuller tests. Following the same framework (Vliegenthart, n.d.) as was done above, a
ARIMA(1,0,1)-model was built that did neither reflected autocorrelation (Q = 28.90, p =
0.09), nor heteroscedasticity (Q = 1.29, p = 0.999) in the residuals of the predictions of the
variance of the fractionally integrated number of articles in De Telegraaf. The next step was
to insert the same independent variables as in the GARCH model, because the cross-
correlation function indicates that the residuals of this model correlate most strongly with the
fractionally integrated values of the other two dependent variables at a lag of one week. The
results of this model can be found in Table 3.
Table 3. ARIMA model for the variance of the fractionally integrated number of articles in De Telegraaf
                                       ARIMA (1,0,1)
Constant                                    3.740 (0.681)
Autoregressive (t - 1)                     -0.737 (0.857)
Moving average (t - 1)                      0.708 (0.944)
NRC Handelsblad (t - 1)                    0.502 (1.404)
Het Financieele Dagblad (t - 1)            1.413 (0.681)*

Ljung-Box Q(20) residuals                         28.79
Ljung-Box Q(20) residuals2                        1.97
AIC                                             7149.06
BIC                                             7175.23
Note. Unstandardized coefficients. Standard errors in parentheses;
* p < 0.05

News coverage about sustainable development in NRC Handelsblad does not influence the
variance of the fractionally integrated number of articles in De Telegraaf. Interestingly, this


                                                                                                          5
variance was significantly and positively affected by news coverage in Het Financieele
Dagblad. This means that when the fractionally integrated number of articles about
sustainable development in Het Financieele Dagblad increased, the variance in the number of
articles in De Telegraaf also increased and it thus became more difficult to predict this values
precisely. The results of the ARIMA-model make clear that the variance on a certain moment
is not strongly affected by previous variance, as both the AR and the MA-term are
insignificant.

Conclusion
This study has found that changes in the number of articles about sustainable development in
the scientifically oriented newspaper NRC Handelsblad and the business oriented newspaper
Het Financieele Dagblad, both lead to changes in the same direction in the number of articles
about this topic in the popular newspaper De Telegraaf. A GARCH-model was used to
analyse this data, as the dependent variable had a volatility that was high at certain moments.
       Because this heteroscedasticity was an interesting part of the dependent variable
another model was developed to predict volatility. The ARIMA-model that was built for this
purpose, found that variance could partly be predicted by the fractionally integrated number
of articles about sustainable development in Het Financieele Dagblad, but not by the coverage
of NRC Handelsblad.

Reference
Robinson, P. M. (1995). Log-periodogram regression of time series with long range
       dependence. Annals of Statistics, 23(3), 1048-1072.

Vliegenthart, R. (n.d.). Moving up. Applying aggregate level time series analysis in
       communication science. Unpublished manuscript.

Do File
tsset week, weekly

twoway (tsline FD, lcolor(red)) (tsline NRC, lcolor(green) lpattern(dash)
lwidth(medthick)) (tsline Telegraaf, lcolor(blue) lpattern(dash)
lwidth(medium))
twoway (tsline FD, lcolor(red))

*with drift
dfuller Telegraaf
*random walk
dfuller Telegraaf, noconstant
*trend
dfuller Telegraaf, trend

*with drift
dfuller FD
*random walk
dfuller FD, noconstant


                                                                                                  6
*trend
dfuller FD, trend

*with drift
dfuller NRC
*random walk
dfuller NRC, noconstant
*trend
dfuller NRC, trend

search ARFIMA
roblpr Telegraaf
gen dfTelegraaf=Telegraaf-.3520017*l.Telegraaf
gen dfNRC=NRC-.3520017*l.NRC
gen dfFD=FD-.3520017*l.FD

*with drift
dfuller dfTelegraaf
*random walk
dfuller dfTelegraaf, noconstant
*trend
dfuller dfTelegraaf, trend

*with drift
dfuller dfFD
*random walk
dfuller dfFD, noconstant
*trend
dfuller dfFD, trend

*with drift
dfuller dfNRC
*random walk
dfuller dfNRC, noconstant
*trend
dfuller dfNRC, trend

ac dfTelegraaf
pac dfTelegraaf
corrgram dfTelegraaf

*The ACF graph shows a clear spike a unclear pattern, while the PACF graph
displays a declining pattern for the first lags.
*A ARIMA (0,fi,1) model seems thus the right choice

arima dfTelegraaf, ma(1)
estat ic
predict r, res
gen r_s= r*r
wntestq r, lags(20)
wntestq r_s, lags(20)
ac r
pac r
drop r r_s
*Q(r) and Q(r2) significicant, a peak at lag 2

arima dfTelegraaf, ma(1 2)
estat ic
predict r, res
gen r_s= r*r
wntestq r, lags(20)


                                                                             7
wntestq r_s, lags(20)
ac r
pac r
drop r r_s

arima dfTelegraaf, ar(1) ma(1 2)
estat ic
predict r, res
gen r_s= r*r
wntestq r, lags(20)
wntestq r_s, lags(20)
ac r
pac r
drop r r_s
*Q(r) insignificant but Q(r2) significicant

arch dfTelegraaf, ar(1) ma(1 2)   arch(1)
estat ic

arch dfTelegraaf, ar(1) ma(1 2) arch(1) garch(1)
estat ic
di 3704.739 - 3599.802
di 3730.917 - 3630.344
predict r, res
gen r_s= r*r
wntestq r, lags(20)
wntestq r_s, lags(20)
ac r
pac r
drop r r_s
*Q(r) stays insignificant. Now the model is ok!

*now see how the residuals of this models are best predicted by which lags
for NRC and FD
arch dfTelegraaf, ar(1) ma(1 2) arch(1) garch(1)
estat ic
predict r, res

xcorr r dfNRC, lags(13)
xcorr r dfFD, lags(13)
*both strongly correlate at the first lag

drop r
arch dfTelegraaf l1.dfNRC l1.dfFD, ar(1) ma(1 2) arch(1) garch(1)
estat ic
predict r, res
gen r_s= r*r
wntestq r, lags(20)
wntestq r_s, lags(20)
drop r r_s
test l1.dfNRC
di 0.0912/2

*****Explaining conditional variance****
*final arima model
arima dfTelegraaf, ar(1) ma(1 2)
predict r, res
gen sArima=r*r
drop r

twoway (tsline sArima, lcolor(black))


                                                                             8
*with drift
dfuller sArima
*random walk
dfuller sArima, noconstant
*trend
dfuller sArima, trend

ac sArima
pac sArima
corrgram sArima

arima sArima
estat ic
predict r, res
gen r_s= r*r
wntestq r, lags(20)
wntestq r_s, lags(20)
ac r
pac r
drop r r_s

arima sArima, ar(1) ma(1)
estat ic
predict r, res
gen r_s= r*r
wntestq r, lags(20)
wntestq r_s, lags(20)
drop r r_s

arima sArima, ar(1) ma(1)
predict r, res
xcorr r dfNRC, lags(13)
xcorr r dfFD, lags(13)

arima sArima l1.dfNRC l1.dfFD, ar(1) ma(1)
estat ic
predict r, res
gen r_s= r*r
wntestq r, lags(20)
wntestq r_s, lags(20)
drop r r_s


                                             9

Contenu connexe

Similaire à Sustainable Development in Popular Newspapers: How is coverage in De Telegraaf influenced by other newspapers’ attention to sustainable development? - ARIMA modelling with (G)ARCH and Fractional Integration

Sustainable development in three newspapers: How does coverage in a particula...
Sustainable development in three newspapers: How does coverage in a particula...Sustainable development in three newspapers: How does coverage in a particula...
Sustainable development in three newspapers: How does coverage in a particula...Mark Boukes (University of Amsterdam)
 
Turn left or right: How the economy affects political preferences and media c...
Turn left or right: How the economy affects political preferences and media c...Turn left or right: How the economy affects political preferences and media c...
Turn left or right: How the economy affects political preferences and media c...Mark Boukes (University of Amsterdam)
 
FIRE ADMIN UNIT 1 .orct121320#ffffff#fa951a#FFFFFF#e7b3513VERSON.docx
FIRE ADMIN UNIT 1 .orct121320#ffffff#fa951a#FFFFFF#e7b3513VERSON.docxFIRE ADMIN UNIT 1 .orct121320#ffffff#fa951a#FFFFFF#e7b3513VERSON.docx
FIRE ADMIN UNIT 1 .orct121320#ffffff#fa951a#FFFFFF#e7b3513VERSON.docxAKHIL969626
 
Nonlinear Extension of Asymmetric Garch Model within Neural Network Framework
Nonlinear Extension of Asymmetric Garch Model within Neural Network Framework Nonlinear Extension of Asymmetric Garch Model within Neural Network Framework
Nonlinear Extension of Asymmetric Garch Model within Neural Network Framework csandit
 
NONLINEAR EXTENSION OF ASYMMETRIC GARCH MODEL WITHIN NEURAL NETWORK FRAMEWORK
NONLINEAR EXTENSION OF ASYMMETRIC GARCH MODEL WITHIN NEURAL NETWORK FRAMEWORKNONLINEAR EXTENSION OF ASYMMETRIC GARCH MODEL WITHIN NEURAL NETWORK FRAMEWORK
NONLINEAR EXTENSION OF ASYMMETRIC GARCH MODEL WITHIN NEURAL NETWORK FRAMEWORKcscpconf
 
cian mcdonnell- aluminium prices fyp
cian mcdonnell- aluminium prices fypcian mcdonnell- aluminium prices fyp
cian mcdonnell- aluminium prices fypCian McDonnell
 
An introductiontoappliedmultivariateanalysiswithr everit
An introductiontoappliedmultivariateanalysiswithr everitAn introductiontoappliedmultivariateanalysiswithr everit
An introductiontoappliedmultivariateanalysiswithr everitFredy Gomez Gutierrez
 
The Use of ARCH and GARCH Models for Estimating and Forecasting Volatility-ru...
The Use of ARCH and GARCH Models for Estimating and Forecasting Volatility-ru...The Use of ARCH and GARCH Models for Estimating and Forecasting Volatility-ru...
The Use of ARCH and GARCH Models for Estimating and Forecasting Volatility-ru...Ismet Kale
 
An intro to applied multi stat with r by everitt et al
An intro to applied multi stat with r by everitt et alAn intro to applied multi stat with r by everitt et al
An intro to applied multi stat with r by everitt et alRazzaqe
 
Master_thesis_David_Weiden_version_01_12_2012
Master_thesis_David_Weiden_version_01_12_2012Master_thesis_David_Weiden_version_01_12_2012
Master_thesis_David_Weiden_version_01_12_2012David van der Weiden
 
2010 07-11 - atrs 2010 - long term forecasting
2010 07-11 - atrs 2010 - long term forecasting2010 07-11 - atrs 2010 - long term forecasting
2010 07-11 - atrs 2010 - long term forecastingDanielSALLIER
 
Econometric Investigation into Cryptocurrency Price Bubbles in Bitcoin and Et...
Econometric Investigation into Cryptocurrency Price Bubbles in Bitcoin and Et...Econometric Investigation into Cryptocurrency Price Bubbles in Bitcoin and Et...
Econometric Investigation into Cryptocurrency Price Bubbles in Bitcoin and Et...Siddharth Hitkari
 
An Econometric Investigation into Cryptocurrency Price Bubbles in Bitcoin and...
An Econometric Investigation into Cryptocurrency Price Bubbles in Bitcoin and...An Econometric Investigation into Cryptocurrency Price Bubbles in Bitcoin and...
An Econometric Investigation into Cryptocurrency Price Bubbles in Bitcoin and...Shane Jose
 
Do we measure functional size or do we count thomas fehlmann
Do we measure functional size or do we count   thomas fehlmannDo we measure functional size or do we count   thomas fehlmann
Do we measure functional size or do we count thomas fehlmannIWSM Mensura
 
Analyzing The Term Structure Of Interest Rates Using The Dynamic Nelson Siege...
Analyzing The Term Structure Of Interest Rates Using The Dynamic Nelson Siege...Analyzing The Term Structure Of Interest Rates Using The Dynamic Nelson Siege...
Analyzing The Term Structure Of Interest Rates Using The Dynamic Nelson Siege...Dawn Cook
 

Similaire à Sustainable Development in Popular Newspapers: How is coverage in De Telegraaf influenced by other newspapers’ attention to sustainable development? - ARIMA modelling with (G)ARCH and Fractional Integration (20)

Sustainable development in three newspapers: How does coverage in a particula...
Sustainable development in three newspapers: How does coverage in a particula...Sustainable development in three newspapers: How does coverage in a particula...
Sustainable development in three newspapers: How does coverage in a particula...
 
Turn left or right: How the economy affects political preferences and media c...
Turn left or right: How the economy affects political preferences and media c...Turn left or right: How the economy affects political preferences and media c...
Turn left or right: How the economy affects political preferences and media c...
 
FIRE ADMIN UNIT 1 .orct121320#ffffff#fa951a#FFFFFF#e7b3513VERSON.docx
FIRE ADMIN UNIT 1 .orct121320#ffffff#fa951a#FFFFFF#e7b3513VERSON.docxFIRE ADMIN UNIT 1 .orct121320#ffffff#fa951a#FFFFFF#e7b3513VERSON.docx
FIRE ADMIN UNIT 1 .orct121320#ffffff#fa951a#FFFFFF#e7b3513VERSON.docx
 
Nonlinear Extension of Asymmetric Garch Model within Neural Network Framework
Nonlinear Extension of Asymmetric Garch Model within Neural Network Framework Nonlinear Extension of Asymmetric Garch Model within Neural Network Framework
Nonlinear Extension of Asymmetric Garch Model within Neural Network Framework
 
NONLINEAR EXTENSION OF ASYMMETRIC GARCH MODEL WITHIN NEURAL NETWORK FRAMEWORK
NONLINEAR EXTENSION OF ASYMMETRIC GARCH MODEL WITHIN NEURAL NETWORK FRAMEWORKNONLINEAR EXTENSION OF ASYMMETRIC GARCH MODEL WITHIN NEURAL NETWORK FRAMEWORK
NONLINEAR EXTENSION OF ASYMMETRIC GARCH MODEL WITHIN NEURAL NETWORK FRAMEWORK
 
Modeling the Volatility and Forecasting the Stock Price of the German Stock I...
Modeling the Volatility and Forecasting the Stock Price of the German Stock I...Modeling the Volatility and Forecasting the Stock Price of the German Stock I...
Modeling the Volatility and Forecasting the Stock Price of the German Stock I...
 
cian mcdonnell- aluminium prices fyp
cian mcdonnell- aluminium prices fypcian mcdonnell- aluminium prices fyp
cian mcdonnell- aluminium prices fyp
 
An introductiontoappliedmultivariateanalysiswithr everit
An introductiontoappliedmultivariateanalysiswithr everitAn introductiontoappliedmultivariateanalysiswithr everit
An introductiontoappliedmultivariateanalysiswithr everit
 
The Use of ARCH and GARCH Models for Estimating and Forecasting Volatility-ru...
The Use of ARCH and GARCH Models for Estimating and Forecasting Volatility-ru...The Use of ARCH and GARCH Models for Estimating and Forecasting Volatility-ru...
The Use of ARCH and GARCH Models for Estimating and Forecasting Volatility-ru...
 
An intro to applied multi stat with r by everitt et al
An intro to applied multi stat with r by everitt et alAn intro to applied multi stat with r by everitt et al
An intro to applied multi stat with r by everitt et al
 
Master_thesis_David_Weiden_version_01_12_2012
Master_thesis_David_Weiden_version_01_12_2012Master_thesis_David_Weiden_version_01_12_2012
Master_thesis_David_Weiden_version_01_12_2012
 
2010 07-11 - atrs 2010 - long term forecasting
2010 07-11 - atrs 2010 - long term forecasting2010 07-11 - atrs 2010 - long term forecasting
2010 07-11 - atrs 2010 - long term forecasting
 
Econometric Investigation into Cryptocurrency Price Bubbles in Bitcoin and Et...
Econometric Investigation into Cryptocurrency Price Bubbles in Bitcoin and Et...Econometric Investigation into Cryptocurrency Price Bubbles in Bitcoin and Et...
Econometric Investigation into Cryptocurrency Price Bubbles in Bitcoin and Et...
 
An Econometric Investigation into Cryptocurrency Price Bubbles in Bitcoin and...
An Econometric Investigation into Cryptocurrency Price Bubbles in Bitcoin and...An Econometric Investigation into Cryptocurrency Price Bubbles in Bitcoin and...
An Econometric Investigation into Cryptocurrency Price Bubbles in Bitcoin and...
 
Hmtc1300663
Hmtc1300663Hmtc1300663
Hmtc1300663
 
Why emh is flawed and intro to fmh
Why emh is flawed and intro to fmhWhy emh is flawed and intro to fmh
Why emh is flawed and intro to fmh
 
Mt 75 maelzer revise
Mt 75 maelzer reviseMt 75 maelzer revise
Mt 75 maelzer revise
 
Do we measure functional size or do we count thomas fehlmann
Do we measure functional size or do we count   thomas fehlmannDo we measure functional size or do we count   thomas fehlmann
Do we measure functional size or do we count thomas fehlmann
 
Analyzing The Term Structure Of Interest Rates Using The Dynamic Nelson Siege...
Analyzing The Term Structure Of Interest Rates Using The Dynamic Nelson Siege...Analyzing The Term Structure Of Interest Rates Using The Dynamic Nelson Siege...
Analyzing The Term Structure Of Interest Rates Using The Dynamic Nelson Siege...
 
73
7373
73
 

Plus de Mark Boukes (University of Amsterdam)

Cartoon controversy; why the Danish Mohammed cartoons could be published.
Cartoon controversy; why the Danish Mohammed cartoons could be published. Cartoon controversy; why the Danish Mohammed cartoons could be published.
Cartoon controversy; why the Danish Mohammed cartoons could be published. Mark Boukes (University of Amsterdam)
 
Who Sets the Agenda: Media or Parliament?: A panel data study to the agenda s...
Who Sets the Agenda: Media or Parliament?: A panel data study to the agenda s...Who Sets the Agenda: Media or Parliament?: A panel data study to the agenda s...
Who Sets the Agenda: Media or Parliament?: A panel data study to the agenda s...Mark Boukes (University of Amsterdam)
 
Turn left or right: Are political preferences in the Netherlands changed by m...
Turn left or right: Are political preferences in the Netherlands changed by m...Turn left or right: Are political preferences in the Netherlands changed by m...
Turn left or right: Are political preferences in the Netherlands changed by m...Mark Boukes (University of Amsterdam)
 
Media, intention and final vote: A two-wave panel data study to the effects o...
Media, intention and final vote: A two-wave panel data study to the effects o...Media, intention and final vote: A two-wave panel data study to the effects o...
Media, intention and final vote: A two-wave panel data study to the effects o...Mark Boukes (University of Amsterdam)
 
Public broadcasting; what should it add, what should be its role and what are...
Public broadcasting; what should it add, what should be its role and what are...Public broadcasting; what should it add, what should be its role and what are...
Public broadcasting; what should it add, what should be its role and what are...Mark Boukes (University of Amsterdam)
 
Journalism and the media: the cartoon controversy: Why were they published?
Journalism and the media: the cartoon controversy: Why were they published?Journalism and the media: the cartoon controversy: Why were they published?
Journalism and the media: the cartoon controversy: Why were they published?Mark Boukes (University of Amsterdam)
 
Explaining political coverage in the Netherlands; Why Dutch voters are less c...
Explaining political coverage in the Netherlands; Why Dutch voters are less c...Explaining political coverage in the Netherlands; Why Dutch voters are less c...
Explaining political coverage in the Netherlands; Why Dutch voters are less c...Mark Boukes (University of Amsterdam)
 
Reducing prejudice via mediated contact with immigrants - Proposal for an exp...
Reducing prejudice via mediated contact with immigrants - Proposal for an exp...Reducing prejudice via mediated contact with immigrants - Proposal for an exp...
Reducing prejudice via mediated contact with immigrants - Proposal for an exp...Mark Boukes (University of Amsterdam)
 
Invloed van pacing bij effecten van thematische congruentie op attitude en he...
Invloed van pacing bij effecten van thematische congruentie op attitude en he...Invloed van pacing bij effecten van thematische congruentie op attitude en he...
Invloed van pacing bij effecten van thematische congruentie op attitude en he...Mark Boukes (University of Amsterdam)
 

Plus de Mark Boukes (University of Amsterdam) (19)

Etmaal 2014 presentation: on the effects of opinionated news
Etmaal 2014 presentation: on the effects of opinionated newsEtmaal 2014 presentation: on the effects of opinionated news
Etmaal 2014 presentation: on the effects of opinionated news
 
Cartoon controversy; why the Danish Mohammed cartoons could be published.
Cartoon controversy; why the Danish Mohammed cartoons could be published. Cartoon controversy; why the Danish Mohammed cartoons could be published.
Cartoon controversy; why the Danish Mohammed cartoons could be published.
 
Who Sets the Agenda: Media or Parliament?: A panel data study to the agenda s...
Who Sets the Agenda: Media or Parliament?: A panel data study to the agenda s...Who Sets the Agenda: Media or Parliament?: A panel data study to the agenda s...
Who Sets the Agenda: Media or Parliament?: A panel data study to the agenda s...
 
Turn left or right: Are political preferences in the Netherlands changed by m...
Turn left or right: Are political preferences in the Netherlands changed by m...Turn left or right: Are political preferences in the Netherlands changed by m...
Turn left or right: Are political preferences in the Netherlands changed by m...
 
Media, intention and final vote: A two-wave panel data study to the effects o...
Media, intention and final vote: A two-wave panel data study to the effects o...Media, intention and final vote: A two-wave panel data study to the effects o...
Media, intention and final vote: A two-wave panel data study to the effects o...
 
Public broadcasting; what should it add, what should be its role and what are...
Public broadcasting; what should it add, what should be its role and what are...Public broadcasting; what should it add, what should be its role and what are...
Public broadcasting; what should it add, what should be its role and what are...
 
Journalism and the media: the cartoon controversy: Why were they published?
Journalism and the media: the cartoon controversy: Why were they published?Journalism and the media: the cartoon controversy: Why were they published?
Journalism and the media: the cartoon controversy: Why were they published?
 
Climate change; explaining the differences in reporting
Climate change; explaining the differences in reportingClimate change; explaining the differences in reporting
Climate change; explaining the differences in reporting
 
Explaining political coverage in the Netherlands; Why Dutch voters are less c...
Explaining political coverage in the Netherlands; Why Dutch voters are less c...Explaining political coverage in the Netherlands; Why Dutch voters are less c...
Explaining political coverage in the Netherlands; Why Dutch voters are less c...
 
Journalisten, politici en agendasetting
Journalisten, politici en agendasettingJournalisten, politici en agendasetting
Journalisten, politici en agendasetting
 
Reducing prejudice via mediated contact with immigrants - Proposal for an exp...
Reducing prejudice via mediated contact with immigrants - Proposal for an exp...Reducing prejudice via mediated contact with immigrants - Proposal for an exp...
Reducing prejudice via mediated contact with immigrants - Proposal for an exp...
 
Thematische congruentie en de invloed van advertenties
Thematische congruentie en de invloed van advertentiesThematische congruentie en de invloed van advertenties
Thematische congruentie en de invloed van advertenties
 
Structural equation modelling
Structural equation modellingStructural equation modelling
Structural equation modelling
 
Influence of media source on political interest;
Influence of media source on political interest;Influence of media source on political interest;
Influence of media source on political interest;
 
Interviewing ethnic minorities
Interviewing ethnic minoritiesInterviewing ethnic minorities
Interviewing ethnic minorities
 
Causality
CausalityCausality
Causality
 
Onbewust asocialer
Onbewust asocialerOnbewust asocialer
Onbewust asocialer
 
The emotion-sexual attraction link
The emotion-sexual attraction linkThe emotion-sexual attraction link
The emotion-sexual attraction link
 
Invloed van pacing bij effecten van thematische congruentie op attitude en he...
Invloed van pacing bij effecten van thematische congruentie op attitude en he...Invloed van pacing bij effecten van thematische congruentie op attitude en he...
Invloed van pacing bij effecten van thematische congruentie op attitude en he...
 

Dernier

Foreign Relation of Pakistan with Neighboring Countries.pptx
Foreign Relation of Pakistan with Neighboring Countries.pptxForeign Relation of Pakistan with Neighboring Countries.pptx
Foreign Relation of Pakistan with Neighboring Countries.pptxunark75
 
13042024_First India Newspaper Jaipur.pdf
13042024_First India Newspaper Jaipur.pdf13042024_First India Newspaper Jaipur.pdf
13042024_First India Newspaper Jaipur.pdfFIRST INDIA
 
14042024_First India Newspaper Jaipur.pdf
14042024_First India Newspaper Jaipur.pdf14042024_First India Newspaper Jaipur.pdf
14042024_First India Newspaper Jaipur.pdfFIRST INDIA
 
Political-Ideologies-and-The-Movements.pptx
Political-Ideologies-and-The-Movements.pptxPolitical-Ideologies-and-The-Movements.pptx
Political-Ideologies-and-The-Movements.pptxSasikiranMarri
 
Power in International Relations (Pol 5)
Power in International Relations (Pol 5)Power in International Relations (Pol 5)
Power in International Relations (Pol 5)ssuser583c35
 
11042024_First India Newspaper Jaipur.pdf
11042024_First India Newspaper Jaipur.pdf11042024_First India Newspaper Jaipur.pdf
11042024_First India Newspaper Jaipur.pdfFIRST INDIA
 
Transforming Andhra Pradesh: TDP's Legacy in Road Connectivity
Transforming Andhra Pradesh: TDP's Legacy in Road ConnectivityTransforming Andhra Pradesh: TDP's Legacy in Road Connectivity
Transforming Andhra Pradesh: TDP's Legacy in Road Connectivitynarsireddynannuri1
 
Mitochondrial Fusion Vital for Adult Brain Function and Disease Understanding...
Mitochondrial Fusion Vital for Adult Brain Function and Disease Understanding...Mitochondrial Fusion Vital for Adult Brain Function and Disease Understanding...
Mitochondrial Fusion Vital for Adult Brain Function and Disease Understanding...The Lifesciences Magazine
 
Emerging issues in migration policies.ppt
Emerging issues in migration policies.pptEmerging issues in migration policies.ppt
Emerging issues in migration policies.pptNandinituteja1
 
Geostrategic significance of South Asian countries.ppt
Geostrategic significance of South Asian countries.pptGeostrategic significance of South Asian countries.ppt
Geostrategic significance of South Asian countries.pptUsmanKaran
 
16042024_First India Newspaper Jaipur.pdf
16042024_First India Newspaper Jaipur.pdf16042024_First India Newspaper Jaipur.pdf
16042024_First India Newspaper Jaipur.pdfFIRST INDIA
 
lok sabha Elections in india- 2024 .pptx
lok sabha Elections in india- 2024 .pptxlok sabha Elections in india- 2024 .pptx
lok sabha Elections in india- 2024 .pptxdigiyvbmrkt
 
15042024_First India Newspaper Jaipur.pdf
15042024_First India Newspaper Jaipur.pdf15042024_First India Newspaper Jaipur.pdf
15042024_First India Newspaper Jaipur.pdfFIRST INDIA
 
12042024_First India Newspaper Jaipur.pdf
12042024_First India Newspaper Jaipur.pdf12042024_First India Newspaper Jaipur.pdf
12042024_First India Newspaper Jaipur.pdfFIRST INDIA
 

Dernier (14)

Foreign Relation of Pakistan with Neighboring Countries.pptx
Foreign Relation of Pakistan with Neighboring Countries.pptxForeign Relation of Pakistan with Neighboring Countries.pptx
Foreign Relation of Pakistan with Neighboring Countries.pptx
 
13042024_First India Newspaper Jaipur.pdf
13042024_First India Newspaper Jaipur.pdf13042024_First India Newspaper Jaipur.pdf
13042024_First India Newspaper Jaipur.pdf
 
14042024_First India Newspaper Jaipur.pdf
14042024_First India Newspaper Jaipur.pdf14042024_First India Newspaper Jaipur.pdf
14042024_First India Newspaper Jaipur.pdf
 
Political-Ideologies-and-The-Movements.pptx
Political-Ideologies-and-The-Movements.pptxPolitical-Ideologies-and-The-Movements.pptx
Political-Ideologies-and-The-Movements.pptx
 
Power in International Relations (Pol 5)
Power in International Relations (Pol 5)Power in International Relations (Pol 5)
Power in International Relations (Pol 5)
 
11042024_First India Newspaper Jaipur.pdf
11042024_First India Newspaper Jaipur.pdf11042024_First India Newspaper Jaipur.pdf
11042024_First India Newspaper Jaipur.pdf
 
Transforming Andhra Pradesh: TDP's Legacy in Road Connectivity
Transforming Andhra Pradesh: TDP's Legacy in Road ConnectivityTransforming Andhra Pradesh: TDP's Legacy in Road Connectivity
Transforming Andhra Pradesh: TDP's Legacy in Road Connectivity
 
Mitochondrial Fusion Vital for Adult Brain Function and Disease Understanding...
Mitochondrial Fusion Vital for Adult Brain Function and Disease Understanding...Mitochondrial Fusion Vital for Adult Brain Function and Disease Understanding...
Mitochondrial Fusion Vital for Adult Brain Function and Disease Understanding...
 
Emerging issues in migration policies.ppt
Emerging issues in migration policies.pptEmerging issues in migration policies.ppt
Emerging issues in migration policies.ppt
 
Geostrategic significance of South Asian countries.ppt
Geostrategic significance of South Asian countries.pptGeostrategic significance of South Asian countries.ppt
Geostrategic significance of South Asian countries.ppt
 
16042024_First India Newspaper Jaipur.pdf
16042024_First India Newspaper Jaipur.pdf16042024_First India Newspaper Jaipur.pdf
16042024_First India Newspaper Jaipur.pdf
 
lok sabha Elections in india- 2024 .pptx
lok sabha Elections in india- 2024 .pptxlok sabha Elections in india- 2024 .pptx
lok sabha Elections in india- 2024 .pptx
 
15042024_First India Newspaper Jaipur.pdf
15042024_First India Newspaper Jaipur.pdf15042024_First India Newspaper Jaipur.pdf
15042024_First India Newspaper Jaipur.pdf
 
12042024_First India Newspaper Jaipur.pdf
12042024_First India Newspaper Jaipur.pdf12042024_First India Newspaper Jaipur.pdf
12042024_First India Newspaper Jaipur.pdf
 

Sustainable Development in Popular Newspapers: How is coverage in De Telegraaf influenced by other newspapers’ attention to sustainable development? - ARIMA modelling with (G)ARCH and Fractional Integration

  • 1. Sustainable Development in Popular Newspapers How is coverage in De Telegraaf influenced by other newspapers’ attention to sustainable development? ARIMA modelling with (G)ARCH and Fractional Integration Assignment 6 Mark Boukes (markboukes@Hotmail.com) 5616298 1st semester 2010/2011 Dynamic Data Analysis Lecturer: Dr. R. Vliegenthart December 23, 2010 Communication Science (Research MSc) Faculty of Social and Behavioural Sciences University of Amsterdam
  • 2.
  • 3. Table of contents INTRODUCTION.............................................................................................................................................1 METHOD........................................................................................................................................................1 RESULTS........................................................................................................................................................2 ARIMA MODEL.......................................................................................................................................................2 THE CONDITIONAL VARIANCE..........................................................................................................................................5 CONCLUSION.................................................................................................................................................6 REFERENCE....................................................................................................................................................6 DO FILE..........................................................................................................................................................6
  • 4.
  • 5. Introduction In this study I aim to investigate the influence news coverage in a particular newspaper has on the coverage of another newspaper. For this purpose, I have chosen a specific topic, sustainable development, that seems to get a lot media attention in the last years. The topic of sustainable development was chosen, because it can be related to several parts of society, such as the economy, science and also for the man in the street this topic is relevant. As those different parts of society are represented by different media, it is interesting to see how they influence each other on the amount of attention that is paid to this issue. Will an increase in attention of business men’s newspapers result in an increase of attention in newspapers that deal with popular issues; and how is this newspaper affected by a newspaper that is more focused on scientific issues? In brief, How is the attention in a popular newspaper caused by attention in scientific and economic newspapers. The most read popular newspaper in the Netherlands is De Telegraaf, a newspaper that has a main financial or business focus is Het Financieele Dagblad, and NRC Handelsblad is known for its relative large attention to scientific developments. The effects of both Het Financieele Dagblad and NRC Handelsblad are expected to be positive on the coverage of De Telegraaf. My hypothesis is therefore: An increase in the number of articles about sustainable development in Het Financieele Dagblad or in NRC Handelsblad is likely to be followed by a increase in the number of articles this topic in coverage of de Telegraaf in future weeks. Method In order to investigate whether changes in the number of articles about sustainable development in NRC Handelsblad and Het Financieele Dagblad have an effect on De Telegraafs’s news, a dataset was created via a computer-assisted content analysis, which was conducted using the digital archive of the Web-based version of LexisNexis. Articles were selected via the Boolean search term duurza! OR "groene energie" OR "zonne-energie" OR "windenergie". The period I analyzed was from 1 January 1999 until 31 December 2009. This period was chosen, because information about De Telegraaf is only available from 1999. The search procedure was repeated three times; one time for every newspaper, so three variables could be created by aggregating the data on a weekly basis. A weekly basis is chosen, because it is more detailed than the monthly basis, whereas a daily basis would lead to many days on which no coverage was found, what consequently meant that a lot cases had to be filled in by hand. A total of 35225 articles were found for 581 weeks; 18501 in Het Financieele Dagblad, 10335 in NRC Handelsblad and 6389 in De Telegraaf. 1
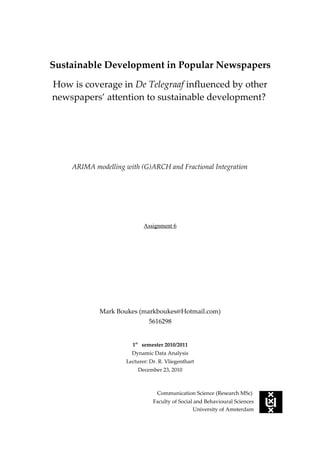
  • 6. To analyse the effects on the coverage of De Telegraaf, first an adequate ARIMA model is developed using Stata 10.1 for the time series of this variable, this was followed by adding a GARCH term to model the volatility, thereafter the independent variables were added to the model, resulting in a multivariate ARIMA model. Results In this results section, I specify how the analysis was conducted and discuss the results that were found. I followed the ARIMA-framework described by Vliegenthart (n.d.) to make the base ARIMA-model, thereafter GARCH-terms were added to take heteroscedasticity into account and finally the independent variables were added to the model. ARIMA model Figure 1 plots the time series of the attention in the three newspapers for the period that we are studying. It seems that Het Financieele Dagblad pays the most attention to sustainable development and De Telegraaf the least attention. The amount of attention seems to be rising a little over time, but this is not confirmed by augmented Dickey-Fuller tests (see Table 1); hypotheses for unit root are rejected. However the results were close to insignificant and the graphs also show that there is some upward trend. Therefore, the data were fractionally integrated at a level of 0.352 following the Robinson (1995) multivariate estimate of the long memory (fractional integration) parameters for the number of articles in De Telegraaf. Figure 1. The number of articles about sustainable development over time in the three newspapers of interest. 2
  • 7. Table 1. The results of augmented Dickey-Fuller tests for the amount of articles over time Augmented Dickey-Fuller test Telegraaf FD NRC Random walk without drift -6.560 -4.990 -5.596 Random walk with drift -10.878 -10.104 -14.525 Random walk with drift and trend -16.487 -15.716 -16.751 FI.Telegraaf FI.FD FI.NRC Random walk without drift -11.756 -8.938 -10.011 Random walk with drift -18.478 -17.020 -22.947 Random walk with drift and trend -25.563 -24.102 -25.383 Note. All tests indicate the absence of a unit root. FI, fractionally integrated The next step was predicting the number of articles about sustainable development as good as possible by accounting for its own past, either with autoregressive (AR) terms, moving average (MA) terms or both. This was done by inspecting the autocorrelation (ACF) and partial autocorrelation functions (PACF). The ACF graph showed an unclear pattern, while the PACF graph displays a declining pattern for the first lags. This pattern is indicative for a process with a moving average at lag 1. A ARIMA (0,0.352,1) model seems thus the right choice. This model was tested for autocorrelation with the Ljung–Box Q test statistic and for the presence of conditional heteroscedasticity with the Engle-Granger test. A significant result for the Ljung-Box Q-test for autocorrelation (20 lags) was found, meaning that the null hypothesis of white noise was rejected and that the absence of autocorrelation cannot be assumed (Q = 807.40, p < 0.001). Therefore, to avoid autocorrelation in the ARIMA-model, it was extended with an autoregressive term at lag 1 and a moving average term at lag 2; following the ACF and PACF graphs for every extension until the residuals of the AR(1)- I(0.352)-MA(1,2)-model did reflect no autocorrelation (Q = 24.89, p = 0.206). However, it seems not possible to reduce the Ljung-Box test statistic Q2 based on the squared residuals to insignificance, with AR or MA terms only. This means that there is a strong temporal dependency in the variance of the number of Telegraaf articles about sustainable development; heteroscedasticity. Residuals of the last ARIMA model were saved and are later analysed to see how the conditional variance of the number of articles in De Telegraaf was affected by changes in the number of articles in the other two newspapers. To avoid the heteroscedasticity in the model, it was necessary to model also the conditional variance of the dependent variable, either with autoregressive conditional heteroscedasticity (ARCH) terms or with a combination of ARCH and generalized autoregressive conditional heteroscedasticity (GARCH) terms. This last option was chosen, because it has considerable better model fit according to Akaike Info Criterion (AIC) and the 3
  • 8. Bayesian information criterion (BIC) (ΔAIC = 104.94, ΔBIC = 100.573). The results of this general model are showed in Table 2. The ARCH and GARCH terms are both statistically significant and positive. This indicates that that innovations in the prior period increase conditional variance in a next period. Periods of high volatility are thus likely to be grouped together in time. The autoregressive and moving average terms are also significant, meaning that a particular number of articles in some week in De Telegraaf, are partly determined by the number of articles in this newpaper the week before and two weeks before. Table 2. GARCH models: number of Telegraaf articles about sustainable development General GARCH model GARCH with independent variables Constant 2.502 (0.634)* 1.637 (0.638)* Autoregressive (t - 1) 1.007 (0.001)* 1.007 (0.001)* Moving average (t - 1) -1.125 (0.045)* -1.154 (0.046)* Moving average (t - 2) 0.128 (0.045)* 0.156 (0.046)* ARCH term 0.050 (0.013)* 0.047 (0.012)* GARCH term 0.958 (0.010)* 0.961 (0.010)* NRC Handelsblad (t - 1) 0.052 (0.030)a Het Financieele Dagblad (t - 1) 0.047 (0.023)* Ljung-Box Q(20) residuals 25.92 25.91 AIC 3599.80 3590.38 BIC 3630.34 3629.63 Note. Unstandardized coefficients. Standard errors in parentheses; * p < 0.05 , a = 0.091 Now a model was built that properly accounts for its own past and heteroscedasticity, the analysis could go on with the next step: assessing the impact of the amount of news coverage about sustainable development in NRC Handelsblad and Het Financieele Dagblad on that of the coverage in De Telegraaf. The cross-correlation function (CCF) for the residuals of this GARCH model and for the amount of coverage in NRC, and the CCF for the residuals with the coverage in Het Financieele Dagblad, indicate both that strong association is present when coverage in both newspapers is lagged at 1 week. The results of the GARCH model that included these two independent variables can also be found in Table 2. The results indicate that news coverage about sustainable development in Het Financieele Dagblad (FD) had a significant positive effect on coverage about this issue in De Telegraaf. A one article increase in FD, did on average result in a 0.05 article increase in the next week’s coverage of De Telegraaf. The effect of NRC Handelsblad is not significant, following a two-tailed test with 95% confidence interval. However, because this effect is expected to be positive, a one-tailed test can be used. Then the effect of NRC Handelsblad’s 4
  • 9. coverage about sustainable development also becomes significant (χ2 = 2.85, p = 0.0456). A one article increase about sustainable development in NRC Handelsblad, will on average also result in a 0.05 article increase in De Telegraaf. Both effects seem thus to be rather weak. The conditional variance As written before, the ARIMA-model was highly volatile, meaning that the variance was not stabile over time. This heteroscedasticity could not be reduced by adding more autoregressive or moving average terms, but a GARCH model had to be used. Though this heteroscedasticity was unpleasant in the attempt to predict the numbers of articles published by De Telegraaf about sustainable development, it can also be used as interesting information. Consequently, I would like to know whether the conditional variance was affected by developments in the numbers of articles published by the other newspapers. Therefore, the squared residuals of the AR(1)-I(0.352)-MA(1,2)-model were used as dependent variables. The time series of this variance-variable was stationary according to augmented Dickey-Fuller tests. Following the same framework (Vliegenthart, n.d.) as was done above, a ARIMA(1,0,1)-model was built that did neither reflected autocorrelation (Q = 28.90, p = 0.09), nor heteroscedasticity (Q = 1.29, p = 0.999) in the residuals of the predictions of the variance of the fractionally integrated number of articles in De Telegraaf. The next step was to insert the same independent variables as in the GARCH model, because the cross- correlation function indicates that the residuals of this model correlate most strongly with the fractionally integrated values of the other two dependent variables at a lag of one week. The results of this model can be found in Table 3. Table 3. ARIMA model for the variance of the fractionally integrated number of articles in De Telegraaf ARIMA (1,0,1) Constant 3.740 (0.681) Autoregressive (t - 1) -0.737 (0.857) Moving average (t - 1) 0.708 (0.944) NRC Handelsblad (t - 1) 0.502 (1.404) Het Financieele Dagblad (t - 1) 1.413 (0.681)* Ljung-Box Q(20) residuals 28.79 Ljung-Box Q(20) residuals2 1.97 AIC 7149.06 BIC 7175.23 Note. Unstandardized coefficients. Standard errors in parentheses; * p < 0.05 News coverage about sustainable development in NRC Handelsblad does not influence the variance of the fractionally integrated number of articles in De Telegraaf. Interestingly, this 5
  • 10. variance was significantly and positively affected by news coverage in Het Financieele Dagblad. This means that when the fractionally integrated number of articles about sustainable development in Het Financieele Dagblad increased, the variance in the number of articles in De Telegraaf also increased and it thus became more difficult to predict this values precisely. The results of the ARIMA-model make clear that the variance on a certain moment is not strongly affected by previous variance, as both the AR and the MA-term are insignificant. Conclusion This study has found that changes in the number of articles about sustainable development in the scientifically oriented newspaper NRC Handelsblad and the business oriented newspaper Het Financieele Dagblad, both lead to changes in the same direction in the number of articles about this topic in the popular newspaper De Telegraaf. A GARCH-model was used to analyse this data, as the dependent variable had a volatility that was high at certain moments. Because this heteroscedasticity was an interesting part of the dependent variable another model was developed to predict volatility. The ARIMA-model that was built for this purpose, found that variance could partly be predicted by the fractionally integrated number of articles about sustainable development in Het Financieele Dagblad, but not by the coverage of NRC Handelsblad. Reference Robinson, P. M. (1995). Log-periodogram regression of time series with long range dependence. Annals of Statistics, 23(3), 1048-1072. Vliegenthart, R. (n.d.). Moving up. Applying aggregate level time series analysis in communication science. Unpublished manuscript. Do File tsset week, weekly twoway (tsline FD, lcolor(red)) (tsline NRC, lcolor(green) lpattern(dash) lwidth(medthick)) (tsline Telegraaf, lcolor(blue) lpattern(dash) lwidth(medium)) twoway (tsline FD, lcolor(red)) *with drift dfuller Telegraaf *random walk dfuller Telegraaf, noconstant *trend dfuller Telegraaf, trend *with drift dfuller FD *random walk dfuller FD, noconstant 6
  • 11. *trend dfuller FD, trend *with drift dfuller NRC *random walk dfuller NRC, noconstant *trend dfuller NRC, trend search ARFIMA roblpr Telegraaf gen dfTelegraaf=Telegraaf-.3520017*l.Telegraaf gen dfNRC=NRC-.3520017*l.NRC gen dfFD=FD-.3520017*l.FD *with drift dfuller dfTelegraaf *random walk dfuller dfTelegraaf, noconstant *trend dfuller dfTelegraaf, trend *with drift dfuller dfFD *random walk dfuller dfFD, noconstant *trend dfuller dfFD, trend *with drift dfuller dfNRC *random walk dfuller dfNRC, noconstant *trend dfuller dfNRC, trend ac dfTelegraaf pac dfTelegraaf corrgram dfTelegraaf *The ACF graph shows a clear spike a unclear pattern, while the PACF graph displays a declining pattern for the first lags. *A ARIMA (0,fi,1) model seems thus the right choice arima dfTelegraaf, ma(1) estat ic predict r, res gen r_s= r*r wntestq r, lags(20) wntestq r_s, lags(20) ac r pac r drop r r_s *Q(r) and Q(r2) significicant, a peak at lag 2 arima dfTelegraaf, ma(1 2) estat ic predict r, res gen r_s= r*r wntestq r, lags(20) 7
  • 12. wntestq r_s, lags(20) ac r pac r drop r r_s arima dfTelegraaf, ar(1) ma(1 2) estat ic predict r, res gen r_s= r*r wntestq r, lags(20) wntestq r_s, lags(20) ac r pac r drop r r_s *Q(r) insignificant but Q(r2) significicant arch dfTelegraaf, ar(1) ma(1 2) arch(1) estat ic arch dfTelegraaf, ar(1) ma(1 2) arch(1) garch(1) estat ic di 3704.739 - 3599.802 di 3730.917 - 3630.344 predict r, res gen r_s= r*r wntestq r, lags(20) wntestq r_s, lags(20) ac r pac r drop r r_s *Q(r) stays insignificant. Now the model is ok! *now see how the residuals of this models are best predicted by which lags for NRC and FD arch dfTelegraaf, ar(1) ma(1 2) arch(1) garch(1) estat ic predict r, res xcorr r dfNRC, lags(13) xcorr r dfFD, lags(13) *both strongly correlate at the first lag drop r arch dfTelegraaf l1.dfNRC l1.dfFD, ar(1) ma(1 2) arch(1) garch(1) estat ic predict r, res gen r_s= r*r wntestq r, lags(20) wntestq r_s, lags(20) drop r r_s test l1.dfNRC di 0.0912/2 *****Explaining conditional variance**** *final arima model arima dfTelegraaf, ar(1) ma(1 2) predict r, res gen sArima=r*r drop r twoway (tsline sArima, lcolor(black)) 8
  • 13. *with drift dfuller sArima *random walk dfuller sArima, noconstant *trend dfuller sArima, trend ac sArima pac sArima corrgram sArima arima sArima estat ic predict r, res gen r_s= r*r wntestq r, lags(20) wntestq r_s, lags(20) ac r pac r drop r r_s arima sArima, ar(1) ma(1) estat ic predict r, res gen r_s= r*r wntestq r, lags(20) wntestq r_s, lags(20) drop r r_s arima sArima, ar(1) ma(1) predict r, res xcorr r dfNRC, lags(13) xcorr r dfFD, lags(13) arima sArima l1.dfNRC l1.dfFD, ar(1) ma(1) estat ic predict r, res gen r_s= r*r wntestq r, lags(20) wntestq r_s, lags(20) drop r r_s 9