Mercer Capital's Business Development Companies Quarterly Newsletter | Q1 2014
•
0 j'aime•243 vues

Business development companies are an important and growing source of funding for middle market companies. Along with private equity and other investment funds, BDCs provide billions of dollars of investment capital to private companies in every segment of the economy. For over thirty years, Mercer Capital has met the valuation needs of the same middle market companies to which BDCs and other funds provide capital. This quarterly newsletter tracks the financial and stock market performance of the public BDCs.

Recommandé
Recommandé
Contenu connexe
Plus de Mercer Capital
Plus de Mercer Capital (20)
Dernier
Dernier (20)
Mercer Capital's Business Development Companies Quarterly Newsletter | Q1 2014
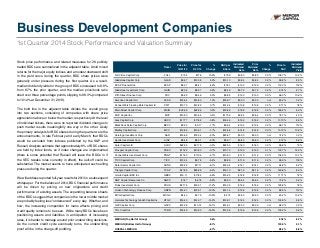
- 1. Stock price performance and related measures for 28 publicly traded BDCs are summarized in the adjacent table. Amid mixed returns for the major equity indices and a modest downward shift in the yield curve during the quarter, BDC share prices were generally under pressure during the first quarter. As a result, median dividend yields for the group of BDCs increased to 8.8% from 8.7% the prior quarter, and the median price/book ratio shed over three percentage points, slipping to 98.3% (compared to 101.4% at December 31, 2013). The bold line in the adjacent table divides the overall group into two sections, consisting of companies with share price appreciation above or below the median, respectively.At the level of individual tickers, there were no reported dividend changes to push market results meaningfully one way or the other. Likely the primary catalysts for BDC shares during the quarter were the announcements, in late February and early March, that BDCs would be excluded from indexes published by the S&P and Russell.Analysts estimate that approximately 8% of BDC shares are held by index funds, so if index changes are implemented (there is some potential that Russell will leave the BDCs in if the SEC tweaks rules currently in effect), the sell-off could be substantial. The market seems to have anticipated such selling pressure during the quarter. We will address reported full-year results for 2013 in a subsequent whitepaper. For the balance of 2014, BDC financial performance will be driven by pricing on new originations and credit performance of existing assets. The expanding balance sheets of the BDCs suggest that companies in the lower middle market are probably feeling less “underserved” every day. Whether, and how, the increasing competition for loans affects pricing and credit quality remains to be seen. While many BDCs have been positioning assets and liabilities in anticipation of increasing rates, it is harder to manage around prior underwriting decisions. As the current credit cycle eventually turns, the underwriting proof will be in the charge-off pudding. Business Development Companies 1st Quarter 2014 Stock Performance and Valuation Summary Ticker Price for 12/31/13 Price for 3/31/14 % Change NAV per Share Indicated Dividend Rate Prior Dividend Rate % Change Price to NAV Indicated Dividend Yield Full Circle Capital Corp FULL $7.04 $7.78 10.5% $7.09 $0.80 $0.80 0.0% 109.7% 10.3% Gladstone Capital Corp GLAD $9.57 $10.08 5.3% $10.10 $0.84 $0.84 0.0% 99.8% 8.3% KCAP Financial Inc KCAP $8.07 $8.41 4.2% $7.51 $1.00 $1.00 0.0% 112.0% 11.9% Gladstone Investment Corp GAIN $8.06 $8.27 2.6% $8.49 $0.72 $0.72 0.0% 97.4% 8.7% Fifth Street Finance Corp FSC $9.25 $9.46 2.3% $9.85 $1.00 $1.00 0.0% 96.0% 10.6% American Capital Ltd ACAS $15.64 $15.80 1.0% $18.97 $0.00 $0.00 nm 83.3% 0.0% PennantPark Floating Rate Capital Ltd PFLT $13.73 $13.82 0.7% $14.24 $1.08 $1.08 0.0% 97.1% 7.8% Main Street Capital Corp MAIN $32.69 $32.86 0.5% $19.89 $1.98 $1.98 0.0% 165.2% 6.0% MVC Capital Inc MVC $13.50 $13.55 0.4% $17.36 $0.54 $0.54 0.0% 78.1% 4.0% Ares Capital Corp ARCC $17.77 $17.62 -0.8% $16.46 $1.52 $1.52 0.0% 107.0% 8.6% BlackRock Kelso Capital Corp BKCC $9.33 $9.17 -1.7% $9.54 $1.04 $1.04 0.0% 96.1% 11.3% Medley Capital Corp MCC $13.85 $13.61 -1.7% $12.68 $1.48 $1.48 0.0% 107.3% 10.9% Saratoga Investment Corp SAR $15.65 $15.34 -2.0% $20.67 $0.00 $0.00 nm 74.2% 0.0% Apollo Investment Corp AINV $8.48 $8.31 -2.0% $8.57 $0.80 $0.80 0.0% 97.0% 9.6% Solar Capital Ltd SLRC $22.55 $21.78 -3.4% $22.50 $1.60 $1.60 0.0% 96.8% 7.3% Prospect Capital Corp PSEC $11.22 $10.80 -3.7% $10.73 $1.33 $1.33 0.1% 100.7% 12.3% PennantPark Investment Corp PNNT $11.60 $11.05 -4.7% $10.80 $1.12 $1.12 0.0% 102.3% 10.1% TICC Capital Corp TICC $10.34 $9.78 -5.4% $9.85 $1.16 $1.16 0.0% 99.3% 11.9% Solar Senior Capital Ltd SUNS $18.22 $17.11 -6.1% $18.04 $1.41 $1.41 0.0% 94.8% 8.2% Triangle Capital Corp TCAP $27.65 $25.89 -6.4% $16.10 $2.16 $2.16 0.0% 160.8% 8.3% Golub Capital BDC Inc GBDC $19.11 $17.84 -6.6% $15.23 $1.28 $1.28 0.0% 117.1% 7.2% NGP Capital Resources Co NGPC $7.47 $6.76 -9.5% $9.20 $0.64 $0.64 0.0% 73.5% 9.5% Fidus Investment Corp FDUS $21.74 $19.31 -11.2% $15.35 $1.52 $1.52 0.0% 125.8% 7.9% Horizon Technology Finance Corp HRZN $14.21 $12.51 -12.0% $14.14 $1.38 $1.38 0.0% 88.5% 11.0% MCG Capital Corp MCGC $4.40 $3.79 -13.9% $4.74 $0.50 $0.50 0.0% 80.0% 13.2% Hercules Technology Growth Capital Inc HTGC $16.40 $14.07 -14.2% $10.51 $1.24 $1.24 0.0% 133.9% 8.8% GSV Capital Corp GSVC $12.09 $10.14 -16.1% $14.91 $0.00 $0.00 nm 68.0% 0.0% THL Credit Inc TCRD $16.49 $13.80 -16.3% $13.36 $1.36 $1.36 0.0% 103.3% 9.9% MEDIAN (Top Half of Group) 0.6% 97.2% 8.7% MEDIAN (Bottom Half of Group) -8.1% 100.0% 9.1% OVERALL MEDIAN -2.7% 98.3% 8.8%
- 2. Business development companies are an important and growing source of funding for middle market companies. Along with private equity and other investment funds, BDCs provide billions of dollars of investment capital to private companies in every segment of the economy. For over thirty years, Mercer Capital has met the valuation needs of the same middle market companies to which BDCs and other funds provide capital. We offer the following services for BDCs and other investment funds: • Ongoing fair value measurement and review for portfolio investments • Fair value measurement process consulting • Solvency and fairness opinions • Regulatory review and litigation support • Purchase price allocation for portfolio companies • Goodwill impairment testing for portfolio companies • Equity compensation fair value measurement for portfolio companies • Buy-sell agreement consulting and valuation dispute resolution Mercer Capital’s senior valuation professionals bring broad and deep experience to the range of valuation needs faced by BDCs and other investment funds. For more information about Mercer Capital, visit www.mercercapital.com. Travis W. Harms, CFA, CPA/ABV 901.322.9760 harmst@mercercapital.com Tread B.Thompson, CPA 901.322.9753 thompsont@mercercapital.com Mercer Capital 5100 Poplar Avenue, Suite 2600 Memphis, Tennessee 38137 901.685.2120 (P) www.mercercapital.com Valuation Services for BDCs & Other Investment Funds Contact Us Copyright © 2014 Mercer Capital Management, Inc. All rights reserved. It is illegal under Federal law to reproduce this publication or any portion of its contents without the publisher’s permission. Media quotations with source attribution are encouraged. Reporters requesting additional information or editorial comment should contact Barbara Walters Price at 901.685.2120. Mercer Capital’s Industry Focus is published quarterly and does not constitute legal or financial consulting advice. It is offered as an information service to our clients and friends. Those interested in specific guidance for legal or accounting matters should seek competent professional advice. Inquiries to discuss specific valuation matters are welcomed. To add your name to our mailing list to receive this complimentary publication, visit our web site at www.mercercapital.com.