C-PACE market update: Q3 2015
•
0 likes•173 views

Learn how PACE (Property Assessed Clean Energy) continued to expand and kickstart efficient investments in this year's third quarter.

Recommended
Recommended
More Related Content
Viewers also liked
Viewers also liked (11)
Recently uploaded
Recently uploaded (20)
C-PACE market update: Q3 2015
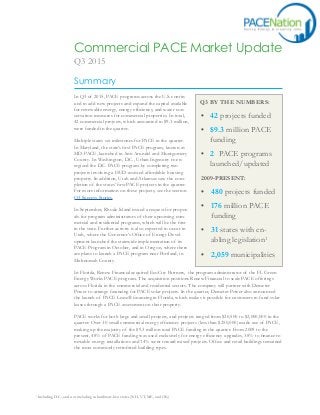
- 1. In Q3 of 2015, PACE programs across the U.S. contin- ued to add new projects and expand the capital available for renewable energy, energy efficiency, and water con- servation measures for commercial properties. In total, 42 commercial projects, which amounted to $9.3 million, were funded in the quarter. Multiple states set milestones for PACE in the quarter. In Maryland, the state’s first PACE program, known as MD-PACE, launched in Ann Arundel and Montgomery County. In Washington, D.C., Urban Ingenuity re-en- ergized the D.C. PACE program by completing two projects involving a HUD-assisted affordable housing property. In addition, Utah and Arkansas saw the com- pletion of the states’ first PACE projects in the quarter. For more information on these projects, see the section Q3 Success Stories. In September, Rhode Island issued a request for propos- als for program administrators of their upcoming com- mercial and residential programs, which will be the first in the state. Further activity is also expected to occur in Utah, where the Governor’s Office of Energy Devel- opment launched the statewide implementation of its PACE Program in October, and in Oregon, where there are plans to launch a PACE program near Portland, in Multnomah County. Commercial PACE Market Update Q3 2015 Summary Q3 BY THE NUMBERS: • 42 projects funded • $9.3 million PACE funding • 2 PACE programs launched/updated In Florida, Renew Financial acquired EcoCity Partners, the program administrator of the FL Green Energy Works PACE program. The acquisition positions Renew Financial to scale PACE offerings across Florida in the commercial and residential sectors. The company will partner with Demeter Power to arrange financing for PACE solar projects. In the quarter, Demeter Power also announced the launch of PACE Lease® financing in Florida, which makes it possible for customers to fund solar leases through a PACE assessment on their property. PACE works for both large and small projects, and projects ranged from $20,500 to $2,000,000 in the quarter. Over 30 small commercial energy efficiency projects (less than $250,000) made use of PACE, making up the majority of the $9.3 million total PACE funding in the quarter. From 2009 to the present, 48% of PACE funding was used exclusively for energy efficiency upgrades, 38% to finance re- newable energy installations and 14% went toward mixed projects. Office and retail buildings remained the most commonly retrofitted building types. 2009-PRESENT: • 480 projects funded • 176 million PACE funding • 31 states with en- abling legislation1 • 2,059 municipalities 1 Including D.C., and not including subordinate-lien states (NH, VT, ME, and OK)
- 2. Since 2009, PACE has scaled up with an average year-over-year growth rate in total financing of over 75%. States and municipalities have increasingly enabled PACE, with active programs in operation in many major population centers including Los Angeles, San Francisco, Austin, St. Louis, Washington D.C., and Cincinnati — and coming soon to Portland and Dallas. As a result, states with PACE- enabling legislation now encompass approximately 80% of the U.S. population. Relevant statistics are outlined below, and in the following figures: • States with PACE-enabling legislation: 314 • States with active PACE programs: 16 • PACE Programs in operation: 35 • Municipalities with PACE programs: 2,059 The PACE Landscape Fig. 1: Cumulative Total C-PACE Funding (2009-present) Table 1: Total C-PACE Funding by state (2009-present) Figure 1 above displays the cumulative total funds invested in PACE projects. To date, the cumulative estimated market total is approximately $176 million, as seen in Table 1 to the right. Current market totals include estimates of unreported data in some instances. For more information about our methods, see Methodology. 2 Including D.C., and not including subordinate-lien states (NH, VT, ME, and OK). 3 These numbers represent our best estimates based on self-reported statistics provided by programs. For more information, please see Methodology. Actual State # Projects Funded Total PACE Funding Estimate ($, rounded) California 179 65,000,000 Connecticut 89 54,000,000 Ohio 100 21,400,000 Florida 21 13,260,000 Minnesota 31 7,800,000 Wisconsin 3 4,845,000 Missouri 13 4,450,000 Michigan 6 1,580,000 D.C. 4 1,510,000 Colorado 29 1,477,000 New York 3 305,000 Utah 1 100,000 Arkansas 1 30,000 Total 480 176,000,000 Projected $0 $20 $40 $60 $80 $100 $120 $140 $160 $180 $200 Millions 3 3 Dec ‘10 Dec ‘11 Dec ‘12 Dec ‘13 Dec ‘14 Nov ‘15
- 3. Fig. 2: Map of PACE legislative activities and programs In the previous quarter, Rhode Island, Alabama, and Kentucky passed commercial PACE-enabling legislation for the first time and Virginia legislators passed a PACE amendment bill that improved the outlook for PACE in the state. In Q3, Rhode Island explored options for administrators of the state’s forthcoming PACE program, and VA stakeholders are developing a program. MD-PACE, Maryland’s first PACE program, also launched in the quarter. PACE Financial Servicing LLC was selected as Program Manager and Greenworks Lending was chosen as one of the program’s funding providers. The following are a series of descriptive charts showing the makeup of the PACE market, taking into account data from 2009 to the present. Fig. 3: Project Dollar Amount by Property Type (2009-present) Fig. 4: Number of Projects by Property Type (2009-present) $0 $5 $10 $15 $20 $25 $30 Millions -5 5 15 25 35 45 55 65 75 Projects
- 4. Renewable energy Energy efficiency Mixed Small, less than $75,000 Medium, $75,000 - $750,000 Large, greater than $750,000 Renewable energy Energy efficiency Mixed (Based on data available from 76% of projects.) Fig. 5: Type of Improvement by Project Dollar Amount (2009-present) Fig. 6: Type of Improvement by Number of Projects (2009-present) Renewable energy Energy efficiency Mixed (Based on data available from 71% of projects.) Fig. 8: Number of Projects by Project Dollar Amount, Categorized (2009-present) Fig. 7: Type of Improvement by Building Type (2009-present) (Based on data available from 74% of projects.) (Based on data available from 76% of projects.) 38% 48% 14% 46% 45% 9% 14% 31% 56% 0% 20% 40% 60% 80% 100% Number of Improvements by Building Type Renewable energy Energy efficiency Mixed
- 5. Q3 Success Stories Electric contractor cuts emissions, sets milestone for PACE in UT Hunt Electric used PACE financing to implement solar and smart grid upgrades on its headquarters in West Valley City, UT. The company provides electrical planning and installation for a variety of sectors, including commercial office buildings, industrial mining operations, and data centers in the Salt Lake City area. PACE enabled Hunt Electric to finance 100% of the project’s costs, which will be repaid over a 20-year term. The upgrades, which totaled $100,500, included a 72 module 23kW solar canopy, microgrid, and an electric vehicle charging station. Celtic Bank provided funding for the project. This project is a first for the state; West Valley City was the first municipality in the state to launch a PACE program after Utah passed statewide PACE legislation in 2013, and Hunt Electric is the first commercial business to make use of PACE financing. For their work with the C-PACE program, Hunt Electric and West Valley City were designated Clean Energy Pioneers by Utah Clean Energy, a local advocacy group. Community group benefits from PACE in Arkansas’ first project Communities Unlimited used PACE to finance energy efficiency retrofits totaling $27,000 on its offices in Fayetteville, AR. Communities Unlimited is a nonprofit organization dedicated to helping communities and small businesses escape poverty through sustainable entrepreneurial growth. The organization provides management consulting and lending for small businesses and homeowners, and technical assistance for community projects such as water treatment. Communities Unlimited used PACE to finance lighting upgrades, a new HVAC system, exterior sealing and insulation, window improvements, and the planting of shade trees. These improvements will create yearly savings of $5,000 for the organization. This project is the first PACE project completed in the state of Arkansas. In 2013, statewide legislation enabled PACE throughout the state, and Fayetteville was the first municipality in the state to create a PACE program in 2014. The program administrator, known as Arkansas Advanced Energy Equity (A2E2), arranged funding for this project from IBERIABANK Corporation, a regional bank.
- 6. PACE is set to become a major force in the U.S. energy landscape as well as a driver of local economic development and job creation for municipalities. The innovative aspects of PACE — including the long-term payback period it enables, which allows for cash-flow positive projects — mean that PACE meets the needs of many building owners, developers and financers that are not satisfied by other financing options. With approximately $176 million in commercial projects and over $1 billion in residential projects funded to date, PACE has already had a substantial impact on the greenhouse gas emissions, energy and water consumption, and indoor air quality of hundreds of commercial and thousands of residential properties. All signs point to the continued growth of PACE in both the commercial and residential sectors, which will lead to even greater positive impacts on communities around the country. Widespread solar and energy efficiency improvements are necessary to achieve state and national greenhouse gas reduction targets and renewable portfolio standards. PACE has proven to be one of the most effective ways to finance these improvements. In Connecticut, for example, a $1.5 million solar PV project financed with PACE led to a greenhouse gas reduction of over 3,000 MT — equivalent to taking 632 cars off the road. Economic Impacts By increasing the funds available for renewable energy, energy efficiency, and other improvements, PACE creates jobs for energy services contractors. But the economic impacts of PACE extend beyond these direct effects; the energy savings from PACE improvements leave money in the pockets of local businesses and homeowners, which leads to demand-side effects in local economies. In addition, this increased financial activity generates more tax revenue for local governments. A study of the economic impacts of PACE found that for every $1 million in PACE projects completed, 12 jobs are created.4 Accordingly, commercial PACE projects have so far led to the creation of approximately 2,000 jobs. Impact of PACE To gather the data displayed in this report and on our website, PACENation works with member PACE programs and practitioners from 16 states that voluntarily report their activity in the PACE market. PACENation does not collect data from all PACE programs in the U.S., and as such, the data we report are estimates based on likely market conditions. For the most up-to-date PACE market data, please see our online Data Dashboard. Methodology For more information, please visit our website at PACENation.us, or contact us by email at info@PACENow.org. PACENation is an initiative of PACENow, a 501 (c) (3) non-profit advocate for PACE financing, established in 2008. PACENation is movement of people and organizations who are joined in their support for PACE financing. Contact Us 4 Economic Impact Analysis of Property Assessed Clean Energy Programs, EcoNorthwest 2011