
Recommandé
Recommandé
Contenu connexe
Tendances
Tendances (20)
En vedette
Similaire à Simdis (simulated distillation)
Similaire à Simdis (simulated distillation) (20)
Dernier
Dernier (20)
Simdis (simulated distillation)
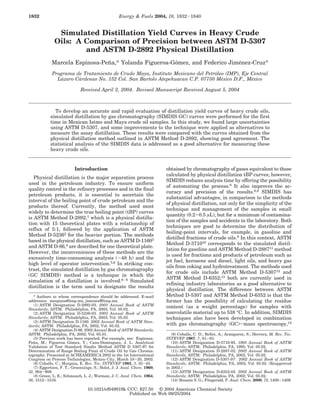
- 1. 1832 Energy & Fuels 2004, 18, 1832-1840 Simulated Distillation Yield Curves in Heavy Crude Oils: A Comparison of Precision between ASTM D-5307 and ASTM D-2892 Physical Distillation Marcela Espinosa-Pena,* Yolanda Figueroa-Gomez, and Federico Jimenez-Cruz* ˜ ´ ´ Programa de Tratamiento de Crudo Maya, Instituto Mexicano del Petroleo (IMP), Eje Central ´ Lazaro Cardenas No. 152 Col. San Bartolo Atepehuacan C.P. 07750 Mexico D.F., Mexico ´ ´ ´ ´ Received April 2, 2004. Revised Manuscript Received August 5, 2004 To develop an accurate and rapid evaluation of distillation yield curves of heavy crude oils, simulated distillation by gas chromatography (SIMDIS GC) curves were performed for the first time in Mexican Istmo and Maya crude oil samples. In this study, we found large uncertainties using ASTM D-5307, and some improvements to the technique were applied as alternatives to measure the assay distillation. These results were compared with the curves obtained from the physical distillation method outlined in ASTM Method D-2892, showing good agreement. The statistical analysis of the SIMDIS data is addressed as a good alternative for measuring these heavy crude oils. Introduction Physical distillation is the major separation process used in the petroleum industry. To ensure uniform quality control in the refinery processes and in the final petroleum products, it is essential to ascertain the interval of the boiling point of crude petroleum and the products thereof. Currently, the method used most widely to determine the true boiling point (tBP) curves is ASTM Method D-2892,1 which is a physical distillation with 15 theoretical plates with a relationship of reflux of 5:1, followed by the application of ASTM Method D-52362 for the heavier portion. The methods based in the physical distillation, such as ASTM D-11603 and ASTM D-86,4 are described for one theoretical plate. However, the inconveniences of these methods are the excessively time-consuming analysis (∼48 h) and the high level of operator intervention.5,6 In striking contrast, the simulated distillation by gas chromatography (GC SIMDIS) method is a technique in which the simulation of a distillation is involved.6-8 Simulated distillation is the term used to designate the results * Authors to whom correspondence should be addressed. E-mail addresses: mespinos@imp.mx, jimenezf@imp.mx. (1) ASTM Designation D-2892-03, 2003 Annual Book of ASTM Standards; ASTM: Philadelphia, PA, 2003; Vol. 05.02. (2) ASTM Designation D-5236-03. 2003 Annual Book of ASTM Standards; ASTM: Philadelphia, PA, 2003; Vol. 05.02. (3) ASTM Designation D-1160. 2002 Annual Book of ASTM Standards; ASTM: Philadelphia, PA, 2002; Vol. 05.02. (4) ASTM Designation D-86. 2002 Annual Book of ASTM Standards; ASTM: Philadelphia, PA, 2002; Vol. 05.01. (5) Previous work has been reported. For example, see: EspinosaPena, M.; Figueroa Gomez, Y.; Cano-Dominguez, J. L. Analytical ˜ ´ Validation of Test Standard Simdis Method ASTM D 5307-97 for Determination of Range Boiling Point of Crude Oil by Gas Chromatography. Presented at ACHEAMERICA 2002 in the 1st International Congress on Process Technologies, Mexico City, March 18-20, 2002. (6) Ceballo, C.; Murguia, E. Rev. Tec. INTEVEP 1983, 3, 35-45. (7) Eggertsen, F. T.; Groennings, S.; Holst, J. J. Anal. Chem. 1960, 32, 904-909. (8) Green, L. E.; Schmauch, L. J.; Worman, J. C. Anal. Chem. 1964, 36, 1512-1516. obtained by chromatography of gases equivalent to those calculated by physical distillation tBP curves; however, SIMDIS reduces analysis time by offering the possibility of automating the process.6 It also improves the accuracy and precision of the results.6,9 SIMDIS has substantial advantages, in comparison to the methods of physical distillation, not only for the simplicity of the technique and management of the samples in small quantity (0.2-0.5 µL), but for a minimum of contamination of the samples and accidents in the laboratory. Both techniques are good to determine the distribution of boiling-point intervals, for example, in gasoline and distilled fractions of crude oils.9 In this context, ASTM Method D-371010 corresponds to the simulated distillation for gasoline and ASTM Method D-288711 method is used for fractions and products of petroleum such as jet fuel, kerosene and diesel, light oils, and heavy gas oils from coking and hydrotreatment. The methods used for crude oils include ASTM Method D-530712 and ASTM Method D-6352;13 both are currently used in refining industry laboratories as a good alternative to physical distillation. The difference between ASTM Method D-5307 and ASTM Method D-6352 is that the former has the possibility of calculating the residue content (as a weight percentage) for samples with nonvolatile material up to 538 °C. In addition, SIMDIS techniques also have been developed in combination with gas chromatography (GC)-mass spectroscopy,14 (9) Ceballo, C. D.; Bellet, A.; Aranguren, S.; Herrera, M. Rev. Tec. INTEVEP 1987, 7, 81-83. (10) ASTM Designation D-3710-95. 1995 Annual Book of ASTM Standards; ASTM: Philadelphia, PA, 1995; Vol. 05.02. (11) ASTM Designation D-2887-02. 2002 Annual Book of ASTM Standards; ASTM: Philadelphia, PA, 2002; Vol. 05.02. (12) ASTM Designation D-5307-97 . 2002 Annual Book of ASTM Standards; ASTM: Philadelphia, PA, 2002; Vol. 05.02. (Reapproved in 2002.) (13) ASTM Designation D-6352-02. 2002 Annual Book of ASTM Standards; ASTM: Philadelphia, PA, 2002; Vol. 05.02. (14) Roussis S. G.; Fitzgerald, P. Anal. Chem. 2000, 72, 1400-1409. 10.1021/ef049919k CCC: $27.50 © 2004 American Chemical Society Published on Web 09/25/2004
- 2. Distillation Yield Curves in Heavy Crude Oils GC-vacuum thermogravimetry,15 or high-performance liquid chromatography (HPLC)-evaporative light scattering detector.16 The method of high temperature for simulated distillation (HT SIMDIS), as described in ASTM Method D-5307, have not been extensively proven by the oil industry, because of the existence of many problems in the preparation and nonhomogenization of the sample. These problems must be solved, because, to obtain reliable results, a quantitative method requires a rigorous and exact mass balance. In this paper, we wish to describe a strategy for developing and optimizing an appropriate methodology for the rapid evaluation of distillation yield curves in Mexican crude oils using GC SIMDIS described in ASTM Method D-5307. In addition, an expeditious and improved methodology for preparing heavy oil samples is described. Also, a comparison with the results of physical distillation (ASTM Method D2892) tests was performed.5 Experimental Section The samples of Istmo and Maya crude oil were supplied from Pemex. Carbon disulfide (99.00%) was purchased from Aldrich Chemical Company. A mixture of n-alkanes C5 through C98 (Polywax 655) was purchased from Analytical Control U.S.A. A mixture of n-alkanes C14, C15, C16, and C17, which were used as internal standards traceable to the National Institute for Standards and Technology (NIST), was purchased from Hewlett-Packard. A mixture of n-alkanes C5 through C44 was used as a reference in the SIMDIS analysis, for comparison and validation of the test. The analyses were performed with a Hewlett-Packard model HP 6890-II gas chromatograph that was equipped with a flame ionization detector (FID) with an outlet diameter of 0.30 mm, a liquid nitrogen cryogenic system, automatic injection for eight vials, and software for calculation of the SIMDIS methods. The column used was 5-6 m long, comprised of stainless-steel capillary columns 0.53 mm in diameter, and filled with methyl silicon, and the film thickness was 0.090.15 µm, respectively. The carrier gas was helium (99.999% purity), with a flow of 20 mL/min and an inlet pressure of 80 psi. The injector and detector temperatures were each 430 °C. The combustible gas for feeding the detector was hydrogen (99.999% purity), with an inlet pressure of 60 psi and a flow rate of 35 mL/min and air (99.999%, chromatographic grade) with an inlet pressure of 80 psi and a flow rate of 350 mL/ min. The FID is highly sensitive (5 pg C/s) to hydrocarbons, which allows for detection of the high-boiling-point components, such as heavy crude oil and their fractions. The detector has a low sensitivity to carbon disulfide, which allows injection of the dissolved crude oils into the chromatograph. Although the FID is a mass-dependent detector, the analytic results are comparable to the results of a physical distillation expressed in terms of a volume percentage. Conditioning of the Column. The column was conditioned without being connected to the detector, by purging with helium at low temperature. The column outlet was covered immediately with an appropriate seal. The flow of helium was continued for 2-3 h at 430 °C. The oven was cooled at 100 °C, and the seal was removed, to re-establish the helium flow in the column. The equipment was programmed 2-3 times at the operation conditions and the column was connected to the detector. The equipment was stabilized at the required conditions. The oven was programmed to operate from 40 °C to 430 (15) Southern, T. G.; Iacchelli, A.; Cuthiell, D.; Selucky, M. L. Anal. Chem. 1985, 57, 303-308. (16) Padlo, D. M.; Kugler, E. L. Energy Fuels 1996, 10, 1031-1035. Energy & Fuels, Vol. 18, No. 6, 2004 1833 °C and the injector was programmed to operate from 100 °C to 430 °C, at a rate of 15 °C/min, and the detector was programmed to operate from 50 °C to 430 °C, a rate of 10 °C /min. The chromatogram was integrated over a period of 44 min, and the final temperature of the oven continued for 10 min to clean the system. The injector temperature was maintained for 2 min. Preparation of the Sample. The samples were previously stored at a temperature of 0-5 °C for at least 4 h before exposing them to the environment. To ensure homogeneity, the heavy and viscous crude may require warming, as well as stirring. The samples should be dried with anhydrous calcium chloride or sodium sulfate by shaking the mixture of sample and drying agent vigorously. According to ASTM Method D-5307, the low-viscosity liquid samples can be analyzed directly. The dried sample is removed from the desiccant using a pipet and accurately weighted (0.15-0.20 g) in a 25 mL volumetric flask and dissolved with 10 g of carbon disulfide. The solution was weighed, and it had a concentration of ∼2%. Two milliliters of this solution was withdrawn and poured into a vial that had been weighed; this sample should be considered as the sample without internal standard. The remainder of the solution was weighed after this process and then a weighed quantity of internal standard (20 µL, measured in a tared 100 µL syringe) was added to the remaining solution and mixed by shaking. As done previously, 2 mL of this solution was poured into a vial and should be considered as the sample with internal standard. Physical Distillation. This procedure was performed according to ASTM Method D-2892. The water-free crude was tested using columns of 15 theoretical plates under a relationship of reflux of 5:1; this method is known as the true boiling point (tBP) assay. The distillation started under barometric pressure (760 mm Hg) and is continued later under vacuum conditions (5-100 mm Hg) at 370 °C. The boiling points are converted to their equivalent value at 1 atm (AEBP). At this point, the method was changed to the corresponding ASTM Method D-5236 procedure, in which the distillation continued at a pressure of 0.5 mm Hg until reaching a limit near the AEBP (538 °C). Conversion charts for the conditions of AEBP are included in the method. Results and Discussion For the purposes of this study, four analyses were performed with two different crude oils from the two following categories: Istmo crude (20-30 °API, 0.8932 g/cm3) and Maya crude (<20 °API, 0.9238 g/cm3). In addition, two repeatability experiments and two reproducibility experiments for each operator were performed, according to the procedure described for ASTM Method D-5307. The comparison between the two analyses allows the percentage of the eluted sample to be calculated, up to a temperature of 538 °C. Basically, ASTM Method D-5307 is an extension of ASTM Method D-2887, but the addition of a standard is not required. By considering this stipulation, the strategy consisted of performing an initial analysis for a calibration mixture of C5 to C44 linear paraffins, under the same conditions of the sample analysis under which all the assignments were performed, by comparison with this curve. Figure 1 shows a chromatogram with a boilingpoint (BP) distribution of the C5-C44 paraffin mixture, as well as a plot of the calibration curve. At high temperature, the samples should be eluted up to 430 °C, which is equivalent to atmospheric conditions. Therefore, elution of the C44 paraffin, which has a BP >538 °C, is conducted at 430 °C. Under these conditions,
- 3. 1834 Energy & Fuels, Vol. 18, No. 6, 2004 Espinosa-Pena et al. ˜ Figure 1. Chromatogram (top) and calibration curve (bottom) for the mixture C5-C44. no evidence of cracking has been visualized. In the selected chromatographic conditions, the separation of the corresponding peaks is good, which avoids saturation of the column. For the heavy crude oil, the sample
- 4. Distillation Yield Curves in Heavy Crude Oils Energy & Fuels, Vol. 18, No. 6, 2004 1835 Table 1. Boiling Point Distribution in Reference Gas Oila mass % boiling point, BP (°C) mass % boiling point, BP (°C) mass % boiling point, BP (°C) mass % boiling point, BP (°C) IBPb 1 2 3 4 5 6 7 8 9 10 11 12 13 14 15 16 17 18 19 20 199.0 334.5 374.5 389.0 397.5 403.5 408.0 412.0 415.0 418.0 420.5 422.5 424.5 426.5 428.0 429.5 431.0 432.5 434.0 435.0 436.5 21 22 23 24 25 26 27 28 29 30 31 32 33 34 35 36 37 38 39 40 41 437.5 439.0 440.0 441.0 442.0 443.0 444.0 445.0 446.0 446.5 447.5 448.5 449.5 450.5 451.0 452.0 452.5 453.5 454.0 455.0 456.0 42 43 44 45 46 47 48 49 50 51 52 53 54 55 56 57 58 59 60 61 62 456.5 457.5 458.5 459.0 460.0 461.0 461.5 462.5 463.0 463.5 464.5 465.0 466.0 467.0 467.5 468.5 469.0 469.5 470.5 471.0 472.0 63 64 65 66 67 68 69 70 71 72 73 74 75 76 77 78 79 80 81 82 83 473.0 473.5 474.5 475.0 476.0 477.0 477.5 478.5 479.0 480.0 481.0 481.5 482.5 483.5 484.5 485.5 486.5 487.0 488.0 489.5 490.5 mass % boiling point, BP (°C) 84 85 86 87 88 89 90 91 92 93 94 95 96 97 98 99 FBPc 491.5 492.5 494.0 495.0 496.5 497.5 499.0 500.5 502.5 504.0 506.5 509.0 511.5 515.5 520.0 527.5 534.0 a Pertinent sample data: calibration method, external standard method; sample mass, 0.2184 g; solvent mass, 10.0860 g; mass of internal standard, 0.0000 g; elution at start, 0.00; elution at end, <24.43; found recovery, 102.0%; and used recovery, 100.0%. b Initial boiling point. c Final boiling point. is not eluting completely in the chromatographic column, and, thus, area normalization cannot be applied. The sample then must be analyzed in duplicate. In the first run, the sample without an internal standard is analyzed, whereas in a second run, the sample with an internal standard is analyzed. The comparison between two analyses allows calculation of the percentages of sample that were eluted up to 538 °C. With these values, these percentages are re-normalized from intervalcalculated BPs on the corresponding normalized curve of distillation for the analysis of the sample without internal standard. For quality assurance, the reference gas oil that was analyzed by physical distillation was also analyzed by SIMDIS after and before each sequence of samples. Results are reported in terms of mass percentage in Table 1 and as the SIMDIS curve in Figure 2. The BP distribution in Maya crude is described for a mass fraction of 59.4 mass %, in which the initial boiling point (IBP) was 36 °C and the final boiling point (FBP) was 545 °C (see Table 2). The residue fraction is estimated to be 40.6 mass %. In the Istmo crude, the BP distribution is given for 80 mass % crude and 20 mass % residue. The corresponding chromatograms of Maya crude with and without internal standard are showed in Figure 3. In these chromatograms, the quantitative calculations are illustrated and were performed using the re-normalization area method: the chromatogram of the eluted sample is divided in three segments, each of which represents the percentage of total area and the total volume of the sample whose BP interval corresponds to the assigned temperature and the respective retention time. The first segment (denoted as A or B) corresponds to the total area of the sample (crude with or without internal standard) that is eluting up to 538 °C, and the second segment (denoted as AIS or BIS) is the total area of the internal standard in the chromatogram either with or without the internal standard. The third segment (denoted as AI or BI) describes the area of the noneluted sample after 538 °C. The chromatogram of the sample without internal standard allows calculation of the relationship that exists between the area of the second segment and the sum of the areas of the first and third segments. For practical purposes, the response factor in each integrated segment is considered to be 1.17 The response of the detector is proportional to the distilled quantity for each BP interval, and it is equivalent to the percentage of this response, with respect to the total response of the components in the analyzed mixture. Because of the regularity of elution order, the retention times can be correlated with BP temperatures, the graphic representation of which is a straight line (see Figure 1). The empiric correlation between retention time and BP temperature is established using a mixture of n-paraffin that covers the expected BP interval. Although these calculations can be performed automatically by the SIMDIS software, they can be calculated empirically by integrating the areas of each segment in both chromatograms.12 The usefulness of any method, in regard to its ability to determine the tBP curves, is greatly dependent on its ability to provide repeatable data. Therefore, it is a fundamental requirement to obtain tBP curves with the maximum level of repeatability possible. According to ASTM Method D 5307-97 , the established repeatability and reproducibility values in Maya and Istmo samples are compared to the corresponding obtained values in tBP. Table 3 presents this data as a temperature fluctuation (twice the standard deviation), in terms of degrees centigrade, observed for different intervals of weight percent. Taking into account an average of four determinations for two different operators, these values are very satisfactory, in regard to mass percent and even volume percent. To describe the improvements of the SIMDIS method in heavy Mexican crude oils over the physical distillation method, a comparison of both methods was performed; (17) Villanti, D. C.; Maynard, J. B.; Aryan, J. C.; Frayed, A. A. Yield Correlation between Crude Assay Distillation and High-Temperature Simulated Distillation (HTSD). Presented at the 1997 AIChE Spring National Meeting Houston, TX, March 9-13, 1997.
- 5. 1836 Energy & Fuels, Vol. 18, No. 6, 2004 Espinosa-Pena et al. ˜ Figure 2. Boiling-point distribution plot showing the simulated distillation (SIMDIS) curve for reference gas oil. Table 2. Boiling Point Distribution in Maya Crude Oila mass % boiling point, BP (°C) mass % boiling point, BP (°C) mass % boiling point, BP (°C) mass % boiling point, BP (°C) IBPb 1 2 3 4 5 6 7 8 9 10 11 12 <36.0 57.0 89.0 103.0 119.0 127.5 140.0 150.5 157.0 168.5 176.0 185.5 196.5 13 14 15 16 17 18 19 20 21 22 23 24 25 204.0 215.0 221.5 231.5 239.0 249.0 257.0 265.0 272.5 281.0 288.0 296.5 303.0 26 27 28 29 30 31 32 33 34 35 36 37 38 311.0 317.5 326.0 333.0 341.5 348.5 356.0 363.0 369.5 377.5 384.5 392.0 399.5 39 40 41 42 43 44 45 46 47 48 49 50 51 406.5 414.0 421.0 428.0 434.5 441.5 448.5 456.0 463.0 470.0 477.5 484.5 491.5 mass % boiling point, BP (°C) 52 53 54 55 56 57 58 59 59.4 498.5 505.5 512.0 518.0 524.0 530.5 536.5 542.5 545.0 a Pertinent sample data: calibration method, ASTM D 5307; sample mass, 0.0717 g; solvent mass, 5.9518 g; mass of internal standard, 0.0100 g; elution at start, 0.04; elution at end, <24.46; found recovery, 59.4%; and used recovery, 59.4%. b Initial boiling point. this comparison showed good agreement, in terms of either mass percent or volume percent (see Figures 4 and 5). These comparisons were evaluated by the standard deviation parameter (σn-1). The value of this feature, in terms of mass percent, for IBP to FBP of Maya crude was in the range of 0.0-9.60 for physical distillation and 0.0-6.71 for SIMDIS; for Istmo crude, the σn-1 value was 0.0-6.92 for physical distillation and 0.0-0.25 for SIMDIS (see Table 4). Determination of the volume percentage using the SIMDIS method is highly desirable, because the majority of refinery operations are based on volume percentage rather than mass percentage. A plot of mass percentage versus volume percentage is constructed for the physical distillation results. The obtained curve allowed interpolation between the mass and volume percentage values from the SIMDIS method. Before these values are correlated to determine the corresponding values for volume percentage in the SIMDIS method (see Table 5), the standard deviation indicates that the values are in good agreement. The best values of σn-1 are observed for the SIMDIS method, in comparison to physical distillation. For Maya crude oil, in terms of volume percentage, the σn-1 value from IBP to FBP is 0.0 to 0.00 using the SIMDIS method, which shows slight differences from IBP to FBP (σn-1 is 0.069 to 1.7). For Istmo crude oil, the σn-1 value for physical distillation from IBP to FBP is 2.6 to 0.00, and the SIMDIS method exhibits a σn-1 value of 1.8 to 1.8. The SIMDIS results are dependent on the baseline and the required correction for compensating the continuous partial loss of the stationary liquid phase,
- 6. Distillation Yield Curves in Heavy Crude Oils Energy & Fuels, Vol. 18, No. 6, 2004 1837 Figure 3. Chromatograms of Maya crude with internal standard (top) and without an internal standard (bottom).
- 7. 1838 Energy & Fuels, Vol. 18, No. 6, 2004 Espinosa-Pena et al. ˜ Table 3. Temperatures for Repeatability and Reproducibilitya Repeatability (°C) mass % (0.5) IBP 5 10 20 30 40 50 60 70 80 FBP residue repeatability 3.7 4.7 6.9 6.8 7.6 9.3 10.6 11.8 17.6 24.8 2.6% (°C)b reproducibility (°C)b 10.6 14.8 11.3 15.4 20.4 24.6 30.3 25.9 39.2 38.8 8.1% a Istmo crude 2.0 2.0 11.0 2.0 11.0 9.0 10.0 8.0 5.0 0.25 20% Reproducibility (°C) Maya crude Istmo crude 2.0 2.0 10.0 10.0 10.0 15.0 19.0 18.0 0.25 21.5% 40% Maya crude 2.0 2.0 5.0 8.0 9.0 8.0 8.0 8.0 4.0 0.25 2.0 2.0 5.0 5.2 4.8 5.2 15.4 0.25 41.5% b Average of four determinations of the temperature fluctuation and twice the standard deviation. Data obtained using ASTM Method D-5307 . Figure 4. Comparison between physical distillation and SIMDIS mass curves (top) and volume curves (bottom) in Maya crude. Legend for mass curve: ([) physical distillation, (0) SIMDIS 1, and (4) SIMDIS 2. Legend for volume curve: ([) physical distillation and (4) SIMDIS. because of the high operation temperatures of the chromatograph. The chromatograph has a specific device in place to subtract the baseline in each chromatogram electronically. The reproducibility and precision of the results is achieved with automatic injection. Note the possible evaporation of the solvent during the manipulation: the previous registration of the weights during the sample preparation for each vial diminishes the systematic error. The differences of statistical error, or the confidence interval, between both physical and simulated distillation curves are reported in Table 6. The values for the
- 8. Distillation Yield Curves in Heavy Crude Oils Energy & Fuels, Vol. 18, No. 6, 2004 1839 Figure 5. Comparison between physical distillation and SIMDIS mass curves (top) and volume curves (bottom) in Istmo crude. Legend for mass curve: (9) physical distillation, (*) SIMDIS 1, and (b) SIMDIS 2. Legend for volume curve: ([) physical distillation and (9) SIMDIS. Table 4. Comparison between Physical Distillation and SIMDIS, on the Basis of Mass Percentage, for Maya and Istmo Crude Oils Maya Crude Physical Distillation SIMDIS mass % boiling point, BP (°C)a σb 0.5 5.0 10.0 20.0 30.0 40.0 50.0 55.0 58.0 37.5 115.0 160.0 250.0 320.0 400.0 476.0 516.0 538.5 0.00 3.60 3.05 4.04 3.21 4.16 5.03 4.04 9.60 a Istmo Crude Physical Distillation boiling point, BP (°C) mass % (1)c (2)d 0.5 5.0 10.0 20.0 30.0 40.0 50.0 55.0 58.0 36.0 100.5 155.0 249.0 329.0 405.0 479.0 514.0 533.0 36.0 100.5 157.0 254.0 334.5 412.5 488.5 523.0 542.5 SIMDIS σb mass % boiling point, BP (°C)a σb 0.00 0.00 1.76 3.53 3.88 5.30 6.71 6.36 6.71 0 5 10 20 30 40 50 60 70 77 0.0 80.0 114.5 173.5 235.5 287.5 341.5 401.5 473.5 534.0 0.00 2.94 2.49 3.29 2.64 3.39 4.10 3.29 5.43 6.97 Average of four determinations. b Standard deviation. c Results for operator 1 in SIMDIS. SIMDIS method are less than the corresponding values for physical distillation. In SIMDIS, the confidence intervals after 430-538 °C are greater for Maya crude, d boiling point, BP (°C) mass % (1)c (2)d 0.5 5.0 10.0 20.0 30.0 40.0 50.0 60.0 70.0 80.0 36.0 89.0 123.5 180.0 238.0 293.5 349.0 405.0 468.5 542.0 36.0 89.0 126.0 184.0 242.5 297.5 351.5 409.0 470.5 541.5 σb 0.00 0.00 1.25 2.00 2.25 2.00 2.00 2.00 1.00 0.25 Results for operator 2 in SIMDIS. in comparison to Istmo crude. Heavy or very heavy crude oils can be analyzed by following the improved methodology described here.
- 9. 1840 Energy & Fuels, Vol. 18, No. 6, 2004 Espinosa-Pena et al. ˜ Table 5. Comparison between Physical Distillation and SIMDIS, on the Basis of Volume Percentage, for Maya and Istmo Crude Oils Maya Crude Istmo Crude Physical Distillation SIMDIS Physical Distillation SIMDIS vol % boiling point, BP (°C)a σb vol % boiling point, BP (°C)a σb vol % boiling point, BP (°C)a σb vol % boiling point, BP (°C)a σb 0.5 10.0 20.0 30.0 40.0 50.0 60.0 64.9 37.7 138.0 210.0 280.0 348.0 420.7 497.3 538.0 0.000 1.750 1.732 5.011 5.563 3.857 2.142 0.000 0.5 10.0 20.0 30.0 40.0 50.0 60.0 64.5 36.0 126.5 216.5 287.5 358.0 435.0 510.0 542.0 0.691 1.312 1.080 2.248 1.700 1.841 1.027 1.700 0.5 10.0 20.0 30.0 40.0 50.0 60.0 70.0 80.0 84.5 25.7 80.0 104.3 153.0 204.3 256.0 309.0 428.7 506.7 538.0 2.625 2.494 1.700 3.682 2.161 3.742 5.312 3.682 5.793 0.000 0.5 10.0 20.0 30.0 40.0 50.0 60.0 70.0 80.0 84.5 0.5 110.0 151.0 209.0 264.5 308.0 363.0 427.0 498.0 542.0 1.871 1.027 1.650 1.650 2.494 1.312 1.871 0.850 3.082 1.841 a Average of four determinations. b Standard deviation. Table 6. Comparison of Physical Distillation (ASTM D-2892) and SIMDIS (ASTM D-5307) in Maya and Istmo Crude Oils Maya Crude Physical Distillation mass % avg BP (°C)a confidence rangea 0 10.7 20.8 31.5 41.0 58.3 37.67 166.66 254.33 334.67 406.67 538.00 (16.1 (6.6 (5.25 (2.49 (5.73 (0.00 Istmo Crude SIMDIS GC mass % avg BP (°C)a Physical Distillation confidence rangea Operator 1 46.5 (10.5 159.00 (8.5 249.50 (5.5 328 (1.0 403 (1.75 477 (4.0 538.5 (4.0 1 10 20 30 40 50 58.4 a 1 10 20 30 40 50 58.4 Operator 2 43.5 164.25 252.5 328.75 402 473.75 539.75 SIMDIS GC mass % avg BP (°C)a confidence rangea mass % 0.5 10.7 20.8 31.5 41.0 58.3 60.5 70.9 80.0 25.66 144.66 173.66 235.33 287.66 341.00 401.66 473.66 538.00 (2.62 (2.94 (3.30 (2.62 (3.40 (4.11 (3.30 (5.43 (0.00 0.5 10 20 30 40 50 60 70 80 Operator 2 36 123.50 180.00 239.50 295.00 349.25 407.25 469.50 545.00 (0.00 (1.25 (0.50 (2.25 (2.0 (2.0 (1.00 (0.25 (0.00 0.5 10 20 30 40 50 60 70 80 Operator 2 36 122.25 180.0 239.25 295.50 349.00 407.25 469.50 545.00 (0.00 (2.25 (0.50 (1.25 (1.75 (1.75 (1.25 (0.25 (0.00 (7.5 (9.25 (3.5 (0.25 (3.0 (5.25 (5.25 avg BP (°C)a confidence rangea Average of four determinations. Conclusions The true boiling point (tBP) curves that are obtained by simulated distillation (SIMDIS) are characterized by a greater level of confidence than those obtained by the combination of two physical distillation methods, because they are obtained in a single continuous experiment with no additional correction to account for pressure differences. The volume percentage plot is characterized by a higher degree of scattering, perhaps because of the error associated with the fluctuation of the average density values for individual azeotropic-type mixtures of compounds in the tBP curve. A rapid and reliable SIMDIS method that was based on ASTM Method D-5307-97 for two heavy Mexican crude oils was assayed and analyzed. The improved method for preparing the samples and the appropriate consideration of quantifying the solvent evaporation deserved special attention. Comparison between the mass and volume percentage curves for this crude, as determined by physical distillation and the SIMDIS methods, showed good agreement. The precision of the SIMDIS method for these samples at a final boiling point (FBP) of 538 °C is better than (0.5 mass %. The correlation between physical and simulated distillation is, on average , <2 mass % for the interval of 10 °C. The confidence interval is (2 mass % for Istmo crude and (3 mass % for Maya crude. Acknowledgment. The authors wish to acknowledge the financial support of IMP. EF049919K