Uae-NO1 Black Magic Specialist In Lahore Black magic In Pakistan Kala Ilam Ex...
Notes sendby thakur sir 08-03-11
1. Financial Management Made Easy
Financial Analysis
A banker advances to many clients including individuals, traders, firms and corporate. Before a
loan is granted the banker needs to do an evaluation of the firm’s/company’s financial position
by applying different parameters. On e important parameter is to do a financial analysis.
The advantages of financial analysis are:
To understand the financial position of the firm/company (prospective/existing)
To assess the repayment capacity of the firms (the loan amount + interest + other fees)
To evaluate the managerial skills of the management team, with special reference to
the financial management.
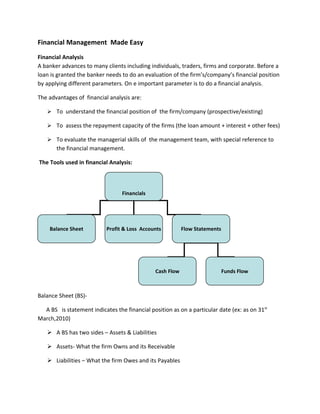
The Tools used in financial Analysis:
Financials
Balance Sheet Profit & Loss Accounts Flow Statements
Cash Flow Funds Flow
Balance Sheet (BS)-
A BS is statement indicates the financial position as on a particular date (ex: as on 31st
March,2010)
A BS has two sides – Assets & Liabilities
Assets- What the firm Owns and its Receivable
Liabilities – What the firm Owes and its Payables
2. Shows Sources of Funds and Uses of funds
To have a fair idea/view about the financial position of a firm/company, the interested
persons /Institutions (investors,analysts,bankers,credit rating agencies) need to analyse the
financials for a period of three to five years. The study/analysis helps to understand the trend
about the various aspects. The analysis need to cover the entire period of 12 months. The
study should be based on different set of figures to arrive at a meaningful decision.
Ratio Analysis: (RA) is used by the analysts to compare and understand the financial position of
a firm/company. Ratios are used as tools for this type of analysis. Ratio analysis is a process of
establishing a significant relationship between the items of financial statements to provide a
meaningful understanding of the performance and financial position of a firm.
Classification of ratios I-(Expression/Degree of Importance
Types of Ratios
Degree of
Mode of expression
Importance
Simple/Pure Primary
Percentage Rate Secondary
tertiary
3. Classification of ratios II-Users
Auditors
Short tem
creditors-Banks
Management
Users
Credit Analysts- Long term
Credit Rating creditors-Banks/
Cos Fin Institutions
Investors/Share
holders
4. Classification of ratios III – Important Parameters
Liquidity
Ratio
Solvency
ratio
Activity ratio
Profitability
Ratio
5. Classification of ratios IV – Financial Statements:
Balance
Sheet
Funds P&L
Flow Account
Cash
Flow
Briefly we try to understand the following:
Traditional Classification: On the basis of financials. They are classified as
P&L a/c ratios: i.e., ratios calculated on the basis of p/l a/c only
Balance sheet ratio: ratios on the basis of figures of balance sheet only
6. Composite or inter statement ratios: on the basis of the figures of P&L as well as Balance sheet
ratios can be classified into:
• Financial or Solvency Ratio
• Turnover or Activity Ratio
• Profitability or Income Ratio
Financial Ratios may be classified into
Short term solvency ratios: This discloses the financial position or solvency of the firm in the
short term. This is also called as ‘Liquidity Ratio”
Long term solvency ratios : This discloses the financial position or solvency of the firm in the
long term. This is also called as ‘Solvency Ratios”
Advantages of Ratios as a tool for financial analysis:
It simplifies the reading of the financial statements
Helps in Inter firm comparison
Highlights the factors associated with successful/unsuccessful firms.
Reveals different positions of the firm/s such as strong/weak/overvalued and undervalued
Helps in Planning and forecasting
Recap:
Ratios can assist the user (lender, management) in the basic functions of forecasting,
planning, coordination, control and communication.
Limitations of Ratios:
+ Comparative study required
+ Non financial changes, an important factor is not covered
+ Different accounting policies in the same industry may distort the results
+ Ratios alone are not adequate: Ratios are only indicators. Other things are also needed for
taking decision.
7. Example: (i) a high current ratio does not necessarily mean that the concern has a good
liquidity position ( in case the current assets consists of outdated stocks) (ii) debtors beyond a
reasonable period if not excluded from the current assets would not reveal the correct position
Ratios tells the analyst/user to ‘stop, look and decide’
Window dressing:
} Window dressing is manipulation of accounts, i.e., concealment of facts and figures
} Does not reveal the factual position, but reflects a better position that what actually is,
Example : A high stock turnover ratio is generally considered as an indication to operational
efficiency. This may be achieved by unwarranted price reduction or failure to maintain proper
stock of goods This might result in a favorable ratio/s.
Changes in Price levels: Two firms depreciate the machinery based on their date of purchase
then the deprecation would be lower for the older company than the new company. Hence
mere comparative study does not convey purposeful meaning.
A) Profitability Ratios:
1) Overall Profitability Ratio:
Known as ‘Return on Investment’ It indicates the % of return on the total capital employed in
the business. Formula : Operating Profit/Capital employed x 100
Capital employed: (i) Sum Total of all assets (fixed+current) (ii)Sum total of fixed assets
(iii) Sum total of long term funds employed in business.,
Share Capital + Reserves and surplus + Long Term loans – (Non-business assets + fictitious
assets)
Operating Profit is the profit before interest and tax. Interest means Interest on long term
borrowings. Interest on short term borrowings is deducted for computing operating profit.
Non trading income such as interest on GOI Sec or non trading losses or expenses such as loss
on a/c of fire will be excluded
2) Return on Investment(ROI): The ROI is a concept which is also stated as YOC (Yield on
Capital). ROI indicates the efficiencies/deficiencies of the firm’s performance. The profit being
the net result of all operations, the return on Capital is an important indicator to measure the
performance of a firm.
8. Suppose a firm borrow funds @ 8% and the ROI is 7 %, it is better not to borrow (unless
absolutely necessary). Further, it shows that the firm has not been employing the funds
efficiently
3) Earning per Share (EPS): This indicates the overall profitability of a firm. ROI comparison
would be effective only when two firms are of the same age, same size. To avoid this
mismatch, evaluation based on EPS is a better option.
EPS tells the earning per equity share. EPS= Net Profit after tax and pre dividend/Number of
equity share.EPS helps in determining the market price of the equity share of the company. A
comparison of EPs of two firms shows, whether the equity share capital is being effectively
used or not.
4) Price Earning (P/E) Ratio:
The number of times the EPS is covered by the market price. P/E ratio=Market Price per equity
share/EPS. P/E ratio helps investor/s to decide to buy or not to buy the shares of a company
5)Gross Profit Ratio: Gross Profit/Net Sales x100. This ratio indicate the degree to which the
selling price of goods per unit may decline without resulting in losses from operations.
6) Net Profit Ratio: This indicates the net margin earned on a sale of Rs.100.Net Operating
Profit/Net Sales x100
This shows the efficiency of the firm. An increase in the ratio over the previous period shows
improvement in the operational efficiency of the business provided the gross profit ratio is
constant. An effective measure to check profitability of business
B) Solvency Ratios:
A firm is said to be solvent or financially sound, if it is in a position to carry on its business
smoothly and meet all its obligations, both long and short term without strain/any issue.
1) Long term Solvency Ratios:
(a) Fixed assets Ratio: Fixed assets/long term funds. This ratio should not be more than 1.
{Fixed assets include net fixed assets (original cost –depreciation to date) and trade
investments including shares in subsidiaries. Long term funds include share capital reserves,
and long term loans}If it is less than 1, it shows that a part of the working capital has been
financed through the long term funds. This is possible to some extent because, a part of the
working capital termed as core working capital is more or less of a fixed nature. The ideal ratio
=0.67
9. (b) Debt Equity Ratio: This is calculated to find out the soundness of the long term financial
policies of the firm/company. It is also known as ‘External-Internal ‘equity ratio. Debt equity
ratio- External equities/Internal equities
External equities : Total outside liabilities and Internal equities : Share holder funds or the
tangible net worth. If the ratio is 1 :ie., outsiders’ funds are equal to share holders’ funds it is
considered quite satisfactory
Debt equity ratio can also be calculated as: (i) Debt equity ratio- Total long term debt/Total long
term funds
(ii) Debt equity ratio- Total long term debt/Shareholders’ funds, method, which more popular
(ii) includes the proportion of the long term debt to the share holders’ funds(i.e., tangible net
worth) the ideal ratio is 1.
This ratio indicates the proportion of owners’ stake in the business. The ratio indicates the
extent to which the firm depends upon outsiders for its existence. The ratio tells its owners the
extent to which they can borrow to increase the profits with limited investment.
2) Short term Solvency Ratios:
(i) Current Ratio: The firm’s commitment to meet its short term liabilities. Current
assets/Current liabilities. It includes cash and other assets convertible or meant to be converted
into cash during the operating cycle of business (which is not more than a year) Current
liabilities mean liabilities payable within a years’ time either out of existing current assets or by
creation of new current assets. Book debts outstanding for more than 6 months and loose tools
should not be included in the current assets. Prepaid expenses should be included in the
current assets.
An ideal ratio is 2:1. A very high current ratio is also not desirable, since it means less efficient
use of funds. Current ratio is an index of a firm’s financial stability. A higher current ratio
indicates inadequate employment of funds, while a poor current ratio indicates that the
business is trading beyond its resources (capacity).
(ii) Liquidity Ratio: Known as ‘quick ratio or ‘Acid Test Ratio’. This ratio is worked out by
comparing the liquid assets (ie., assets which are immediately convertible into cash). Prepaid
expenses and stocks are not taken as liquid assets. Liquid assets/Current liabilities and the ideal
ratio is 1. This is also an indicator of short term Solvency of the firm.
A comparison of current ratio to quick ratio indicate the inventory management.
10. Ex:If two concerns have the same current ratio but a different liquidity ratio, it indicates over
stocking by the concern having low liquidity ratio as compared to the concern which has a
higher liquidity ratio
C) Turn Over Ratios:
1) Stock Turnover Ratio: The ratio indicates whether the investments in inventories is
efficiently used or not. This is arrived at by using the cost of goods sold and average inventory
Cost of goods sold during the year/Average inventory .Average inventory is calculated by taking
stock levels of raw materials, work in progress, finished goods at the end of each month adding
them up an dividing by 12.
The inventory turn over ratio signifies the liquidity of inventory management. A high inventory
ratio shows good sales. A low inventory turn over ratio results in the blocking of funds in
inventory, which might result in losses due to inventory becoming obsolete or decreasing in
quality
This ratio is calculated as : inventory x 365/cost of goods sold
2) Debtor’s Turnover Ratio: Debtors are important components of current assets, therefore the
quality of debtors determines a firm’s good liquidity management. The Two important ratios
are (i) Debtor’s turnover ratio and (ii) Debt collection period ratio
(i)Debtor’s turnover ratio = Credit sales/Average account receivables. The term Account
Receivable includes Trade Debtors and Bills Receivable. Credit Sales to Account Receivable
Ratio indicates the firm’s efficiency in collection of receivables.. The higher the ratio , it is
better, as it indicates that debts are being collected more promptly.
(ii) Debt collection Period Ratio: This ratio indicates the extent to which the debts have been
collected in time. It gives an average debt collection period. The ratio is very helpful to the
lenders because it explains to them whether their borrowers are collecting money within a
reasonable time. An increase in the period will result in greater blockage of funds in debtors.
The ratio can be calculated by any of the following methods
(a) Months (or days) in a year/Debtor’s turnover
(b) {Average account receivables(months or days) in a year}/Credit sales for the year
(c) Account receivables/Average monthly or daily credit sales
11. For example, if sales during the year is Rs.365,000 or Rs.1,000 per day, and if the outstanding or
amount receivable is Rs.100,000, the debt collection period is 100 days i.e., Rs 100,000/1000.
Assuming if the firm has allowed a credit term of 60 days, this ratio indicates that the credit
collection needs to be geared up.
Debtor’s collection period measures the quality of debtors. It measures the turnover time i.e.,
quick or slow turnaround in respect of collection of money. A short collection period means
prompt payment by the debtors, and shows the efficiency of fund collection. Whereas, a longer
collection period indicates an inefficient credit collection performance by the firm. The
management should have a flexible policy to have a better result. A restrictive policy may result
in slower sales and would result in low profits. A too liberal policy could result in delay in
collection of dues and affect the liquidity management.
Let us try to understand by some examples:
A firm’s current ratio is 2. If so, identify in which of the following cases the current ratio will
Improve/decline or will have no change.
(i) purchase of fixed assets
(ii) cash collected from Customers
(iii) payment of a current liability
(iv) Bill receivable dishonored
Answers: If the current ratio is 2:1, then our assumption is current assets = Rs1,00,000 and
current liabilities = Rs.50,000
(i) Purchase of fixed assets: On purchase of fixed assets in cash, current assets will decrease
without any change in current liabilities. Hence he transaction will result in decline of current
ratio from 2:1
(ii) Cash collected from customers: Collection of debtors (receivables) would result in the
conversion of one current asset., viz., debtors into another current asset viz., debtors to cash.
Hence amount of current assets and current liabilities remain unchanged the current ratio will
therefore remain 2:1
(iii) Payment of a current liability: On payment of a current liability out of current assets
Working capital will remain unchanged. However current ratio will improve. For example, if out
of above current liabilities Rs20,000 is paid resultant current assets will be Rs.120,,000 and
current liabilities Rs30,000, this will give the current ratio 3:1
12. (iv) Bill receivable dishonored: When a bill receivable is dishonored, if the customer is solvent,
then the amount of bills receivable will get deducted and the amount due from debtors will
increase, There will be no change in the amount of current liabilities Hence on this assumption
the current ratio will remain 2:1
Fund Flow Analysis
Another method of financial analysis is fund flow analysis. The fund flow analysis indicates the
inflow and outflow of cash. This statement is also known as “sources and application of funds”
Sources of funds:
(a) Cash inflow from operations (b) Income from investments (c) sale of investments (d) sale of
fixed assets (e) decrease in working capital (f) increase in liabilities (g) short and long term loans
Application of funds:
(a) Operating expenses (b) Repayment of loans/debentures(c)Payment of dividend
(d)acquisition of fixed assets (e) increase in working capital (f) Securities bought for investments
A review of the balance sheet from the funds flow angle is an important factor in financial
analysis.
Fund flow analysis – Advantages:
: Cash inflow from operations is better a tool to measure whether cash is generated from the
business or otherwise.
: Since funds flow statements are prepared based on estimates, these estimated figures help in
planning and can also be used to monitor the progress.
: It helps in comparison of the pervious year’s budgeted estimates against the actual to find out
whether and to what extent the resources of the firm were used as per the plan.
: From the point of view of the lending banker, the comparison of 3 to 5 years statements
indicate the diversion of funds from working capital to long term application viz., purchase of
fixed assets.
Contingent Liabilities or Off Balance Sheet Items: These items appear outside the balance
sheet as a foot note, hence called as off balance sheet items. While on the date of the balance
sheet these figures may not have any impact, by default there are risks associated with these
items. If,on the date of crystallization,(due date) these non fund based liabilities can be
13. converted into the funds based items, there by can affect the current liabilities. In view of this,
due importance and weight age needs to be given for these off balance sheet items
Some examples are (a) Tax liability on account of cases pending with tribunals (b) Banker’s
letter of credit issued (c) Banker’s guarantees issued (d) Derivatives of banks
Working Capital Finance:
Features: (a) Short term finance (maximum for a period of one year) (b) Called as circulating
capital.(c) Ganted against inventories and/or receivables (d)
Working Capital Finance
Inventory finance Receivables finance
A bank which grants a working capital finance should ensure that the finance is granted to a
borrower, should be, on a time bound basis based on the concept of operating cycle method..
For a manufacturing company, the term working capital means, the requirement of funds for
its day to day operations viz., ensure that sufficient cash is available to meet day to day cash
flow needs.
Cash is needed for
(a) purchase of raw materials, spares (b) payment of wages to employees (c) payment of
administrative expenses including expenses towards water, fuel energy consumption, payment
of statutory dues like taxes, transportation expenses etc.,(d)all other expenses on account of
production, sales, marketing, recoveries etc.,
14. What is an operating cycle: A bank gives working capital finance in the form of fund based
finance against inventories and or receivables. Depending upon the industry the finance can be
granted for a period of 120 days to 180 days. This means, the finance availed by the client
needs to be repaid at the end of the period. This can be shown in a diagram. This is also called
as the working capital cycle
Bills
Cash
receivables
Credit sales Raw materials
Finished Semi finished
goods goods
Each component of working capital has two dimensions TIME and MONEY.
As shown above the main feature of working capital is the cash getting converted into
cash after different stages of the production of goods. Hence the entire process is
reflected in the form of a cycle, which is called as operating cycle or working capital
cycle.
15. The shorter the period of operating cycle, the larger will be the turnover of the funds
invested in various purposes.
The working capital management needs to address the following aspects, before taking a
decision:
(i) How much inventory is to be held (ii) How much cash and bank balance is to be maintained
(iii) How much the company should provide credit to its clients, also what should be the credit
terms? (iv) Similarly to what extent the company can enjoy or avail of the credit facilities and
the credit terms thereof (v) What should be the composition of current assets and liabilities.
What is working capital?
A working capital is the excess of current assets over current liabilities. Cash which is one of the
important component of the current assets, plays a significant role in working capital
management. As far as possible the company should maintain adequate working capital as
much as requited by the company. It should neither be excessive nor inadequate.
Working Capital - Definition
1.According to Guttmann & Dougall -
“Excess of current assets over current liabilities”.
2. According to Park & Gladson -
“The excess of current assets of a business over current items owned to employees and
others”.
Types of Working Capital:
One of the important role of a finance manager is to ensure proper flow of funds. In this
connection arrangement of cash flow through proper working capital management is very
important. Depending upon the business models the working capital can be classified into
different types, as shown in the diagram:
PERMANENT, FIXED OR REGULAR WORKING CAPITAL : The requirement of minimum
cash/funds required to run the firm, company. This is also called as hard core Working Capital.
If this quantity of Working capital is not maintained, it would affect the business.
FLEXIBLE OR TEMPORARY WORKING CAPITAL: During the course of production activities a firm
may need more funds on a temporary basis to meet the short term requirements. The fund
16. requirement may be over and above the overall fixed working capital limits. The lender
(banker) should based on the merits of the case, may grant the temporary working capital.
SEASONAL WORKING CAPITAL OR SPECIAL WORKING CAPITAL : The need for the funds vary
from a company to another and/or from industry to industry. Sometimes, there may be
situations where the firms may need additional working capital on certain special seasons. As
already indicated any additional or temporary requirements for funds needs to decided based
on the merit of the case/s.
Permanent,
Fixed or
Regular
Flexible /
Temporary/
Negative Types of Variable
Working
Capital
Balance Sheet Seasonal
NEGATIVE WORKING CAPITAL : Negative Working Capital is when current liabilities exceed
current assets
17. BALANCE SHEET WORKING CAPITAL: It is that Working Capital which is calculated from the
items appearing in the balance sheet of a firm.
Working Capital – Classification based on concepts:
Net
Working
Gross Working Capital
Working Capital means the funds available for day to day operation of an enterprise. There are
two concepts of Working Capital viz., (a) Gross Working Capital and (b) Net Working Capital
18. (a) Gross Working Capital:
Gross concept of Working Capital is quantitative in nature. It represents the total of all current
assets. It is also known as circulating capital or current capital. The word current assets means,
those assets which can be converted into cash within an accounting period or operating cycle
like;
§ Inventory § Trade debtors § Bills receivables
§ Loans and advances § Investments
§ Cash and Bank Balance § Marketable securities
The gross concept of Working Capital is a going concern concept, because current assets are
necessary for the proper utilization of fixed assets.
(b) Net Working Capital: Net Working Capital represents the excess of current assets over
current liabilities or the portion of current assets which is financed by long term funds..It is
known as net working capital.
Current liabilities are those usually repaid within an accounting year like;
§ Account Payable / sundry creditors § Bills Payable
§ Trade Advances § Outstanding Expenses
§ Short Term Bonus § Bank Overdraft
The net concept of Working Capital shows the financial soundness and liquidity of a firm. This
concept creates the confidence to the creditors about the security of their funds.
Net Working Capital = Current Assets – Current Liabilities
How to calculate the working capital requirements:
ESTIMATING WORKING CAPITAL REQUIREMENT
For this purpose the length of cash to cash cycle is measured:
The duration of the working capital cycle can be mentioned as follows:
O = R+W+F+D-C
O = Duration of operating cycle
19. R = Raw materials storage period
W= Work in progress period
F = Finished goods storage period
D= Debtors collection period
C=Creditors collection period
Gross operating cycle = inventory Conversion period + Debtors conversion Period
Determinants of Working Capital
WC is determined on the basis of certain factors, like :
(i) Nature of Industry (ii) Size of Business (iii) Manufacturing Cycle (iv) Firm’s Production Policy
(v) Terms of purchase & Sales (vi) Volume of Sales (vii) Capital base of the firm (viii) Business
Cycle (ix)Management of Inventory an d receivables (x) changes in economy – inflation (xi)
Government policies (xii) Profit margin
Importance or Advantages of Adequate Working Capital (WC):
Adequate WC helps to
(a) maintain solvency of business (b) create & maintaining goodwill (c) arrange loans from
banks & others on easy and favorable terms (d) avail cash discount/s and hence reduction in
cost of production (e) get regular supply of raw materials (f) adhere to payment schedules for
salary & wages and other dues – taxes (g) negotiate the terms more comfortably (i) manage
the liquidity
Position of excess WC:
Excessive WC - disadvantages
Disadvantages of redundant or excessive WC;
(i) Excessive WC means idle funds which earn no income for the business (ii) Since funds are not
invested business cannot earn a proper rate of return (iii)Improper inventory management
leads to a situation of redundant WC and increases the cost of inventory management (iv)
Similarly excessive debtors & defective receivable management policy may create higher
levels of bad-debts.
20. Thus the factors can reflect the inefficiency of the firm and it does not speak well of the role of
the financial manager
Sources of Working Capital:
Sources of Funds
Long Term Funds Short Term Funds
Equity
Shares
Long Term
Debentures
Borrowings
Long Term
Funds
Retained
Earnings
Hybrid
Financing
21. ♦ Issue of Shares: This is popularly known as “Equity Financing”. The main source of long
term funds is raised through the issuance of different types of equity shares. The share
holders are part owners of the companies depending upon the type of shares.
♦ Debentures: This is called as “Debt Financing”. The investors in the debentures are
creditors of the company. They are entitled for the dividend as return and also charge
over the assets of the company.
♦ Hybrid Financing: The combination of equity and debt is called hybrid financing. The
Finance manager needs to decide the proportion of the equity and debt funds.
♦ Retained Earning: One of the important component of the long term funds is the profits
retained in business. It creates no charge on the future of the firm
♦ Long Term Borrowings: Acceptance of public deposits, debts from financial institutions
and banks, etc., Other sources are security deposits accepted from the customers
(depending on the business models)
Short Term Financing: The short term financing mainly arranged through the working capital
finance, also consist of other sources.
Short Term Financing
Working Capital
Public Deposits Other Credits
Finance
Six Months – Three
Cash Credit Years Commercial Paper
Overdraft Trade Credits Security Deposits
Working Capital Ratios;
Working Capital Ratios;
22. Working
Capital
Ratios
Liquidity Efficiency
Other Ratios
Ratios Ratios
Current Inventory Current Assets Debtors Bad debts to
Turnover Ratio
Ratio Turnover Ratio Turnover Ratio Turnover Ratio sales ratio
Debtor
Quick Ratio collection
period
Creditors
Payment
Period
Working Capital Ratios;
Liquidity Ratios:
Current Ratio = Current Assets/ Current Liability
Quick Ratio = Current Assets – Inventory/ Current Liability – Bank Overdraft
Efficiency Ratios:
Working Capital to sales ratios= Sales/Working Capital
Inventory Turnover ratio = Sales/Inventory
Current assets turnover ratio: Sales/Current Assets
Other Ratios:
Debtors Turnover Ratio = Credit Sales/Debtors
Bad debts to sales ratio = Bad Debts/Sales
Debtor Collection period = Debtors x 365/credit sales
Creditor Payment Period= Creditorsx365/credit purchase
23. Working Capital Turnover Ratio:
Meaning: This ratio establishes a relationship between net sales and working capital.
Objective: The objective of computing this ratio is to determine the efficiency with which the
working capital is utilized.
Components: There are two components of this ratio which are as under:
Net Sales which mean gross sales minus sales returns
Working Capital which means current assets minus current liabilities.
Computation: This ratio is computed by dividing the net sales by the working capital. This ratio
is usually expressed as ‘x’ number of times. Working Capital Turnover Ratio = Net Sales/
Working Capital
Interpretation: It indicates the firm’s ability to generate sales per rupee of working capital. In
general, higher the ratio, the more efficient the management and utilization of working capital
and vice versa.