1. DATA
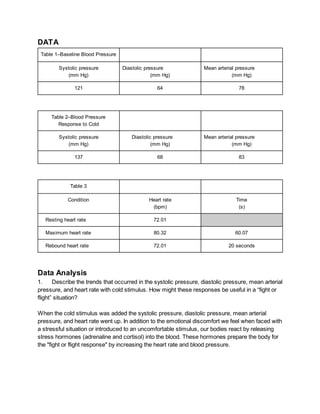
Table 1–Baseline Blood Pressure
Systolic pressure Diastolic pressure Mean arterial pressure
(mm Hg) (mm Hg) (mm Hg)
121 64 78
Table 2–Blood Pressure
Response to Cold
Systolic pressure Diastolic pressure Mean arterial pressure
(mm Hg) (mm Hg) (mm Hg)
137 68 83
Table 3
Condition Heart rate Time
(bpm) (s)
Resting heart rate 72.01
Maximum heart rate 80.32 60.07
Rebound heart rate 72.01 20 seconds
Data Analysis
1. Describe the trends that occurred in the systolic pressure, diastolic pressure, mean arterial
pressure, and heart rate with cold stimulus. How might these responses be useful in a “fight or
flight” situation?
When the cold stimulus was added the systolic pressure, diastolic pressure, mean arterial
pressure, and heart rate went up. In addition to the emotional discomfort we feel when faced with
a stressful situation or introduced to an uncomfortable stimulus, our bodies react by releasing
stress hormones (adrenaline and cortisol) into the blood. These hormones prepare the body for
the "fight or flight response" by increasing the heart rate and blood pressure.
2. 2. As a vital sign, blood pressure is an indicator of general health. A high blood pressure
(140/90 or higher) increases the risk of cardiovascular disease and strokes. Collect the systolic
and diastolic pressures for the class and calculate the average for each. Rate the class average
blood pressure using the follow scale:
Blood Pressure Category
140/90 or higher High
120–139/80–89 Pre-hypertension
119/79 or below Normal
114/69 - on average our class’s blood pressure is normal
3. How long after immersion did your heart rate reach its maximum value? Explain the
physiologic mechanism that led to this change in heart rate.
After about 20 seconds of submerging her foot into the ice water, Anna Lee’s heart rate reached
its maximum value of 80.32 bpm. The physiologic mechanism that led to this change in heart
rate was when her foot was submerged into the water there was decrease circulation to her foot,
which caused stress.
4. Describe the changes in heart rate that occurred after the maximum value. How can you
explain the minimum heart rate value? How would you explain the heart rate variations seen in
the remainder of the experiment?
After Anna Lee’s foot was submerged into the ice water her heart rate reached its maximum at
20 seconds. Her heart rate when resting, before submerging her foot, was 72.01 bpm. This
would explain why 20 seconds after reaching her maximum heart rate it returned to 72.01 bpm.
5. How long after the maximum heart rate did it take to arrive at your rebound heart rate? What
can you say about the relative speed of physiologic response to a stimulus vs. the speed of
mechanisms that are designed to maintain homeostasis?
6. If the heart rate is too slow there is inadequate blood pressure to maintain perfusion to the
brain. This can lead to loss of consciousness (fainting). Keeping in mind the autonomic nervous
system responses that you observed in this experiment, explain the sequence of events that
results in a severely frightened person fainting.