1. Ice Experiment
DATA
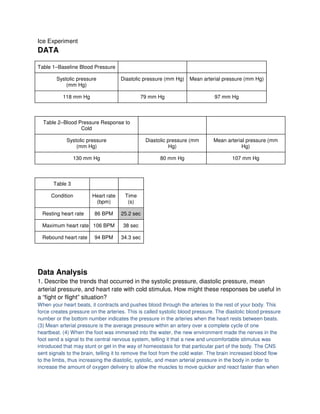
Table 1–Baseline Blood Pressure
Systolic pressure Diastolic pressure (mm Hg) Mean arterial pressure (mm Hg)
(mm Hg)
118 mm Hg 79 mm Hg 97 mm Hg
Table 2–Blood Pressure Response to
Cold
Systolic pressure Diastolic pressure (mm Mean arterial pressure (mm
(mm Hg) Hg) Hg)
130 mm Hg 80 mm Hg 107 mm Hg
Table 3
Condition Heart rate Time
(bpm) (s)
Resting heart rate 86 BPM 25.2 sec
Maximum heart rate 106 BPM 38 sec
Rebound heart rate 94 BPM 34.3 sec
Data Analysis
1. Describe the trends that occurred in the systolic pressure, diastolic pressure, mean
arterial pressure, and heart rate with cold stimulus. How might these responses be useful in
a “fight or flight” situation?
When your heart beats, it contracts and pushes blood through the arteries to the rest of your body. This
force creates pressure on the arteries. This is called systolic blood pressure. The diastolic blood pressure
number or the bottom number indicates the pressure in the arteries when the heart rests between beats.
(3) Mean arterial pressure is the average pressure within an artery over a complete cycle of one
heartbeat. (4) When the foot was immersed into the water, the new environment made the nerves in the
foot send a signal to the central nervous system, telling it that a new and uncomfortable stimulus was
introduced that may stunt or get in the way of homeostasis for that particular part of the body. The CNS
sent signals to the brain, telling it to remove the foot from the cold water. The brain increased blood flow
to the limbs, thus increasing the diastolic, systolic, and mean arterial pressure in the body in order to
increase the amount of oxygen delivery to allow the muscles to move quicker and react faster than when
2. in a homeostatic state. This same reaction occurs during Fight-or-Flight reactions.
2. As a vital sign, blood pressure is an indicator of general health. A high blood pressure
(140/90 or higher) increases the risk of cardiovascular disease and strokes. Collect the
systolic and diastolic pressures for the class and calculate the average for each. Rate the
class average blood pressure using the follow scale:
Blood Pressure Category
140/90 or higher High
120–139/80–89 Pre-hypertension
119/79 or below Normal
Systolic Pressure Diastolic Pressure
Group 1- 131 Group 1- 90
Group 2- 118 Group 2- 79
Group3- 128 Group 3- 86
Group 4- 116 Group 4- 79
Group 5- 119 Group 5- 83
(131+118+128+116+119= 612/5= 122.4) (90+79+86+79+83= 417/5= 83.4)
Average BP is (122/83)
The average diastolic blood pressure for the class is . the average systolic blood pressure
for the class is. Therefor the average blood pressure for the class is / which falls into the
__Pre-Hypertension_ category.
3. How long after immersion did your heart rate reach its maximum value? Explain the
physiologic mechanism that led to this change in heart rate.
Resting heart rate 86 BPM 25.2 sec
Maximum heart rate 106 BPM 38 sec
Rebound heart rate 94 BPM 34.3 sec
Fight-or-Flight reaction is a set of physiological changes, such as increases in heart rate, arterial blood
pressure, and blood glucose, initiated by the sympathetic nervous system to mobilize body systems in
response to stress.(5) It took the heart 38 seconds to reach it maximum number of beats per minute
(BPM). During this time frame, the heart was constantly increasing blood pressure, and mean arterial
3. pressure in order to increase reaction time to remove the foot from the water, as explained in question 1.
This entire reaction happens subconsciously, meaning the mind is not aware of what is occurring.
However, the foot was not removed, which is a conscious reaction by the body. The heart rate increased
by 20 BPM in 38 seconds, so for 30 seconds the subconscious and conscious mind were both at work in
controlling the body’s reaction to the cold stimulus. When the stimulus was removed, it took 34.3 seconds
for the heart to return to a consistent 94 BPM. The slowing of the heart rate was all subconscious.
4. Describe the changes in heart rate that occurred after the maximum value. How can you explain the
minimum heart rate value? How would you explain the heart rate variations seen in the remainder of the
experiment?
-Right after her heart rate reached its maximum value, it drastically decreased to almost the resting heart
rate. The minimum heart rate was when the subject was resting because the heart had not yet needed to
increases its rate to accommodate the body. After she put her foot in the ice water, her body reacted in a
panicked manner and her heart rate shot up to reach the maximum rate. After taking her foot out of the
water, her heart rate began to drop and return to its normal rate, which was only a few BPM more than
the minimum/resting heart rate.
5. How long after the maximum heart rate did it take to arrive at your rebound heart rate? What can you
say about the relative speed of physiologic response to a stimulus vs. the speed of mechanisms that are
designed to maintain homeostasis?
-It took her heart 34.3 seconds to return to the rebound heart rate after reaching its maximum, while it
took her heart 38 seconds to reach its maximum initially. Our data suggests that the heart reacts to a
stimulus slower than it reacts in order to maintain homeostasis, however we expected the heart to react
much faster when the foot was initially submerged in the ice water than when the heart was attempting to
achieve its rebound rate.
6. If the heart rate is too slow there is inadequate blood pressure to maintain perfusion to the brain. This
can lead to loss of consciousness (fainting). Keeping in mind the autonomic nervous system responses
that you observed in this experiment, explain the sequence of events that results in a severely frightened
person fainting.
-Fainting due to being startled or frightened is known as Neurocardiogenic syncope and is caused by a
short-term malfunction of the autonomic nervous system. The body is in such a frightened state that the
ANS begins to lower the blood pressure and heart rate, causing the brain’s supply of oxygen to be
temporarily interrupted. The brain uses fainting as a survival mechanism in response to a drop in oxygen
levels to shut down all the non-vital parts of the body so that resources can be focused on the vital parts
of the body. To do this, the brain increases the breathing rate and heart rate to direct blood to the brain at
the expense of other parts of the body. This combination of hypertension and low blood pressure in the
body can cause the body to shut down, or faint.
4. Exercise experiment
DATA
Table 1–Baseline Blood Pressure
Systolic pressure Diastolic pressure Mean arterial pressure Pulse
(mm Hg) (mm Hg) (mm Hg) (bpm)
111 67 81 89
Table 2–Blood Pressure After Exercise
Systolic pressure Diastolic pressure Mean arterial pressure Pulse
(mm Hg) (mm Hg) (mm Hg) (bpm)
125 85 101 71
Table 3–Heart Rate
Condition
Resting heart rate (bpm) 68
Maximum heart rate (bpm) 108.7
Recovery time (s) 1 min 9 sec
DATA ANALYSIS
1. Describe the trends that occurred in the systolic pressure, diastolic pressure, mean
arterial pressure and pulse with exercise. Assume that the stroke volume increased from 75
mL/beat to 100 mL/beat. Use this information and the change in pulse with exercise to
calculate the change in cardiac output (stroke volume × heart rate) that occurred per
minute.
The systolic, diastolic, and mean arterial pressure increases during running along with the
pulse rate. The systolic, diastolic and mean arterial pressures, and pulse rate return to
normal a little over a minute because our person is in soccer and they have a faster
recovery time than someone who doesn’t exercise or is active. The cardio output before
running in pace is 2225 per minute and 1,775 per minute after running.
2. Pulse pressure is the difference between systolic pressure (peak pressure during active
contraction of the ventricles) and diastolic pressure (the pressure that is maintained even
5. while the left ventricle is relaxing). Describe the change in pulse pressure seen with
exercise. Which component of the blood pressure is most responsible for this change?
The pulse pressure in the beginning of the exercise is less than after running. The left
ventricle ejects blood which causes aorta pressure. The change is caused by the stroke
volume of the ventricle. (6)
3. A change in pulse pressure can be seen in a variety of medical conditions. What would
you expect to happen to the pulse pressure in the following examples?
(a) In atherosclerosis there is a hardening of the arterial walls.
It blocks the flow the blood in which decreases the amount of blood the left ventricle ejects,
which lowers the stroke volume. The stroke volume determines the pulse pressure, so
atherosclerosis hinders the stroke volume. (7)
(b) A damaged aortic valve does not seal properly and allows blood to flow back into the
ventricle during diastole.
The pulse pressure increases because the aortic valve is leaky and the systolic pressure
increases as the diastolic pressure decreases. (7)
4. Normal resting heart rates range from 55−100 beats per minute. What was your/the
subject’s resting heart rate? How much did your/the subject’s heart rate increase above
resting rate with exercise? What percent increase was this?
Our resting heart rate was 68. After/during exercise increased about 40.7 beats. And the
percent increase is 63%.
5. How does your/the subject’s maximum heart rate compare with other students in your
group/class? Is this what you expected?
It is average compared to the other results. Our resting heart rate was slightly higher than
the rest of the class but during exercise, the heart rate increases to supply the body with
enough oxygenated blood.
6. Recovery time has been shown to correlate with degree of physical fitness. How does
your/the subject’s recovery rate compare to that of your classmates? Is this what you
expected?
Our recovery time was shorter compared to our classmates because the person we tested
with was a fit athlete. This is what we expected because a person that exercises daily has a
shorter recovery time than someone that does not exercise often.
7. Congestive heart failure is a condition in which the strength of contraction with each beat
may be significantly reduced. For example, the ventricle may pump only half the usual
volume of blood with each beat. Would you expect a person with congestive heart failure to
6. have a faster or slower heart rate at rest? With exercise?
I would expect that the person’s heart rate would be faster than normal at rest and much
faster when the person is exercising
8. Medications are available which can slow the heart or speed it up. If a patient complains
of feeling poorly and has a heart rate of 120 beats per minute, should you administer a
medicine to slow the rate?
Yes, because the average heart rate is 70-75 beats per minute under resting conditions.
Works Cited
1. Thibodeau, Gary, and Kevin Pattron. Anthony’s Textbook of Anatomy and Physiology. St.
Louis Missouri, Mosby 2003.
7. 2. Nordqvist, Christian. "What Is Fainting (Syncope)? What Causes Fainting?." Medical News
Today. N.p., 17 Mar 2010. Web. 24 Jan 2013
3."Know Your Blood Pressure Numbers." Web MD. WebMD, LLC. Web. 24 Jan 2013.
<http://www.webmd.com/hypertension-high-blood-pressure/guide/diastolic-and-systolic-blood-
pressure-know-your-numbers>.
4 Saunders, . "Mean Arterial Pressure." Dorland's Medical Dictionary For Health Consumers.
Elsevier, Inc., n.d. Web. 25 Jan 2013. <http://medical-dictionary.thefreedictionary.com/mean
arterial pressure>.
5.”Fight-Or-Flight Reaction." The American Heritage® Medical Dictionary. Houghton Mifflin
Company, n.d. Web. 25 Jan 2013. <http://medical-dictionary.thefreedictionary.com/fight-or-flight
reaction>.
6. Klabunde, Richard E.. "Arterial and Aorta Pulse Pressure." Cardiovascular Physiology
Concept. N.p., 29 Mar 2007. Web. 25 Jan 2013. <http://www.cvphysiology.com/Blood
7. . "Patient Education." Cardiovascular Medicine. University of Southern California Keck School
of Medicine. Web. 28 Jan 2013. <http://www.usccardiology.org/pg-