Dec. q4 2013 top 10 negative equity

As a nation, the U.S. currently has 1,188,502 properties currently in some stage of foreclosure according to the recent Realtytrac Foreclosure report for the month of January 2014. The nation’s negative equity share released by Corelogic (a leading property information, analytics and services provider in the United States) for the fourth quarter (most recent report in December 2013) was at 13.3%. CoreLogic’s negative equity analysis showed nearly 6.5 million homes (13.3 % of all residential properties with a mortgage) were still in negative equity in the end of the fourth quarter’s report. CoreLogic’s negative equity for the fourth quarter has been released revealing the top 10 negative equity states. Despite Nevada being the number one state with the highest negative equity share, it has improved by a 1.8% difference since the last report. Negative Equity is something that the nation has been battling with for a long time now, but with the help of the Home Affordable Refinance Program available today many underwater homeowners with high loan-to-values may now be eligible for a refinance on their current mortgage. Helping to reduce to a lower rate, making it more affordable so that they can make their payments on time, assisting in eliminating the rate of delinquency across the nation. However, all good things sometimes must come to an end, all underwater homeowners must act fast since the program will coming to a hault on December 31, 2015.

Recommandé
Contenu connexe
Dernier
Dernier (20)
En vedette
En vedette (20)
Dec. q4 2013 top 10 negative equity
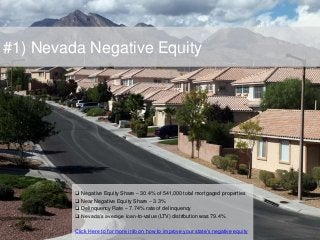
- 1. #1) Nevada Negative Equity Negative Equity Share – 30.4% of 541,000 total mortgaged properties Near Negative Equity Share – 3.3% Delinquency Rate – 7.74% rate of delinquency Nevada’s average loan-to-value (LTV) distribution was 79.4% Click Here to for more info on how to improve your state’s negative equity
- 2. #2) Florida Negative Equity Negative Equity Share – 28.1% of 4,048,000 total mortgaged properties Near Negative Equity Share – 3.6% Delinquency Rate – 9.87% rate of delinquency Florida’s average loan-to-value (LTV) distribution was 71.8% Click Here to for more info on how to improve your state’s negative equity
- 3. #3) Arizona Negative Equity Negative Equity Share – 21.5% of 1,307,000 total mortgaged properties Near Negative Equity Share – 3.7% Delinquency Rate – 3.58% rate of delinquency Arizona’s average loan-to-value (LTV) distribution was 71.1% Click Here to for more info on how to improve your state’s negative equity
- 4. #4) Ohio Negative Equity Negative Equity Share – 19.0% of 2,148,000 total mortgaged properties Near Negative Equity Share – 4.7% Delinquency Rate – 3.42% rate of delinquency Ohio’s average loan-to-value (LTV) distribution was 72.7% Click Here to for more info on how to improve your state’s negative equity
- 5. #5) Illinois Negative Equity Negative Equity Share – 18.7% of 2,218,000 total mortgaged properties Near Negative Equity Share – 4.62% Delinquency Rate – 4.62% rate of delinquency Illinois’ average loan-to-value (LTV) distribution was 69.2% Click Here to for more info on how to improve your state’s negative equity
- 6. #6) Rhode Island Negative Equity Negative Equity Share – 18.3% of 233,000 total mortgaged properties Near Negative Equity Share – 3.3% Delinquency Rate – 4.34% rate of delinquency Rhode Island’s average loan-to-value (LTV) distribution was 62.6% Click Here to for more info on how to improve your state’s negative equity
- 7. #7) Michigan Negative Equity Negative Equity Share – 18.0% of 1,387,000 total mortgaged properties Near Negative Equity Share – 3.7% Delinquency Rate – 2.73% rate of delinquency Michigan’s average loan-to-value (LTV) distribution was 69.2% Click Here to for more info on how to improve your state’s negative equity
- 8. #8) Georgia Negative Equity Negative Equity Share – 18.0% of 1,640,000 total mortgaged properties Near Negative Equity Share – 4.7% Delinquency Rate – 4.55% rate of delinquency Georgia’s average loan-to-value (LTV) distribution was 71.5% Click Here to for more info on how to improve your state’s negative equity
- 9. #9) Mississippi Negative Equity Negative Equity Share – 17.3% of 54,000 total mortgaged properties Near Negative Equity Share – 5.5% Delinquency Rate – 4.08% rate of delinquency Mississippi’s average loan-to-value (LTV) distribution was 73.7% Click Here to for more info on how to improve your state’s negative equity
- 10. #10) Maryland Negative Equity Negative Equity Share – 16.2% of 1,374,000 total mortgaged properties Near Negative Equity Share – 4.0% Delinquency Rate – 5.52% rate of delinquency Maryland’s average loan-to-value (LTV) distribution was 65.2% Click Here to for more info on how to improve your state’s negative equity