1. Name ________________________________________Hour_____ Date________
Scatter Plots and Lines of Best Fit Worksheet
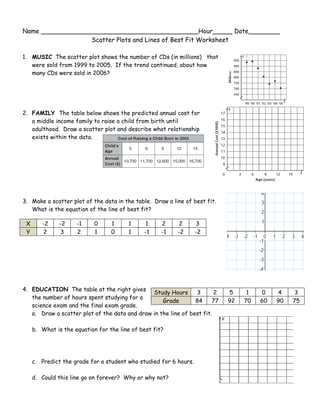
1. MUSIC The scatter plot shows the number of CDs (in millions) that
were sold from 1999 to 2005. If the trend continued, about how
many CDs were sold in 2006?
2. FAMILY The table below shows the predicted annual cost for
a middle income family to raise a child from birth until
adulthood. Draw a scatter plot and describe what relationship
exists within the data.
3. Make a scatter plot of the data in the table. Draw a line of best fit.
What is the equation of the line of best fit?
X -2 -2 -1 0 1 1 1 2 2 3
Y 2 3 2 1 0 1 -1 -1 -2 -2
4. EDUCATION The table at the right gives
Study Hours 3 2 5 1 0 4 3
the number of hours spent studying for a
Grade 84 77 92 70 60 90 75
science exam and the final exam grade.
a. Draw a scatter plot of the data and draw in the line of best fit.
b. What is the equation for the line of best fit?
c. Predict the grade for a student who studied for 6 hours.
d. Could this line go on forever? Why or why not?
2. 5. BASEBALL The scatter plot shows the average price of a major-league baseball ticket from 1997
to 2006.
a. Use the points (2001, 17.60) and (2002, 18.75) to write
the slope-intercept form of equation for the line of fit
shown in the scatter plot.
b. Use your equation to tell the price of a ticket in 2009. Is
this extrapolation or interpolation?
6. DISEASE The table shows the number of cases of Foodborne
Botulism in the United States for the years 2001 to 2005.
a. Draw a scatter plot and determine, what relationship, if
any, exists in the data.
b. Draw a line of fit for the scatter plot, and write the slope-
intercept form of an equation for the line of fit.
7. ZOOS The table shows the average and maximum longevity of
various animals in captivity.
a. Draw a scatter plot and determine, what relationship, if any,
exists in the data.
b. Draw a line of fit for the scatter plot, and write the slope-
intercept form of an equation for the line of fit.
c. Predict the maximum longevity for an animal with an average
longevity of 33 years. Is this an example of Extrapolation or
Interpolation?