1. FINANCIAL TIMES WEDNESDAY DECEMBER 9 2009 ★ 13
Analysis
The G2: the key to CO2
ChinaUS
5,880m
Share of global
emissions
19.9%
6,414m
Share of
global
emissions
15.9%
Europe
(OECD)
4,405m
4,519m
India
1,311m
2,115m
Russia
1,729m
1,978m
Africa
1,008m
1,409m
Japan
1,227m
1,157m
Canada
614m
731m
Brazil
390m
682m
South
Korea
536m
680m
Mexico
416m
557m
530m
Passenger cars per 1,000 people
2005
Domestic and international civil aviation
2004 (passenger km)
2007
CO2 emission intensity in iron and steel production
2007 (tonnes of CO2 equivalent per tonne of output)
World share of CO2 emissions from iron and steel sector
2007
Electricity generation from coal (%)
CO2 emissions per kWh of electricity and heat output
2007 (grammes of CO2 per kilowatt hour)
Estimated emissions created by manufacturing traded goods
US China
World share of CO2 emissions
from road transport
2007
Electricity generation from renewable energy (%)
Energy demand per capita (tonne of oil equivalent)
461 15
5.7%31.6%
1,160bn 176bn
8.5%57.2%
2007 (tonnes of CO2)
39m
2.5%
549
1.4bn
758
Radical changes required
CO2 emissions (tonnes)
6,319m
Share of global
emissions
21.4%
2005
7.3bn
tonnes of
CO2 equivalent of all
greenhouse gases
(including CO2)
2005
7.1bn
tonnes of
CO2 equivalent of all
greenhouse gases
(including CO2)
0.96
54.2%
2.51
Australia &
New Zealand
455m
China’s emissions created by manufacturing goods exported to the USUS emissions created by manufacturing
goods exported to China
Sources: Energy Information Administration; Ecofys; IEA/OECD; UN; IMF; World Bank; Yungfeng Y and Laike Y,‘CO2 Emissions Embodied in China-US Trade’, Chinese Journal of Population, Resources and Environment (2009, vol 3) Graphic: Natalie Croker
All references to CO2 emissions are energy related
The US pledge
China’s pledge
World share of CO2 emissions from domestic aviation
2007
Top bar in each chart
2030 IEA
‘business-as-usual’
forecast
US
China
US
China
US
China
2030 EIA
‘business-as-usual’
forecast
20072007
Key
World total
Key
49%
7.6
5.7 2.0
1.5
9%
81%
15%
50% 75%
16% 33%
46%
18%
2.66.5
23%
26%
To cut greenhouse gases by 17%
of its 2005 levels by 2020
With 8% annual
growth in GDP
2020
14.2bn
tonnes of
CO2 equivalent
2020
5.9bn
tonnes of
CO2 equivalent
Reduction of emission intensity
(greenhouse gas emissions per
unit of gross domestic product)
by 40-45% in 2020 compared
with 2005 levels*
11,730m
Share of global emissions
29.0%
* The chart shows GHG emissions forecasts
assuming a 45% cut in emissions intensity; International
Monetary Fund growth forecasts for 2009-2011; and 8%
annual average GDP growth for 2011-2020
Rest of
the world
World total
5,223m
29,513m
7,883m
40,385m
2007
2030
forecast
Big hitters, big emitters
* Curbs keep atmospheric concentrations
of greenhouse gases at 450 parts per million, the
level believed consistent with a global average
temperature increase of about 2˚C
2030 IEA forecast
if emissions
curbs in place*
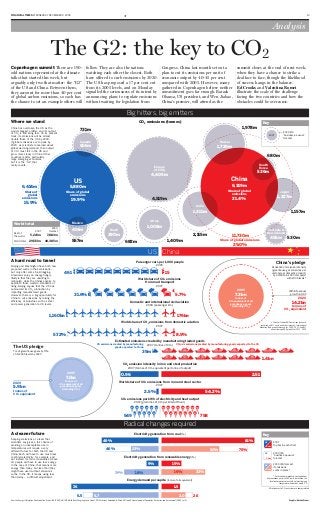
China has overtaken the US as the
world’s biggest emitter, and its output
of CO2 is still rising fast. On its present
track, its emissions will be almost
double those of the US by 2030.
If global emissions are to peak by
2020, as scientists concerned about
global warming demand, then output
of CO2 must fall in the US and
grow more slowly in China. Other
countries matter, particularly
large emerging economies,
but it is the “G2” that
really counts.
Where we stand
Beijing and Washington have both now
proposed curbs in their emissions –
but only after some footdragging.
Americans enjoy an energyhungry
lifestyle that they are unwilling to
relinquish; while the Chinese aspire to
approach those western standards of
living. Beijing argues that the US has
outsourced its CO2 production by
importing manufactured goods.
However, there is a big opportunity for
China to cut emissions by raising the
efficiency of industries such as steel
and power generation to US levels.
A hard road to travel
Copenhagen summit There are 190
odd nations represented at the climate
talks that started this week, but
arguably only two that matter: the “G2”
of the US and China. Between them,
they account for more than 40 per cent
of global carbon emissions, so each has
the chance to set an example others will
follow. They are also the nations
watching each other the closest. Both
have offered to curb emissions by 2020.
The US has proposed a 17 per cent cut
from its 2005 levels, and on Monday
signalled the seriousness of its intent by
announcing plans to regulate emissions
without waiting for legislation from
Congress. China last month set out a
plan to cut its emissions per unit of
economic output by 4045 per cent
compared with 2005. However, many
gathered in Copenhagen believe neither
commitment goes far enough. Barack
Obama, US president, and Wen Jiabao,
China’s premier, will attend as the
summit closes at the end of next week,
when they have a chance to strike a
deal face to face, though the likelihood
of success hangs in the balance.
Ed Crooks and Valentina Romei
illustrate the scale of the challenge
facing the two countries and how the
obstacles could be overcome.
Keeping emissions at a level that
scientists say gives a fair chance of
avoiding an unacceptable rise in
temperatures will require a very
different future for both the US and
China. Each will have to use much less
coalfired electricity, for example, and
opt instead for more renewables. Above
all, people will have to use less energy.
In the case of China, that means more
energy than today, but less than they
might have used without emissions
curbs. In the US, it means using less
than today – a difficult adjustment.
A cleaner future