SlideShare une entreprise Scribd logo
1  sur  7
Télécharger pour lire hors ligne
Investment Market Update
International investment in Europe
Rise of non-European capital
DTZ Research
11 March 2014
Contents
Regional trends 2
Sources of Capital 3
Property type 4
Investor Type 5
Target Geography 5
Outlook 5
Authors
Karl Kelly
Analyst
+44 (0)20 2396 2314
karl.kelly@dtz.com
Nigel Almond
Head of Strategy Research
+44 (0)20 3296 2328
nigel.almond@dtz.com
Contacts
Magali Marton
Head of CEMEA Research
+33 (0)1 4964 4954
magali.marton@dtz.com
Hans Vrensen
Global Head of Research
+44 (0)20 3296 2159
hans.vrensen@dtz.com
 Investment into Europe from non-European investors totalled EUR36bn in
2013, representing a record 26% share of total volumes. However, in absolute
terms it was still below the EUR46bn recorded in 2007.
 Non-European investors have been the only investor group who have
consistently been net investors in each of the last five years highlighting their
importance. Domestic and Europeans were net sellers over this period.
 North American and Global funds remain major investors but they were also
significant sellers. Asian and Middle Eastern funds, from Singapore, China,
Kuwait and UAE, were the main investors into Europe during 2013.
 Offices remain the most popular sector for non-European investors, with EUR
60.1bn being invested since 2009. The UK accounts for 67% (EUR40.1bn) of this
activity, led by significant activity in London.
 London remains the favourite city for non-European investors, accounting for
40% of total non-European investment since 2009. This is followed by Paris at
5%.
 DTZ Research projects non-European investors to increase their investment
into Europe over the next two years, both taking total volumes to 2007 levels
and increasing their overall share towards 30%.
Figure 1
European investment by capital source 2004-2015, EUR bn
0%
5%
10%
15%
20%
25%
30%
0
50
100
150
200
250
Domestic European
Non-European % Non-European
Source: DTZ Research
International investment in Europe
www.dtz.com Investment Market Update 2
Regional trends
Growth in non-European investment
Total investment in European commercial real estate
reached EUR139bn in 2013, more than double 2009’s low of
EUR62bn. Investor confidence has once again returned to
the region, as prospects about the economy are improving
and political uncertainty over its future is declining.
Investment volumes are being driven by flows of capital
from other parts of the world. Non-European investment
totalled EUR36bn in 2013, a 27% increase on 2012, pushing
non-European investment to a record 26% share of total
investment. However, in absolute terms these flows are still
below the peak volume of EUR46.1bn seen in 2007 (Figure
2).
Non-European’s consistent net buyers in Europe
Even on a net basis, non European capital has been the only
source to consistently be net positive over the last five
years. Total net investment by non-European investors was
EUR42bn over 2009-13. Both domestic and European
investors were net sellers over the same period. Domestic
investors were net sellers in every year over the period
(Figure 3).
Asian and Middle Eastern capital dominating
Since 2009, net investment into Europe has been
dominated by investors from Asia Pacific. Investors from the
region maintain the biggest net position of EUR14.7bn.
Middle Eastern investors have been the second largest net
contributors since 2009, with net investment of EUR10.6bn.
North American investors were the next biggest net players
at EUR10.5bn although this involved far higher levels of
trading (Figure 4). Global investment managers have been
the most active in the market leading to broadly neutral net
investment.
Figure 2
Non-European investment into Europe, EUR bn
22% 20%
13%
26%
0%
5%
10%
15%
20%
25%
30%
0
10
20
30
40
50
Non-European
Non-European as % of total European investment
Source: DTZ Research
Figure 3
Net investment by source of capital 2009-13, EUR bn
-20
-10
0
10
20
2009 2010 2011 2012 2013
Domestic European Non-European
Source: DTZ Research
Figure 4
Net investment by source of capital 2009-13, EUR bn
-30
-20
-10
0
10
20
30
Asia Pacific Middle East North
America
International Africa
Buy Sell Net
Source: DTZ Research
International investment in Europe
www.dtz.com Investment Market Update 3
Sources of Capital
Asian capital coming from a diverse range of sources
Asian investment has experienced consistent growth over
the last five years increasing from EUR2.2bn in 2009, to
EUR8.8bn in 2013. This increase has corresponded with a
growing diversity of investors.
Malaysian’s have been the most active, with volumes of
EUR4.6bn invested since 2009. This figure is mainly
dominated by institutional investors investing in the London
office market. South Korean’s has been the second most
active investor by value, with EUR4.2bn invested since
2009. The volume of activity from these markets has
declined with growing activity from China and Singapore.
In 2013 investment from Singapore totalled EUR2.6bn, 30%
of Asian investment and dominated by GIC’s acquisition of
EUR2bn (Figure 5). Chinese investors have also been
increasingly active with investment of EUR3.1bn since 2009
reflecting mainly investment by the country’s sovereign
wealth fund and institutions of EUR0.97bn and EUR0.6bn
respectively. This excludes increasing activity from
developers towards residential and hotels.
Mid East investment dominated by sovereign wealth funds
Middle Eastern investors have also seen consistent growth
over the past 5 years, with greater diversity been seen in
terms of sources of capital. Overall volumes were EUR5.8bn
in 2013, up from EUR1.6bn in 2009.
Combined, flows from Kuwait, Israel, Qatar and the UAE
totalled EUR11.1bn between 2009 and 2013. Qatari
investment saw a significant increase in 2012, mostly
attributed to EUR3.2bn of investment from their sovereign
fund. Investment from Kuwait and UAE increased
significantly in 2013 representing 66% of Middle Eastern
volumes. This mainly consisted of investment from each
country’s Sovereign Wealth fund of EUR2.9bn and
EUR1.6bn respectively (Figure 6).
US volumes returning to pre-crisis levels
North American investors have been consistently active
across Europe both before and after the global financial
crisis. Both US and Canadian investors have been active net
investors through 2001 and 2012, but in 2013, both
increased the level of sales reducing their overall net
investment to EUR1.5bn (Figure 7). Institutions account for
almost half of Canadian volumes with EUR3.7bn invested
since 2011. Investment from the US is dominated by Private
Property Vehicles accounting for 67% (EUR12.3bn) of
purchases from the country since 2011.
Figure 5
Investment activity by key Asian sources
0%
25%
50%
75%
100%
2009 2010 2011 2012 2013
Singapore China South Korea Malaysia Australia Rest ofAsia
Source: DTZ Research
Figure 6
Investment activity by key Middle Eastern sources
0%
25%
50%
75%
100%
2009 2010 2011 2012 2013
Kuwait UAE Qatar Israel Rest ofMiddle East
Source: DTZ Research
Figure 7
Net investment by North American sources, EUR bn
-8.0
-4.0
0.0
4.0
8.0
2011 2012 2013 2011 2012 2013
Buy Sell Net
US Canada
Source: DTZ Research
International investment in Europe
www.dtz.com Investment Market Update 4
Property type
Offices the preferred choice
Offices remain the most popular sector for non-European
investors with EUR 60bn being invested since 2009. This
accounts for 57% of total non-European investment over
the 2009-2013 period. Over two-thirds (EUR40bn) of this
investment was in the UK, notably Central London. Activity
for the office sector throughout Europe peaked in 2013,
when it made up 60% of all property acquisitions (Figure 8).
The retail sector is the second most popular sector, with
EUR 24bn being invested since 2009. This is driven by
shopping centre investment which represented 56%
(EUR13.5bn) of retail volumes, predominantly in the UK and
Germany.
Mixed-use assets continue to attract investors’ interest,
with EUR9.6bn invested in them seen since 2009. The UK
attracted 43% (EUR4.1bn) of this volume followed by
Germany which accounted for 25% (EUR2.4bn).
North America maintains diversified investment in sectors
When comparing investment activity by source some
different patterns emerge. North American investors have
typically split 70% of their investment across the office and
retail sectors (Figure 9). This is in contrast to Asian and
Middle Eastern investors who have been more focussed
towards the office sector, which has represented the bulk of
their commercial investment. New pools of Asian capital are
also now focussed on mixed-use or residential led schemes.
Non-European’s have appetite for larger lot sizes
Since 2004, non-European investment has focussed on lot-
sizes which are generally larger than that of domestic and
European investment (Figure 10). This is because non-
European investors like to be able to deploy their capital in
a quick and efficient process. It is easier to execute this by
investing in larger lots. Many overseas investors also seek to
invest in ‘trophy’ assets which are typically larger lots. Non-
European investors account for 49% of investment in lot-
sizes bigger than EUR1bn.
Figure 8
Non-European investment by property type
0%
20%
40%
60%
80%
100%
2009 2010 2011 2012 2013
Office Retail Industrial Mixed Use Other
Source: DTZ Research
Figure 9
Investment by property type and source of capital 2009-13
0%
20%
40%
60%
80%
100%
Middle East APAC North America
Office Retail Industrial Mixed Use Other
Source: DTZ Research
Figure 10
Average lot size by capital source, EUR m
0
20
40
60
80
100
120
2004 2005 2006 2007 2008 2009 2010 2011 2012 2013
Domestic European Non-European
Source: DTZ Research
International investment in Europe
www.dtz.com Investment Market Update 5
Investor Type
Private Property Vehicles dominating volumes
Since the financial crisis, unlisted funds have been the most
active investors on both the buy and sell side, reflecting the
high proportion of global fund managers (Figure11). Since
2009, non-European sovereign wealth funds have invested
EUR12.6bn in Europe, of which more than half EUR7.5bn
was invested in 2013, representing close to a third of non-
European investment in 2013. Over the last five years
sovereign wealth funds invested a net EUR7.5bn and
institutions added a further EUR3.9bn of net investment.
Target Geography
Asian capital to play central role in coming years
Over 80% of non-European investment has been focussed
on the core three European markets of the UK, Germany
and France (Figure 12). The UK attracts the largest amount
of non-European investment within Europe, accounting for
58% of the total since 2009. London makes up 66% of this
figure with investment of EUR40bn mainly dominated by
private property vehicles and sovereign wealth funds.
Germany accounts for 15% of non-European investment
with volumes of EUR15.2bn. Investment within Germany is
much more diversified with the core five cities making up
65% of volumes. France is the third largest recipient of non-
European investment accounting for 9% of volumes. This
figure, similar to the UK, is dominated by the capital with
over half of volumes going to Paris since 2009.
Outlook
New investors attracted by pricing and liquidity
We continue to see new pools of investment capital
focussed on Europe from outside of the region. This is
partially driven by the build-up of foreign reserves in
emerging markets and the diversification of their asset
base. As a result, we project that over the next two years,
their share of investment will increase further towards 30%
(Figure 13), taking absolute investment towards their peak
level of EUR46bn by 2015. This is a testament to the relative
attractiveness of pricing and the good liquidity which new
investors can find across the region’s diverse commercial
property markets at this time.
Figure 11
Net investment by investor type 2009-2013, EUR bn
-40
-20
0
20
40
60
Unlisted Funds Sovereign Wealth
Fund
Institution
Buy Sell Net
Source: DTZ Research
Figure 12
Destination of non-European investment 2009-2013
58%
15%
9%
5%
13%
UK
Germany
France
Spain
Rest ofEurope
Source: DTZ Research
Figure 13
European investment by capital source 2004-2015, EUR bn
0%
5%
10%
15%
20%
25%
30%
0
50
100
150
200
250
Domestic European
Non-European % Non-European
Source: DTZ Research
International investment in Europe
www.dtz.com Investment Market Update 6
Other DTZ Research Reports
Other research reports can be downloaded from www.dtz.com/research. These include:
Occupier Perspective
Updates on occupational markets from an occupier
perspective, with commentary, analysis, charts and data.
Global Occupancy Costs Offices
Global Occupancy Costs Logistics
Obligations of Occupation Americas
Obligations of Occupation Asia Pacific
Obligations of Occupation EMEA
Global Office Review
Regional Headquarters Asia Pacific- November 2013
Sweden - Computer Games developers – November 2013
India Office Demand and Trends Survey 2012-13
Poland Banking Sector - January 2013
Property Times
Regular updates on occupational markets from a landlord
perspective, with commentary, charts, data and forecasts.
Coverage includes Asia Pacific, Bangkok, Beijing, Berlin,
Brisbane, Bristol, Brussels, Budapest, Central London,
Chengdu, Chongqing, Dalian, Edinburgh, Europe, Frankfurt,
Glasgow, Guangzhou, Hangzhou, Ho Chi Minh City, Hong
Kong, India, Jakarta, Japan, Kuala Lumpur, Luxembourg,
Madrid, Manchester, Melbourne, Milan, Nanjing,
Newcastle, Paris, Poland, Prague, Qingdao, Rome, Seoul,
Shanghai, Shenyang, Shenzhen, Singapore, Stockholm,
Sydney, Taipei, Tianjin, Ukraine, Warsaw, Wuhan, Xian.
Investment Market Update
Regular updates on investment market activity, with
commentary, significant deals, charts, data and forecasts.
Coverage includes Asia Pacific, Australia, Belgium, Czech
Republic, Europe, France, Germany, Italy, Japan, Mainland
China, South East Asia, Spain, Sweden, UK.
Money into Property
For more than 35 years, this has been DTZ's flagship
research report, analysing invested stock and capital flows
into real estate markets across the world. It measures the
development and structure of the global investment
market. Available for Global, Asia Pacific, Europe, North
America and UK.
Foresight
Quarterly commentary, analysis and insight into our in-
house data forecasts, including the DTZ Fair Value Index™.
Available for Global, Asia Pacific, Europe and UK. In
addition we publish an annual outlook report.
Insight
Thematic, ad hoc, topical and thought leading reports on
areas and issues of specific interest and relevance to real
estate markets.
China Investment Market Sentiment Survey January 2014
China The Technology Sector January 2014
Insight Czech Republic Green buildings December 2013
Net Debt Funding Gap - November 2013
UK secondary market pricing - October 2013
German Open Ended Funds - October 2013
Great Wall of Money - October 2013
Quantitative Easing - UK Regions - September 2013
Singapore Government Land Sales - September 2013
UK lending market -September 2013
Quantitative Easing - August 2013
Property Investment Guide Asia Pacific 2013-2014
DTZ Research Data Services
For more detailed data and information, the
following are available for subscription. Please
contact graham.bruty@dtz.com for more
information.
 Property Market Indicators
Time series of commercial and industrial
market data in Asia Pacific and Europe.
 Real Estate Forecasts, including the DTZ
Fair Value Index
TM
Five-year rolling forecasts of commercial
and industrial markets in Asia Pacific,
Europe and the USA.
 Investment Transaction Database
Aggregated overview of investment activity
in Asia Pacific and Europe.
 Money into Property
DTZ’s flagship research product for over 35
years providing capital markets data
covering capital flows, size, structure,
ownership, developments and trends, and
findings of annual investor and lender
intention surveys.
www.dtz.com Investment Market Update 7
DTZ Research
DTZ Research Contacts
Global Head of Research
Hans Vrensen
Phone: +44 (0)20 3296 2159
Email: hans.vrensen@dtz.com
Global Head of Forecasting
Fergus Hicks
Phone: +44 (0)20 3296 2307
Email: fergus.hicks@dtz.com
Head of Strategy Research
Nigel Almond
Phone: +44 (0)20 3296 2328
Email: nigel.almond@dtz.com
Head of Americas Research
John Wickes
Phone: +1 312 424 8087
Email: john.wickes@dtz.com
Head of UK Research
Richard Yorke
Phone: +44 (0)20 3296 2319
Email: richard.yorke@dtz.com
Head of CEMEA Research
Magali Marton
Phone: +33 1 49 64 49 54
Email: magali.marton@dtz.com
Head of North Asia Research
Andrew Ness
Phone: +852 2507 0779
Email: andrew.ness@dtz.com
Head of South East Asia and Australia New Zealand Research
Dominic Brown
Phone: +61 (0)2 8243 9999
Email: dominic.brown@dtz.com
DTZ Business Contacts
Chief Executive, EMEA
John Forrester
Phone: +44 (0)20 3296 2002
Email: john.forrester@dtz.com
Head of International Investment, EMEA
Paul Boursican
Phone: +44 (0)20 3296 2019
Email: paul.boursican@dtz.com
International Investment, EMEA
Mark Roberts
Phone: +44 (0)20 3296 2149
Email: mark.roberts@dtz.com
DISCLAIMER
This report should not be relied upon as a basis for entering into transactions without seeking specific,
qualified, professional advice. Whilst facts have been rigorously checked, DTZ can take no
responsibility for any damage or loss suffered as a result of any inadvertent inaccuracy within this
report. Information contained herein should not, in whole or part, be published, reproduced or
referred to without prior approval. Any such reproduction should be credited to DTZ.
© DTZ March 2014

Contenu connexe

Dernier

9990771857 Call Girls in Dwarka Sector 6 Delhi (Call Girls) Delhi
9990771857 Call Girls in Dwarka Sector 6 Delhi (Call Girls) Delhi9990771857 Call Girls in Dwarka Sector 6 Delhi (Call Girls) Delhi
9990771857 Call Girls in Dwarka Sector 6 Delhi (Call Girls) Delhidelhimodel235
 
Premium Villa Projects in Sarjapur Road Bengaluru
Premium Villa Projects in Sarjapur Road BengaluruPremium Villa Projects in Sarjapur Road Bengaluru
Premium Villa Projects in Sarjapur Road BengaluruShivaSeo3
 
SVN Live 5.6.24 Weekly Property Broadcast
SVN Live 5.6.24 Weekly Property BroadcastSVN Live 5.6.24 Weekly Property Broadcast
SVN Live 5.6.24 Weekly Property BroadcastSVN International Corp.
 
Mahindra Happinest Tathawade Pune Brochure.pdf
Mahindra Happinest Tathawade Pune Brochure.pdfMahindra Happinest Tathawade Pune Brochure.pdf
Mahindra Happinest Tathawade Pune Brochure.pdfBabyrudram
 
BDSM⚡Call Girls in Sector 57 Noida Escorts >༒8448380779 Escort Service
BDSM⚡Call Girls in Sector 57 Noida Escorts >༒8448380779 Escort ServiceBDSM⚡Call Girls in Sector 57 Noida Escorts >༒8448380779 Escort Service
BDSM⚡Call Girls in Sector 57 Noida Escorts >༒8448380779 Escort ServiceDelhi Call girls
 
M3M The Line Brochure - Premium Investment Opportunity for Commercial Ventures
M3M The Line Brochure - Premium Investment Opportunity for Commercial VenturesM3M The Line Brochure - Premium Investment Opportunity for Commercial Ventures
M3M The Line Brochure - Premium Investment Opportunity for Commercial Venturessheltercareglobal
 
Girls in Kalyanpuri }Delhi↫8447779280↬Escort Service. In Delhi NCR
Girls in Kalyanpuri }Delhi↫8447779280↬Escort Service. In Delhi NCRGirls in Kalyanpuri }Delhi↫8447779280↬Escort Service. In Delhi NCR
Girls in Kalyanpuri }Delhi↫8447779280↬Escort Service. In Delhi NCRasmaqueen5
 
9990771857 Call Girls Dwarka Sector 9 Delhi (Call Girls ) Delhi
9990771857 Call Girls Dwarka Sector 9 Delhi (Call Girls ) Delhi9990771857 Call Girls Dwarka Sector 9 Delhi (Call Girls ) Delhi
9990771857 Call Girls Dwarka Sector 9 Delhi (Call Girls ) Delhidelhimodel235
 
Majestique Viman Nagar Pune Brochure.pdf
Majestique Viman Nagar Pune Brochure.pdfMajestique Viman Nagar Pune Brochure.pdf
Majestique Viman Nagar Pune Brochure.pdfBabyrudram
 
Call girls in new Ashok NagarDelhi꧁ 8447779280꧂ Escort Service Women Seeking ...
Call girls in new Ashok NagarDelhi꧁ 8447779280꧂ Escort Service Women Seeking ...Call girls in new Ashok NagarDelhi꧁ 8447779280꧂ Escort Service Women Seeking ...
Call girls in new Ashok NagarDelhi꧁ 8447779280꧂ Escort Service Women Seeking ...asmaqueen5
 
Call Girls in shastri nagar Delhi 8264348440 ✅ call girls ❤️
Call Girls in shastri nagar Delhi 8264348440 ✅ call girls ❤️Call Girls in shastri nagar Delhi 8264348440 ✅ call girls ❤️
Call Girls in shastri nagar Delhi 8264348440 ✅ call girls ❤️soniya singh
 
9990771857 Call Girls in Dwarka Sector 3 Delhi (Call Girls) Delhi
9990771857 Call Girls in Dwarka Sector 3 Delhi (Call Girls) Delhi9990771857 Call Girls in Dwarka Sector 3 Delhi (Call Girls) Delhi
9990771857 Call Girls in Dwarka Sector 3 Delhi (Call Girls) Delhidelhimodel235
 
call girls in ganesh nagar Delhi 8264348440 ✅ call girls ❤️
call girls in ganesh nagar Delhi 8264348440 ✅ call girls ❤️call girls in ganesh nagar Delhi 8264348440 ✅ call girls ❤️
call girls in ganesh nagar Delhi 8264348440 ✅ call girls ❤️soniya singh
 
Shapoorji Pallonji Joyville Vista Pune | Spend Your Family Time Together
Shapoorji Pallonji Joyville Vista Pune | Spend Your Family Time TogetherShapoorji Pallonji Joyville Vista Pune | Spend Your Family Time Together
Shapoorji Pallonji Joyville Vista Pune | Spend Your Family Time Togetheraidasheikh47
 
9990771857 Call Girls in Dwarka Sector 7 Delhi (Call Girls) Delhi
9990771857 Call Girls in Dwarka Sector 7 Delhi (Call Girls) Delhi9990771857 Call Girls in Dwarka Sector 7 Delhi (Call Girls) Delhi
9990771857 Call Girls in Dwarka Sector 7 Delhi (Call Girls) Delhidelhimodel235
 
2k Shot Call girls Karol Bagh Delhi 9205541914
2k Shot Call girls Karol Bagh Delhi 92055419142k Shot Call girls Karol Bagh Delhi 9205541914
2k Shot Call girls Karol Bagh Delhi 9205541914Delhi Call girls
 
9990771857 Call Girls in Dwarka Sector 137 Noida (Call Girls) Delhi
9990771857 Call Girls in Dwarka Sector 137 Noida (Call Girls) Delhi9990771857 Call Girls in Dwarka Sector 137 Noida (Call Girls) Delhi
9990771857 Call Girls in Dwarka Sector 137 Noida (Call Girls) Delhidelhimodel235
 
3D Architectural Rendering Company by Panoram CGI
3D Architectural Rendering Company by Panoram CGI3D Architectural Rendering Company by Panoram CGI
3D Architectural Rendering Company by Panoram CGIPanoram CGI
 
Best Deal Virtual Space in Satya The Hive Tata Zudio 750 Sqft 1.89 Cr All inc...
Best Deal Virtual Space in Satya The Hive Tata Zudio 750 Sqft 1.89 Cr All inc...Best Deal Virtual Space in Satya The Hive Tata Zudio 750 Sqft 1.89 Cr All inc...
Best Deal Virtual Space in Satya The Hive Tata Zudio 750 Sqft 1.89 Cr All inc...ApartmentWala1
 
M3M 129 E Brochure Noida Expressway, Sector 129, Noida
M3M 129 E Brochure Noida Expressway, Sector 129, NoidaM3M 129 E Brochure Noida Expressway, Sector 129, Noida
M3M 129 E Brochure Noida Expressway, Sector 129, Noidasarak0han45400
 

Dernier (20)

9990771857 Call Girls in Dwarka Sector 6 Delhi (Call Girls) Delhi
9990771857 Call Girls in Dwarka Sector 6 Delhi (Call Girls) Delhi9990771857 Call Girls in Dwarka Sector 6 Delhi (Call Girls) Delhi
9990771857 Call Girls in Dwarka Sector 6 Delhi (Call Girls) Delhi
 
Premium Villa Projects in Sarjapur Road Bengaluru
Premium Villa Projects in Sarjapur Road BengaluruPremium Villa Projects in Sarjapur Road Bengaluru
Premium Villa Projects in Sarjapur Road Bengaluru
 
SVN Live 5.6.24 Weekly Property Broadcast
SVN Live 5.6.24 Weekly Property BroadcastSVN Live 5.6.24 Weekly Property Broadcast
SVN Live 5.6.24 Weekly Property Broadcast
 
Mahindra Happinest Tathawade Pune Brochure.pdf
Mahindra Happinest Tathawade Pune Brochure.pdfMahindra Happinest Tathawade Pune Brochure.pdf
Mahindra Happinest Tathawade Pune Brochure.pdf
 
BDSM⚡Call Girls in Sector 57 Noida Escorts >༒8448380779 Escort Service
BDSM⚡Call Girls in Sector 57 Noida Escorts >༒8448380779 Escort ServiceBDSM⚡Call Girls in Sector 57 Noida Escorts >༒8448380779 Escort Service
BDSM⚡Call Girls in Sector 57 Noida Escorts >༒8448380779 Escort Service
 
M3M The Line Brochure - Premium Investment Opportunity for Commercial Ventures
M3M The Line Brochure - Premium Investment Opportunity for Commercial VenturesM3M The Line Brochure - Premium Investment Opportunity for Commercial Ventures
M3M The Line Brochure - Premium Investment Opportunity for Commercial Ventures
 
Girls in Kalyanpuri }Delhi↫8447779280↬Escort Service. In Delhi NCR
Girls in Kalyanpuri }Delhi↫8447779280↬Escort Service. In Delhi NCRGirls in Kalyanpuri }Delhi↫8447779280↬Escort Service. In Delhi NCR
Girls in Kalyanpuri }Delhi↫8447779280↬Escort Service. In Delhi NCR
 
9990771857 Call Girls Dwarka Sector 9 Delhi (Call Girls ) Delhi
9990771857 Call Girls Dwarka Sector 9 Delhi (Call Girls ) Delhi9990771857 Call Girls Dwarka Sector 9 Delhi (Call Girls ) Delhi
9990771857 Call Girls Dwarka Sector 9 Delhi (Call Girls ) Delhi
 
Majestique Viman Nagar Pune Brochure.pdf
Majestique Viman Nagar Pune Brochure.pdfMajestique Viman Nagar Pune Brochure.pdf
Majestique Viman Nagar Pune Brochure.pdf
 
Call girls in new Ashok NagarDelhi꧁ 8447779280꧂ Escort Service Women Seeking ...
Call girls in new Ashok NagarDelhi꧁ 8447779280꧂ Escort Service Women Seeking ...Call girls in new Ashok NagarDelhi꧁ 8447779280꧂ Escort Service Women Seeking ...
Call girls in new Ashok NagarDelhi꧁ 8447779280꧂ Escort Service Women Seeking ...
 
Call Girls in shastri nagar Delhi 8264348440 ✅ call girls ❤️
Call Girls in shastri nagar Delhi 8264348440 ✅ call girls ❤️Call Girls in shastri nagar Delhi 8264348440 ✅ call girls ❤️
Call Girls in shastri nagar Delhi 8264348440 ✅ call girls ❤️
 
9990771857 Call Girls in Dwarka Sector 3 Delhi (Call Girls) Delhi
9990771857 Call Girls in Dwarka Sector 3 Delhi (Call Girls) Delhi9990771857 Call Girls in Dwarka Sector 3 Delhi (Call Girls) Delhi
9990771857 Call Girls in Dwarka Sector 3 Delhi (Call Girls) Delhi
 
call girls in ganesh nagar Delhi 8264348440 ✅ call girls ❤️
call girls in ganesh nagar Delhi 8264348440 ✅ call girls ❤️call girls in ganesh nagar Delhi 8264348440 ✅ call girls ❤️
call girls in ganesh nagar Delhi 8264348440 ✅ call girls ❤️
 
Shapoorji Pallonji Joyville Vista Pune | Spend Your Family Time Together
Shapoorji Pallonji Joyville Vista Pune | Spend Your Family Time TogetherShapoorji Pallonji Joyville Vista Pune | Spend Your Family Time Together
Shapoorji Pallonji Joyville Vista Pune | Spend Your Family Time Together
 
9990771857 Call Girls in Dwarka Sector 7 Delhi (Call Girls) Delhi
9990771857 Call Girls in Dwarka Sector 7 Delhi (Call Girls) Delhi9990771857 Call Girls in Dwarka Sector 7 Delhi (Call Girls) Delhi
9990771857 Call Girls in Dwarka Sector 7 Delhi (Call Girls) Delhi
 
2k Shot Call girls Karol Bagh Delhi 9205541914
2k Shot Call girls Karol Bagh Delhi 92055419142k Shot Call girls Karol Bagh Delhi 9205541914
2k Shot Call girls Karol Bagh Delhi 9205541914
 
9990771857 Call Girls in Dwarka Sector 137 Noida (Call Girls) Delhi
9990771857 Call Girls in Dwarka Sector 137 Noida (Call Girls) Delhi9990771857 Call Girls in Dwarka Sector 137 Noida (Call Girls) Delhi
9990771857 Call Girls in Dwarka Sector 137 Noida (Call Girls) Delhi
 
3D Architectural Rendering Company by Panoram CGI
3D Architectural Rendering Company by Panoram CGI3D Architectural Rendering Company by Panoram CGI
3D Architectural Rendering Company by Panoram CGI
 
Best Deal Virtual Space in Satya The Hive Tata Zudio 750 Sqft 1.89 Cr All inc...
Best Deal Virtual Space in Satya The Hive Tata Zudio 750 Sqft 1.89 Cr All inc...Best Deal Virtual Space in Satya The Hive Tata Zudio 750 Sqft 1.89 Cr All inc...
Best Deal Virtual Space in Satya The Hive Tata Zudio 750 Sqft 1.89 Cr All inc...
 
M3M 129 E Brochure Noida Expressway, Sector 129, Noida
M3M 129 E Brochure Noida Expressway, Sector 129, NoidaM3M 129 E Brochure Noida Expressway, Sector 129, Noida
M3M 129 E Brochure Noida Expressway, Sector 129, Noida
 

En vedette

How to Prepare For a Successful Job Search for 2024
How to Prepare For a Successful Job Search for 2024How to Prepare For a Successful Job Search for 2024
How to Prepare For a Successful Job Search for 2024Albert Qian
 
Social Media Marketing Trends 2024 // The Global Indie Insights
Social Media Marketing Trends 2024 // The Global Indie InsightsSocial Media Marketing Trends 2024 // The Global Indie Insights
Social Media Marketing Trends 2024 // The Global Indie InsightsKurio // The Social Media Age(ncy)
 
Trends In Paid Search: Navigating The Digital Landscape In 2024
Trends In Paid Search: Navigating The Digital Landscape In 2024Trends In Paid Search: Navigating The Digital Landscape In 2024
Trends In Paid Search: Navigating The Digital Landscape In 2024Search Engine Journal
 
5 Public speaking tips from TED - Visualized summary
5 Public speaking tips from TED - Visualized summary5 Public speaking tips from TED - Visualized summary
5 Public speaking tips from TED - Visualized summarySpeakerHub
 
ChatGPT and the Future of Work - Clark Boyd
ChatGPT and the Future of Work - Clark Boyd ChatGPT and the Future of Work - Clark Boyd
ChatGPT and the Future of Work - Clark Boyd Clark Boyd
 
Getting into the tech field. what next
Getting into the tech field. what next Getting into the tech field. what next
Getting into the tech field. what next Tessa Mero
 
Google's Just Not That Into You: Understanding Core Updates & Search Intent
Google's Just Not That Into You: Understanding Core Updates & Search IntentGoogle's Just Not That Into You: Understanding Core Updates & Search Intent
Google's Just Not That Into You: Understanding Core Updates & Search IntentLily Ray
 
Time Management & Productivity - Best Practices
Time Management & Productivity -  Best PracticesTime Management & Productivity -  Best Practices
Time Management & Productivity - Best PracticesVit Horky
 
The six step guide to practical project management
The six step guide to practical project managementThe six step guide to practical project management
The six step guide to practical project managementMindGenius
 
Beginners Guide to TikTok for Search - Rachel Pearson - We are Tilt __ Bright...
Beginners Guide to TikTok for Search - Rachel Pearson - We are Tilt __ Bright...Beginners Guide to TikTok for Search - Rachel Pearson - We are Tilt __ Bright...
Beginners Guide to TikTok for Search - Rachel Pearson - We are Tilt __ Bright...RachelPearson36
 
Unlocking the Power of ChatGPT and AI in Testing - A Real-World Look, present...
Unlocking the Power of ChatGPT and AI in Testing - A Real-World Look, present...Unlocking the Power of ChatGPT and AI in Testing - A Real-World Look, present...
Unlocking the Power of ChatGPT and AI in Testing - A Real-World Look, present...Applitools
 
12 Ways to Increase Your Influence at Work
12 Ways to Increase Your Influence at Work12 Ways to Increase Your Influence at Work
12 Ways to Increase Your Influence at WorkGetSmarter
 
Ride the Storm: Navigating Through Unstable Periods / Katerina Rudko (Belka G...
Ride the Storm: Navigating Through Unstable Periods / Katerina Rudko (Belka G...Ride the Storm: Navigating Through Unstable Periods / Katerina Rudko (Belka G...
Ride the Storm: Navigating Through Unstable Periods / Katerina Rudko (Belka G...DevGAMM Conference
 
Barbie - Brand Strategy Presentation
Barbie - Brand Strategy PresentationBarbie - Brand Strategy Presentation
Barbie - Brand Strategy PresentationErica Santiago
 
Good Stuff Happens in 1:1 Meetings: Why you need them and how to do them well
Good Stuff Happens in 1:1 Meetings: Why you need them and how to do them wellGood Stuff Happens in 1:1 Meetings: Why you need them and how to do them well
Good Stuff Happens in 1:1 Meetings: Why you need them and how to do them wellSaba Software
 
Introduction to C Programming Language
Introduction to C Programming LanguageIntroduction to C Programming Language
Introduction to C Programming LanguageSimplilearn
 

En vedette (20)

How to Prepare For a Successful Job Search for 2024
How to Prepare For a Successful Job Search for 2024How to Prepare For a Successful Job Search for 2024
How to Prepare For a Successful Job Search for 2024
 
Social Media Marketing Trends 2024 // The Global Indie Insights
Social Media Marketing Trends 2024 // The Global Indie InsightsSocial Media Marketing Trends 2024 // The Global Indie Insights
Social Media Marketing Trends 2024 // The Global Indie Insights
 
Trends In Paid Search: Navigating The Digital Landscape In 2024
Trends In Paid Search: Navigating The Digital Landscape In 2024Trends In Paid Search: Navigating The Digital Landscape In 2024
Trends In Paid Search: Navigating The Digital Landscape In 2024
 
5 Public speaking tips from TED - Visualized summary
5 Public speaking tips from TED - Visualized summary5 Public speaking tips from TED - Visualized summary
5 Public speaking tips from TED - Visualized summary
 
ChatGPT and the Future of Work - Clark Boyd
ChatGPT and the Future of Work - Clark Boyd ChatGPT and the Future of Work - Clark Boyd
ChatGPT and the Future of Work - Clark Boyd
 
Getting into the tech field. what next
Getting into the tech field. what next Getting into the tech field. what next
Getting into the tech field. what next
 
Google's Just Not That Into You: Understanding Core Updates & Search Intent
Google's Just Not That Into You: Understanding Core Updates & Search IntentGoogle's Just Not That Into You: Understanding Core Updates & Search Intent
Google's Just Not That Into You: Understanding Core Updates & Search Intent
 
How to have difficult conversations
How to have difficult conversations How to have difficult conversations
How to have difficult conversations
 
Introduction to Data Science
Introduction to Data ScienceIntroduction to Data Science
Introduction to Data Science
 
Time Management & Productivity - Best Practices
Time Management & Productivity -  Best PracticesTime Management & Productivity -  Best Practices
Time Management & Productivity - Best Practices
 
The six step guide to practical project management
The six step guide to practical project managementThe six step guide to practical project management
The six step guide to practical project management
 
Beginners Guide to TikTok for Search - Rachel Pearson - We are Tilt __ Bright...
Beginners Guide to TikTok for Search - Rachel Pearson - We are Tilt __ Bright...Beginners Guide to TikTok for Search - Rachel Pearson - We are Tilt __ Bright...
Beginners Guide to TikTok for Search - Rachel Pearson - We are Tilt __ Bright...
 
Unlocking the Power of ChatGPT and AI in Testing - A Real-World Look, present...
Unlocking the Power of ChatGPT and AI in Testing - A Real-World Look, present...Unlocking the Power of ChatGPT and AI in Testing - A Real-World Look, present...
Unlocking the Power of ChatGPT and AI in Testing - A Real-World Look, present...
 
12 Ways to Increase Your Influence at Work
12 Ways to Increase Your Influence at Work12 Ways to Increase Your Influence at Work
12 Ways to Increase Your Influence at Work
 
ChatGPT webinar slides
ChatGPT webinar slidesChatGPT webinar slides
ChatGPT webinar slides
 
More than Just Lines on a Map: Best Practices for U.S Bike Routes
More than Just Lines on a Map: Best Practices for U.S Bike RoutesMore than Just Lines on a Map: Best Practices for U.S Bike Routes
More than Just Lines on a Map: Best Practices for U.S Bike Routes
 
Ride the Storm: Navigating Through Unstable Periods / Katerina Rudko (Belka G...
Ride the Storm: Navigating Through Unstable Periods / Katerina Rudko (Belka G...Ride the Storm: Navigating Through Unstable Periods / Katerina Rudko (Belka G...
Ride the Storm: Navigating Through Unstable Periods / Katerina Rudko (Belka G...
 
Barbie - Brand Strategy Presentation
Barbie - Brand Strategy PresentationBarbie - Brand Strategy Presentation
Barbie - Brand Strategy Presentation
 
Good Stuff Happens in 1:1 Meetings: Why you need them and how to do them well
Good Stuff Happens in 1:1 Meetings: Why you need them and how to do them wellGood Stuff Happens in 1:1 Meetings: Why you need them and how to do them well
Good Stuff Happens in 1:1 Meetings: Why you need them and how to do them well
 
Introduction to C Programming Language
Introduction to C Programming LanguageIntroduction to C Programming Language
Introduction to C Programming Language
 

EMEA International Investment

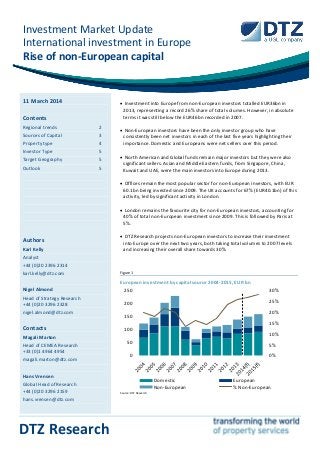
  • 1. Investment Market Update International investment in Europe Rise of non-European capital DTZ Research 11 March 2014 Contents Regional trends 2 Sources of Capital 3 Property type 4 Investor Type 5 Target Geography 5 Outlook 5 Authors Karl Kelly Analyst +44 (0)20 2396 2314 karl.kelly@dtz.com Nigel Almond Head of Strategy Research +44 (0)20 3296 2328 nigel.almond@dtz.com Contacts Magali Marton Head of CEMEA Research +33 (0)1 4964 4954 magali.marton@dtz.com Hans Vrensen Global Head of Research +44 (0)20 3296 2159 hans.vrensen@dtz.com  Investment into Europe from non-European investors totalled EUR36bn in 2013, representing a record 26% share of total volumes. However, in absolute terms it was still below the EUR46bn recorded in 2007.  Non-European investors have been the only investor group who have consistently been net investors in each of the last five years highlighting their importance. Domestic and Europeans were net sellers over this period.  North American and Global funds remain major investors but they were also significant sellers. Asian and Middle Eastern funds, from Singapore, China, Kuwait and UAE, were the main investors into Europe during 2013.  Offices remain the most popular sector for non-European investors, with EUR 60.1bn being invested since 2009. The UK accounts for 67% (EUR40.1bn) of this activity, led by significant activity in London.  London remains the favourite city for non-European investors, accounting for 40% of total non-European investment since 2009. This is followed by Paris at 5%.  DTZ Research projects non-European investors to increase their investment into Europe over the next two years, both taking total volumes to 2007 levels and increasing their overall share towards 30%. Figure 1 European investment by capital source 2004-2015, EUR bn 0% 5% 10% 15% 20% 25% 30% 0 50 100 150 200 250 Domestic European Non-European % Non-European Source: DTZ Research
  • 2. International investment in Europe www.dtz.com Investment Market Update 2 Regional trends Growth in non-European investment Total investment in European commercial real estate reached EUR139bn in 2013, more than double 2009’s low of EUR62bn. Investor confidence has once again returned to the region, as prospects about the economy are improving and political uncertainty over its future is declining. Investment volumes are being driven by flows of capital from other parts of the world. Non-European investment totalled EUR36bn in 2013, a 27% increase on 2012, pushing non-European investment to a record 26% share of total investment. However, in absolute terms these flows are still below the peak volume of EUR46.1bn seen in 2007 (Figure 2). Non-European’s consistent net buyers in Europe Even on a net basis, non European capital has been the only source to consistently be net positive over the last five years. Total net investment by non-European investors was EUR42bn over 2009-13. Both domestic and European investors were net sellers over the same period. Domestic investors were net sellers in every year over the period (Figure 3). Asian and Middle Eastern capital dominating Since 2009, net investment into Europe has been dominated by investors from Asia Pacific. Investors from the region maintain the biggest net position of EUR14.7bn. Middle Eastern investors have been the second largest net contributors since 2009, with net investment of EUR10.6bn. North American investors were the next biggest net players at EUR10.5bn although this involved far higher levels of trading (Figure 4). Global investment managers have been the most active in the market leading to broadly neutral net investment. Figure 2 Non-European investment into Europe, EUR bn 22% 20% 13% 26% 0% 5% 10% 15% 20% 25% 30% 0 10 20 30 40 50 Non-European Non-European as % of total European investment Source: DTZ Research Figure 3 Net investment by source of capital 2009-13, EUR bn -20 -10 0 10 20 2009 2010 2011 2012 2013 Domestic European Non-European Source: DTZ Research Figure 4 Net investment by source of capital 2009-13, EUR bn -30 -20 -10 0 10 20 30 Asia Pacific Middle East North America International Africa Buy Sell Net Source: DTZ Research
  • 3. International investment in Europe www.dtz.com Investment Market Update 3 Sources of Capital Asian capital coming from a diverse range of sources Asian investment has experienced consistent growth over the last five years increasing from EUR2.2bn in 2009, to EUR8.8bn in 2013. This increase has corresponded with a growing diversity of investors. Malaysian’s have been the most active, with volumes of EUR4.6bn invested since 2009. This figure is mainly dominated by institutional investors investing in the London office market. South Korean’s has been the second most active investor by value, with EUR4.2bn invested since 2009. The volume of activity from these markets has declined with growing activity from China and Singapore. In 2013 investment from Singapore totalled EUR2.6bn, 30% of Asian investment and dominated by GIC’s acquisition of EUR2bn (Figure 5). Chinese investors have also been increasingly active with investment of EUR3.1bn since 2009 reflecting mainly investment by the country’s sovereign wealth fund and institutions of EUR0.97bn and EUR0.6bn respectively. This excludes increasing activity from developers towards residential and hotels. Mid East investment dominated by sovereign wealth funds Middle Eastern investors have also seen consistent growth over the past 5 years, with greater diversity been seen in terms of sources of capital. Overall volumes were EUR5.8bn in 2013, up from EUR1.6bn in 2009. Combined, flows from Kuwait, Israel, Qatar and the UAE totalled EUR11.1bn between 2009 and 2013. Qatari investment saw a significant increase in 2012, mostly attributed to EUR3.2bn of investment from their sovereign fund. Investment from Kuwait and UAE increased significantly in 2013 representing 66% of Middle Eastern volumes. This mainly consisted of investment from each country’s Sovereign Wealth fund of EUR2.9bn and EUR1.6bn respectively (Figure 6). US volumes returning to pre-crisis levels North American investors have been consistently active across Europe both before and after the global financial crisis. Both US and Canadian investors have been active net investors through 2001 and 2012, but in 2013, both increased the level of sales reducing their overall net investment to EUR1.5bn (Figure 7). Institutions account for almost half of Canadian volumes with EUR3.7bn invested since 2011. Investment from the US is dominated by Private Property Vehicles accounting for 67% (EUR12.3bn) of purchases from the country since 2011. Figure 5 Investment activity by key Asian sources 0% 25% 50% 75% 100% 2009 2010 2011 2012 2013 Singapore China South Korea Malaysia Australia Rest ofAsia Source: DTZ Research Figure 6 Investment activity by key Middle Eastern sources 0% 25% 50% 75% 100% 2009 2010 2011 2012 2013 Kuwait UAE Qatar Israel Rest ofMiddle East Source: DTZ Research Figure 7 Net investment by North American sources, EUR bn -8.0 -4.0 0.0 4.0 8.0 2011 2012 2013 2011 2012 2013 Buy Sell Net US Canada Source: DTZ Research
  • 4. International investment in Europe www.dtz.com Investment Market Update 4 Property type Offices the preferred choice Offices remain the most popular sector for non-European investors with EUR 60bn being invested since 2009. This accounts for 57% of total non-European investment over the 2009-2013 period. Over two-thirds (EUR40bn) of this investment was in the UK, notably Central London. Activity for the office sector throughout Europe peaked in 2013, when it made up 60% of all property acquisitions (Figure 8). The retail sector is the second most popular sector, with EUR 24bn being invested since 2009. This is driven by shopping centre investment which represented 56% (EUR13.5bn) of retail volumes, predominantly in the UK and Germany. Mixed-use assets continue to attract investors’ interest, with EUR9.6bn invested in them seen since 2009. The UK attracted 43% (EUR4.1bn) of this volume followed by Germany which accounted for 25% (EUR2.4bn). North America maintains diversified investment in sectors When comparing investment activity by source some different patterns emerge. North American investors have typically split 70% of their investment across the office and retail sectors (Figure 9). This is in contrast to Asian and Middle Eastern investors who have been more focussed towards the office sector, which has represented the bulk of their commercial investment. New pools of Asian capital are also now focussed on mixed-use or residential led schemes. Non-European’s have appetite for larger lot sizes Since 2004, non-European investment has focussed on lot- sizes which are generally larger than that of domestic and European investment (Figure 10). This is because non- European investors like to be able to deploy their capital in a quick and efficient process. It is easier to execute this by investing in larger lots. Many overseas investors also seek to invest in ‘trophy’ assets which are typically larger lots. Non- European investors account for 49% of investment in lot- sizes bigger than EUR1bn. Figure 8 Non-European investment by property type 0% 20% 40% 60% 80% 100% 2009 2010 2011 2012 2013 Office Retail Industrial Mixed Use Other Source: DTZ Research Figure 9 Investment by property type and source of capital 2009-13 0% 20% 40% 60% 80% 100% Middle East APAC North America Office Retail Industrial Mixed Use Other Source: DTZ Research Figure 10 Average lot size by capital source, EUR m 0 20 40 60 80 100 120 2004 2005 2006 2007 2008 2009 2010 2011 2012 2013 Domestic European Non-European Source: DTZ Research
  • 5. International investment in Europe www.dtz.com Investment Market Update 5 Investor Type Private Property Vehicles dominating volumes Since the financial crisis, unlisted funds have been the most active investors on both the buy and sell side, reflecting the high proportion of global fund managers (Figure11). Since 2009, non-European sovereign wealth funds have invested EUR12.6bn in Europe, of which more than half EUR7.5bn was invested in 2013, representing close to a third of non- European investment in 2013. Over the last five years sovereign wealth funds invested a net EUR7.5bn and institutions added a further EUR3.9bn of net investment. Target Geography Asian capital to play central role in coming years Over 80% of non-European investment has been focussed on the core three European markets of the UK, Germany and France (Figure 12). The UK attracts the largest amount of non-European investment within Europe, accounting for 58% of the total since 2009. London makes up 66% of this figure with investment of EUR40bn mainly dominated by private property vehicles and sovereign wealth funds. Germany accounts for 15% of non-European investment with volumes of EUR15.2bn. Investment within Germany is much more diversified with the core five cities making up 65% of volumes. France is the third largest recipient of non- European investment accounting for 9% of volumes. This figure, similar to the UK, is dominated by the capital with over half of volumes going to Paris since 2009. Outlook New investors attracted by pricing and liquidity We continue to see new pools of investment capital focussed on Europe from outside of the region. This is partially driven by the build-up of foreign reserves in emerging markets and the diversification of their asset base. As a result, we project that over the next two years, their share of investment will increase further towards 30% (Figure 13), taking absolute investment towards their peak level of EUR46bn by 2015. This is a testament to the relative attractiveness of pricing and the good liquidity which new investors can find across the region’s diverse commercial property markets at this time. Figure 11 Net investment by investor type 2009-2013, EUR bn -40 -20 0 20 40 60 Unlisted Funds Sovereign Wealth Fund Institution Buy Sell Net Source: DTZ Research Figure 12 Destination of non-European investment 2009-2013 58% 15% 9% 5% 13% UK Germany France Spain Rest ofEurope Source: DTZ Research Figure 13 European investment by capital source 2004-2015, EUR bn 0% 5% 10% 15% 20% 25% 30% 0 50 100 150 200 250 Domestic European Non-European % Non-European Source: DTZ Research
  • 6. International investment in Europe www.dtz.com Investment Market Update 6 Other DTZ Research Reports Other research reports can be downloaded from www.dtz.com/research. These include: Occupier Perspective Updates on occupational markets from an occupier perspective, with commentary, analysis, charts and data. Global Occupancy Costs Offices Global Occupancy Costs Logistics Obligations of Occupation Americas Obligations of Occupation Asia Pacific Obligations of Occupation EMEA Global Office Review Regional Headquarters Asia Pacific- November 2013 Sweden - Computer Games developers – November 2013 India Office Demand and Trends Survey 2012-13 Poland Banking Sector - January 2013 Property Times Regular updates on occupational markets from a landlord perspective, with commentary, charts, data and forecasts. Coverage includes Asia Pacific, Bangkok, Beijing, Berlin, Brisbane, Bristol, Brussels, Budapest, Central London, Chengdu, Chongqing, Dalian, Edinburgh, Europe, Frankfurt, Glasgow, Guangzhou, Hangzhou, Ho Chi Minh City, Hong Kong, India, Jakarta, Japan, Kuala Lumpur, Luxembourg, Madrid, Manchester, Melbourne, Milan, Nanjing, Newcastle, Paris, Poland, Prague, Qingdao, Rome, Seoul, Shanghai, Shenyang, Shenzhen, Singapore, Stockholm, Sydney, Taipei, Tianjin, Ukraine, Warsaw, Wuhan, Xian. Investment Market Update Regular updates on investment market activity, with commentary, significant deals, charts, data and forecasts. Coverage includes Asia Pacific, Australia, Belgium, Czech Republic, Europe, France, Germany, Italy, Japan, Mainland China, South East Asia, Spain, Sweden, UK. Money into Property For more than 35 years, this has been DTZ's flagship research report, analysing invested stock and capital flows into real estate markets across the world. It measures the development and structure of the global investment market. Available for Global, Asia Pacific, Europe, North America and UK. Foresight Quarterly commentary, analysis and insight into our in- house data forecasts, including the DTZ Fair Value Index™. Available for Global, Asia Pacific, Europe and UK. In addition we publish an annual outlook report. Insight Thematic, ad hoc, topical and thought leading reports on areas and issues of specific interest and relevance to real estate markets. China Investment Market Sentiment Survey January 2014 China The Technology Sector January 2014 Insight Czech Republic Green buildings December 2013 Net Debt Funding Gap - November 2013 UK secondary market pricing - October 2013 German Open Ended Funds - October 2013 Great Wall of Money - October 2013 Quantitative Easing - UK Regions - September 2013 Singapore Government Land Sales - September 2013 UK lending market -September 2013 Quantitative Easing - August 2013 Property Investment Guide Asia Pacific 2013-2014 DTZ Research Data Services For more detailed data and information, the following are available for subscription. Please contact graham.bruty@dtz.com for more information.  Property Market Indicators Time series of commercial and industrial market data in Asia Pacific and Europe.  Real Estate Forecasts, including the DTZ Fair Value Index TM Five-year rolling forecasts of commercial and industrial markets in Asia Pacific, Europe and the USA.  Investment Transaction Database Aggregated overview of investment activity in Asia Pacific and Europe.  Money into Property DTZ’s flagship research product for over 35 years providing capital markets data covering capital flows, size, structure, ownership, developments and trends, and findings of annual investor and lender intention surveys.
  • 7. www.dtz.com Investment Market Update 7 DTZ Research DTZ Research Contacts Global Head of Research Hans Vrensen Phone: +44 (0)20 3296 2159 Email: hans.vrensen@dtz.com Global Head of Forecasting Fergus Hicks Phone: +44 (0)20 3296 2307 Email: fergus.hicks@dtz.com Head of Strategy Research Nigel Almond Phone: +44 (0)20 3296 2328 Email: nigel.almond@dtz.com Head of Americas Research John Wickes Phone: +1 312 424 8087 Email: john.wickes@dtz.com Head of UK Research Richard Yorke Phone: +44 (0)20 3296 2319 Email: richard.yorke@dtz.com Head of CEMEA Research Magali Marton Phone: +33 1 49 64 49 54 Email: magali.marton@dtz.com Head of North Asia Research Andrew Ness Phone: +852 2507 0779 Email: andrew.ness@dtz.com Head of South East Asia and Australia New Zealand Research Dominic Brown Phone: +61 (0)2 8243 9999 Email: dominic.brown@dtz.com DTZ Business Contacts Chief Executive, EMEA John Forrester Phone: +44 (0)20 3296 2002 Email: john.forrester@dtz.com Head of International Investment, EMEA Paul Boursican Phone: +44 (0)20 3296 2019 Email: paul.boursican@dtz.com International Investment, EMEA Mark Roberts Phone: +44 (0)20 3296 2149 Email: mark.roberts@dtz.com DISCLAIMER This report should not be relied upon as a basis for entering into transactions without seeking specific, qualified, professional advice. Whilst facts have been rigorously checked, DTZ can take no responsibility for any damage or loss suffered as a result of any inadvertent inaccuracy within this report. Information contained herein should not, in whole or part, be published, reproduced or referred to without prior approval. Any such reproduction should be credited to DTZ. © DTZ March 2014