SlideShare une entreprise Scribd logo
1  sur  1
OCEAN CITY HIGH SCHOOL
                                   The Past Ten Years – 2003 - 2012
                                      Testing and College Plans

Class Size (Full-Time Day Program)
2003 – 302               2006 – 314             2009 – 351            2012 – 298
2004 – 296               2007 – 338             2010 – 311
2005 – 282               2008 – 322             2011 – 305
*SAT Testing Results
2003 – 80.59% tested             Verbal Mean – 534.41          Math Mean – 546.78
2004 – 80.74% tested             Verbal Mean – 520.42          Math Mean – 535.44
2005 – 80.5% tested              CR Mean – 513.17              Math Mean – 529.73
         Top Tenth - CR 611.78, Math 645 – Second Tenth – CR 547.49, Math 580.69
2006 – 80.89% tested             CR Mean – 525.04              Math Mean – 535.16
         Top Tenth – CR 650, Math 658.7 – Second Tenth – CR 608, Math 607
2007 – 82.25% tested             CR – 515.32                   Math – 534.96         Writing – 509.71
         Top Tenth – CR 638.24, M 650, W 632.35 – Second Tenth – CR 575.29, M 611.76, W 571.76
2008 – 78.89% tested             CR – 515.47                   Math – 530.47         Writing – 511.46
         Top Tenth – CR 619.68, M 656.45, W 631.94–Second Tenth – CR 587.5, M 609.06, W 584.69
2009 – 82.34% tested             CR – 508.27                   Math – 532.49         Writing – 505.61
         Top Tenth – CR 640.57, M 677.14, W 642 – Second Tenth – CR 568.86, M 601.71, W 581.71
2010 – 81.67% tested             CR – 511.5                    Math – 535.31         Writing – 506.89
         Top Tenth – CR 612, M 661, W 610 – Second Tenth – CR 577.67, M 593, W 563
2011 – 86.23% tested             CR – 511.67                   Math – 526.69         Writing – 501.33
         Top Tenth – CR 647.33, M 659.67, W 649.67 – Second Tenth – CR 574.48, M 584.83, W 560.69
2012– 87.92% tested              CR – 504.92                   Math – 531.60         Writing – 503.21
         Top Tenth – CR 630, M 678.67, W 639.33 – Second Tenth – CR 571, M 578.67, W 581
* Each student’s best scores used to determine average

AP Testing
Year                   # Tests Taken          # Students       % Score 3 or Above   Avg. Score
2002                   205                    105                     73%             3.27
2003                   204                    108                     77%             3.35
2004                   210                    110                     76%             3.25
2005                   247                    127                     73%             3.16
2006                   328                    173                     77%             3.28
2007                   310                    176                     70%             3.08
2008                   310                    164                     73%             3.33
2009                   359                    192                     76%             3.39
2010                   358                    183                     78%             3.37
2011                   384                    193                     71%             3.19
2012                   478                    236                     77%             3.14
Percentage Attending College
2003           4-Year College 63%             2-Year College   24%
2004           4-Year College 64%             2-Year College   20%
2005           4-Year College 59.2%           2-Year College   25.5%
2006           4-Year College 63.7%           2-Year College   23.6%
2007           4-Year College 60.9%           2-Year College   25.1%
2008           4-Year College 54.4%           2-Year College   32.6%
2009           4-Year College 55.3%           2-Year College   33.3%
2010           4-Year College 53.1%           2-Year College   34.4%
2011           4-Year College 65.2%           2-Year College   26.9%
2012           4-Year College 60.7%           2-Year College   31.5%

Contenu connexe

Similaire à OCHS over the past 10 years

Personal Feelings to Share about USTC
Personal Feelings to Share about USTCPersonal Feelings to Share about USTC
Personal Feelings to Share about USTCYiming Chen
 
[대학내일20대연구소] 2016 전국 대학생 취업준비 실태조사 (이슈페이퍼 2016-05)
[대학내일20대연구소] 2016 전국 대학생 취업준비 실태조사 (이슈페이퍼 2016-05)[대학내일20대연구소] 2016 전국 대학생 취업준비 실태조사 (이슈페이퍼 2016-05)
[대학내일20대연구소] 2016 전국 대학생 취업준비 실태조사 (이슈페이퍼 2016-05)20slab(대학내일20대연구소)
 
Grade Distribs Lgcourses Summary
Grade Distribs Lgcourses SummaryGrade Distribs Lgcourses Summary
Grade Distribs Lgcourses SummaryLynda Milne
 
Foundation admissions 2017_eng(2)
Foundation admissions 2017_eng(2)Foundation admissions 2017_eng(2)
Foundation admissions 2017_eng(2)Indira Tolendiyeva
 
Mortgage Brokers Association Data
Mortgage Brokers Association DataMortgage Brokers Association Data
Mortgage Brokers Association DataTom Cryer
 
Real Time Enrollment of IPS and Charter Schools
Real Time Enrollment of IPS and Charter SchoolsReal Time Enrollment of IPS and Charter Schools
Real Time Enrollment of IPS and Charter SchoolsAbdul-Hakim Shabazz
 
Foundation admissions 2017_eng
Foundation admissions 2017_engFoundation admissions 2017_eng
Foundation admissions 2017_engIndira Tolendiyeva
 
2012 SAIR It's not about pie when it comes to the facts
2012 SAIR It's not about pie when it comes to the facts2012 SAIR It's not about pie when it comes to the facts
2012 SAIR It's not about pie when it comes to the factsDavid Onder
 
Cook County Redistricting Plan Demographic Impact
Cook County Redistricting Plan Demographic ImpactCook County Redistricting Plan Demographic Impact
Cook County Redistricting Plan Demographic Impactcookcountyblog
 
Coronavirus cases by state - projections for growther from 03-21-2020 to 04-...
Coronavirus cases by state  - projections for growther from 03-21-2020 to 04-...Coronavirus cases by state  - projections for growther from 03-21-2020 to 04-...
Coronavirus cases by state - projections for growther from 03-21-2020 to 04-...James Orr
 
Do these earthquakes have any connection
Do these earthquakes have any connectionDo these earthquakes have any connection
Do these earthquakes have any connectionvpshedbalkar
 
Desempleo Por Edad
Desempleo Por EdadDesempleo Por Edad
Desempleo Por EdadAisart
 
Orr' projection model v 2020 03-29
Orr' projection model v 2020 03-29Orr' projection model v 2020 03-29
Orr' projection model v 2020 03-29James Orr
 
Foundation 2015 for website
Foundation 2015 for websiteFoundation 2015 for website
Foundation 2015 for websitetimur_yergibayev
 

Similaire à OCHS over the past 10 years (20)

Personal Feelings to Share about USTC
Personal Feelings to Share about USTCPersonal Feelings to Share about USTC
Personal Feelings to Share about USTC
 
[대학내일20대연구소] 2016 전국 대학생 취업준비 실태조사 (이슈페이퍼 2016-05)
[대학내일20대연구소] 2016 전국 대학생 취업준비 실태조사 (이슈페이퍼 2016-05)[대학내일20대연구소] 2016 전국 대학생 취업준비 실태조사 (이슈페이퍼 2016-05)
[대학내일20대연구소] 2016 전국 대학생 취업준비 실태조사 (이슈페이퍼 2016-05)
 
Grade Distribs Lgcourses Summary
Grade Distribs Lgcourses SummaryGrade Distribs Lgcourses Summary
Grade Distribs Lgcourses Summary
 
Foundation admissions 2017_eng(2)
Foundation admissions 2017_eng(2)Foundation admissions 2017_eng(2)
Foundation admissions 2017_eng(2)
 
Mortgage Brokers Association Data
Mortgage Brokers Association DataMortgage Brokers Association Data
Mortgage Brokers Association Data
 
Real Time Enrollment of IPS and Charter Schools
Real Time Enrollment of IPS and Charter SchoolsReal Time Enrollment of IPS and Charter Schools
Real Time Enrollment of IPS and Charter Schools
 
Foundation admissions 2017_eng
Foundation admissions 2017_engFoundation admissions 2017_eng
Foundation admissions 2017_eng
 
11
1111
11
 
2012 SAIR It's not about pie when it comes to the facts
2012 SAIR It's not about pie when it comes to the facts2012 SAIR It's not about pie when it comes to the facts
2012 SAIR It's not about pie when it comes to the facts
 
Middle Class
Middle ClassMiddle Class
Middle Class
 
Cook County Redistricting Plan Demographic Impact
Cook County Redistricting Plan Demographic ImpactCook County Redistricting Plan Demographic Impact
Cook County Redistricting Plan Demographic Impact
 
Coronavirus cases by state - projections for growther from 03-21-2020 to 04-...
Coronavirus cases by state  - projections for growther from 03-21-2020 to 04-...Coronavirus cases by state  - projections for growther from 03-21-2020 to 04-...
Coronavirus cases by state - projections for growther from 03-21-2020 to 04-...
 
Do these earthquakes have any connection
Do these earthquakes have any connectionDo these earthquakes have any connection
Do these earthquakes have any connection
 
Desempleo Por Edad
Desempleo Por EdadDesempleo Por Edad
Desempleo Por Edad
 
Age Pyramids
Age PyramidsAge Pyramids
Age Pyramids
 
Foradmissions foundation_en
Foradmissions foundation_enForadmissions foundation_en
Foradmissions foundation_en
 
Groundwater Resources Assessment and Future Irrigation Potentials in Three Di...
Groundwater Resources Assessment and Future Irrigation Potentials in Three Di...Groundwater Resources Assessment and Future Irrigation Potentials in Three Di...
Groundwater Resources Assessment and Future Irrigation Potentials in Three Di...
 
Foundation foradmissions eng
Foundation foradmissions engFoundation foradmissions eng
Foundation foradmissions eng
 
Orr' projection model v 2020 03-29
Orr' projection model v 2020 03-29Orr' projection model v 2020 03-29
Orr' projection model v 2020 03-29
 
Foundation 2015 for website
Foundation 2015 for websiteFoundation 2015 for website
Foundation 2015 for website
 

OCHS over the past 10 years

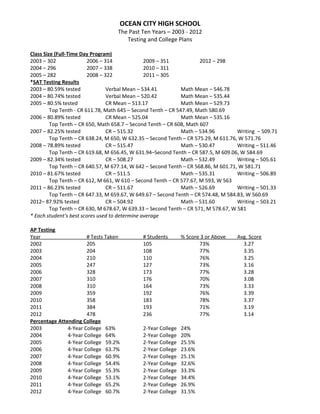
  • 1. OCEAN CITY HIGH SCHOOL The Past Ten Years – 2003 - 2012 Testing and College Plans Class Size (Full-Time Day Program) 2003 – 302 2006 – 314 2009 – 351 2012 – 298 2004 – 296 2007 – 338 2010 – 311 2005 – 282 2008 – 322 2011 – 305 *SAT Testing Results 2003 – 80.59% tested Verbal Mean – 534.41 Math Mean – 546.78 2004 – 80.74% tested Verbal Mean – 520.42 Math Mean – 535.44 2005 – 80.5% tested CR Mean – 513.17 Math Mean – 529.73 Top Tenth - CR 611.78, Math 645 – Second Tenth – CR 547.49, Math 580.69 2006 – 80.89% tested CR Mean – 525.04 Math Mean – 535.16 Top Tenth – CR 650, Math 658.7 – Second Tenth – CR 608, Math 607 2007 – 82.25% tested CR – 515.32 Math – 534.96 Writing – 509.71 Top Tenth – CR 638.24, M 650, W 632.35 – Second Tenth – CR 575.29, M 611.76, W 571.76 2008 – 78.89% tested CR – 515.47 Math – 530.47 Writing – 511.46 Top Tenth – CR 619.68, M 656.45, W 631.94–Second Tenth – CR 587.5, M 609.06, W 584.69 2009 – 82.34% tested CR – 508.27 Math – 532.49 Writing – 505.61 Top Tenth – CR 640.57, M 677.14, W 642 – Second Tenth – CR 568.86, M 601.71, W 581.71 2010 – 81.67% tested CR – 511.5 Math – 535.31 Writing – 506.89 Top Tenth – CR 612, M 661, W 610 – Second Tenth – CR 577.67, M 593, W 563 2011 – 86.23% tested CR – 511.67 Math – 526.69 Writing – 501.33 Top Tenth – CR 647.33, M 659.67, W 649.67 – Second Tenth – CR 574.48, M 584.83, W 560.69 2012– 87.92% tested CR – 504.92 Math – 531.60 Writing – 503.21 Top Tenth – CR 630, M 678.67, W 639.33 – Second Tenth – CR 571, M 578.67, W 581 * Each student’s best scores used to determine average AP Testing Year # Tests Taken # Students % Score 3 or Above Avg. Score 2002 205 105 73% 3.27 2003 204 108 77% 3.35 2004 210 110 76% 3.25 2005 247 127 73% 3.16 2006 328 173 77% 3.28 2007 310 176 70% 3.08 2008 310 164 73% 3.33 2009 359 192 76% 3.39 2010 358 183 78% 3.37 2011 384 193 71% 3.19 2012 478 236 77% 3.14 Percentage Attending College 2003 4-Year College 63% 2-Year College 24% 2004 4-Year College 64% 2-Year College 20% 2005 4-Year College 59.2% 2-Year College 25.5% 2006 4-Year College 63.7% 2-Year College 23.6% 2007 4-Year College 60.9% 2-Year College 25.1% 2008 4-Year College 54.4% 2-Year College 32.6% 2009 4-Year College 55.3% 2-Year College 33.3% 2010 4-Year College 53.1% 2-Year College 34.4% 2011 4-Year College 65.2% 2-Year College 26.9% 2012 4-Year College 60.7% 2-Year College 31.5%