Sobrepeso y obesidad en estudiantes Puerto Rico (2005 2011)
•
0 j'aime•921 vues

High School YRBS

Recommandé
Recommandé
Contenu connexe
En vedette
En vedette (13)
Plus de Dr. Orville M. Disdier
Plus de Dr. Orville M. Disdier (20)
Sobrepeso y obesidad en estudiantes Puerto Rico (2005 2011)
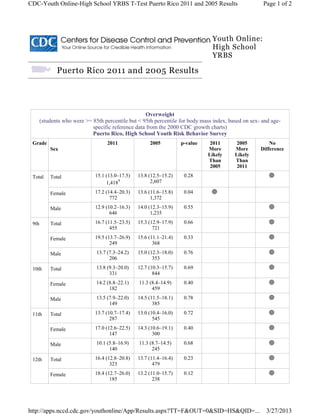
- 1. Puerto Rico 2011 and 2005 Results Sex Overweight (students who were >= 85th percentile but < 95th percentile for body mass index, based on sex- and age- specific reference data from the 2000 CDC growth charts) Puerto Rico, High School Youth Risk Behavior Survey Grade 2011 2005 p-value 2011 More Likely Than 2005 2005 More Likely Than 2011 No Difference Total Total 15.1 (13.0–17.5) 1,418† 13.8 (12.5–15.2) 2,607 0.28 Female 17.2 (14.4–20.3) 772 13.6 (11.6–15.8) 1,372 0.04 Male 12.9 (10.2–16.3) 646 14.0 (12.3–15.9) 1,235 0.55 9th Total 16.7 (11.5–23.5) 455 15.3 (12.9–17.9) 721 0.66 Female 19.5 (13.7–26.9) 249 15.6 (11.1–21.4) 368 0.33 Male 13.7 (7.3–24.2) 206 15.0 (12.3–18.0) 353 0.76 10th Total 13.8 (9.3–20.0) 331 12.7 (10.3–15.7) 844 0.69 Female 14.2 (8.8–22.1) 182 11.3 (8.4–14.9) 459 0.40 Male 13.5 (7.9–22.0) 149 14.5 (11.5–18.1) 385 0.78 11th Total 13.7 (10.7–17.4) 287 13.0 (10.4–16.0) 545 0.72 Female 17.0 (12.6–22.5) 147 14.3 (10.6–19.1) 300 0.40 Male 10.1 (5.8–16.9) 140 11.3 (8.7–14.5) 245 0.68 12th Total 16.4 (12.8–20.8) 323 13.7 (11.4–16.4) 479 0.23 Female 18.4 (12.7–26.0) 185 13.2 (11.0–15.7) 238 0.12 Youth Online: High School YRBS Page 1 of 2CDC-Youth Online-High School YRBS T-Test Puerto Rico 2011 and 2005 Results 3/27/2013http://apps.nccd.cdc.gov/youthonline/App/Results.aspx?TT=F&OUT=0&SID=HS&QID=...
- 2. Puerto Rico 2011 and 2005 Results Sex Obese (Students Who Were >= 95th Percentile For Body Mass Index, Based On Sex- And Age-Specific Reference Data From The 2000 Cdc Growth Charts) Puerto Rico, High School Youth Risk Behavior Survey Grade 2011 2005 p-value 2011 More Likely Than 2005 2005 More Likely Than 2011 No Difference Total Total 11.8 (9.8–14.0) 1,418† 11.8 (10.4–13.3) 2,607 0.99 Female 11.5 (8.8–14.9) 772 8.7 (6.9–10.9) 1,372 0.12 Male 12.1 (9.7–14.9) 646 15.1 (13.2–17.3) 1,235 0.06 9th Total 12.2 (8.4–17.4) 455 12.9 (10.0–16.7) 721 0.79 Female 12.4 (6.8–21.6) 249 9.8 (6.0–15.6) 368 0.53 Male 12.0 (6.7–20.5) 206 16.2 (12.4–20.7) 353 0.28 10th Total 14.4 (8.9–22.3) 331 10.7 (8.1–13.8) 844 0.29 Female 13.8 (8.0–22.9) 182 8.2 (5.2–12.6) 459 0.16 Male 14.9 (9.2–23.2) 149 13.6 (9.8–18.7) 385 0.75 11th Total 10.9 (8.8–13.4) 287 12.3 (9.6–15.7) 545 0.44 Female 10.0 (5.7–16.9) 147 8.7 (5.5–13.4) 300 0.68 Male 11.9 (7.6–18.1) 140 16.9 (12.4–22.6) 245 0.16 12th Total 9.3 (6.5–13.1) 323 10.2 (7.9–13.1) 479 0.63 Female 9.1 (5.3–15.2) 185 7.8 (5.4–11.3) 238 0.65 Youth Online: High School YRBS Page 1 of 2CDC-Youth Online-High School YRBS T-Test Puerto Rico 2011 and 2005 Results 3/27/2013http://apps.nccd.cdc.gov/youthonline/App/Results.aspx?TT=F&OUT=0&SID=HS&QID=...
- 3. Sex Obese (Students Who Were >= 95th Percentile For Body Mass Index, Based On Sex- And Age-Specific Reference Data From The 2000 Cdc Growth Charts) Puerto Rico, High School Youth Risk Behavior Survey Grade 2011 2005 p-value 2011 More Likely Than 2005 2005 More Likely Than 2011 No Difference Male 9.5 (5.7–15.4) 138 12.6 (9.1–17.2) 241 0.30 † Percentage, confidence interval, cell size Footnotes Centers for Disease Control and Prevention 1600 Clifton Rd. Atlanta, GA 30333, USA 800-CDC-INFO (800-232-4636) TTY: (888) 232-6348, 24 Hours/Every Day - cdcinfo@cdc.gov URL:http://apps.nccd.cdc.gov/youthonline/App/Results.aspx? TT=F&OUT=0&SID=HS&QID=QNOBESE&LID=PR&YID=2011&LID2=PR&YID2=2005&COL=G&ROW1=S&ROW2= &FR=1&FG=&FSL=1&FRL=&FGL=1&PV=&TST=True&C1=2011&C2=2005&QP=G&DP=1&VA=CI&CS=Y&SYID=& LT&SO=ASC&PF=1 Page 2 of 2CDC-Youth Online-High School YRBS T-Test Puerto Rico 2011 and 2005 Results 3/27/2013http://apps.nccd.cdc.gov/youthonline/App/Results.aspx?TT=F&OUT=0&SID=HS&QID=...